| Param | Original file | Final file |
|---|---|---|
| Filename | modeM0/AS1A14_083T10_9000006566_57136cztM0_level2.fits | modeM0/AS1A14_083T10_9000006566_57136cztM0_level2_quad_clean.evt |
| Size (bytes) | 1,368,552,960 | 161,435,520 |
| Size | 1.3 GB | 154.0 MB |
| Events in quadrant A | 8,212,000 | 1,128,160 |
| Events in quadrant B | 7,939,966 | 1,256,282 |
| Events in quadrant C | 14,320,144 | 766,590 |
| Events in quadrant D | 19,179,981 | 837,012 |
| Mode M9 | |||
|---|---|---|---|
| Quadrant | BADHDUFLAG | Total packets | Discarded packets |
| A | 0 | 4 | 0 |
| B | 0 | 4 | 0 |
| C | 0 | 4 | 0 |
| D | 0 | 4 | 0 |
| Mode M0 | |||
|---|---|---|---|
| Quadrant | BADHDUFLAG | Total packets | Discarded packets |
| A | 0 | 34019 | 1 |
| B | 0 | 32752 | 1 |
| C | 0 | 51751 | 1 |
| D | 0 | 66151 | 1 |
| Mode SS | |||
|---|---|---|---|
| Quadrant | BADHDUFLAG | Total packets | Discarded packets |
| A | 0 | 264 | 0 |
| B | 0 | 264 | 0 |
| C | 0 | 264 | 0 |
| D | 0 | 264 | 0 |
| Quadrant | Total seconds | Saturated seconds | Saturation percentage |
|---|---|---|---|
| A | 13021 | 1023 | 7.856539% |
| B | 13021 | 841 | 6.458797% |
| C | 13021 | 4746 | 36.448813% |
| D | 13020 | 3463 | 26.597542% |
Noise dominated data is calculated using 1-second bins in cleaned event files. If a bin has >2000 counts, and if more than 50% of those come from <1% of pixels, then it is considered to be noise-dominated and hence unusable.
| Quadrant | # 1 sec bins | Bins with >0 counts | Bins with >2000 counts | High rate bins dominated by noise | Noise dominated (total time) | Noise dominated (detector-on time) | Marked lightcurve |
|---|---|---|---|---|---|---|---|
| A | 13366 | 13021 | 865 | 865 | 6.47% | 6.64% | 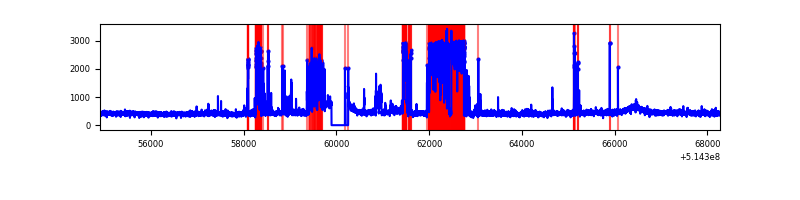 |
| B | 13366 | 13021 | 489 | 489 | 3.66% | 3.76% | 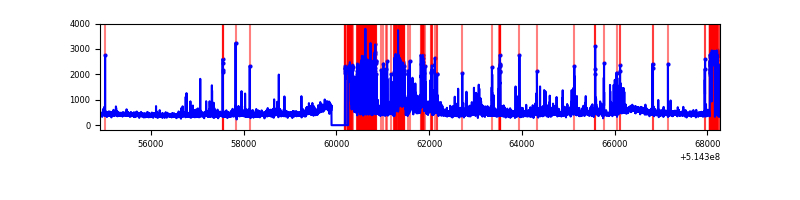 |
| C | 13366 | 13023 | 3276 | 3276 | 24.51% | 25.16% | 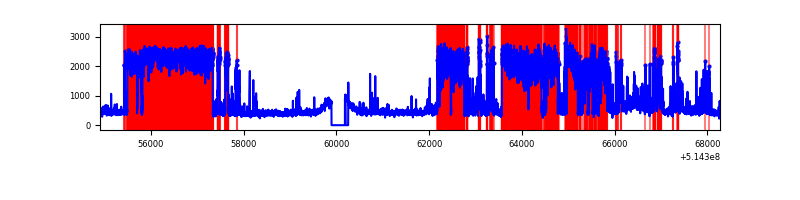 |
| D | 13365 | 13020 | 3483 | 3483 | 26.06% | 26.75% | 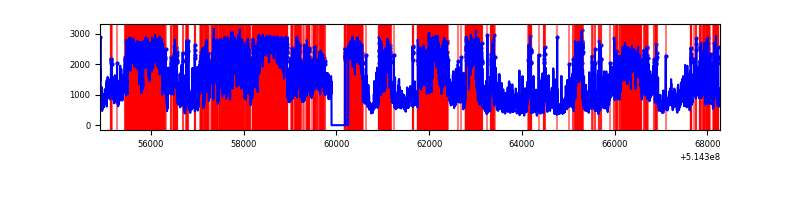 |
Top three noisy pixels from each quadrant. If the there are fewer than three noisy pixels in the level2.evt file, extra rows are filled as -1
| Pixel properties | Quadrant properties | ||||||
|---|---|---|---|---|---|---|---|
| Quadrant | DetID | PixID | Counts | Sigma | Mean | Median | Sigma |
| A | 3 | 14 | 2764122 | 8188.98 | 1372 | 1337 | 337.4 |
| A | 5 | 113 | 65009 | 188.73 | 1372 | 1337 | 337.4 |
| A | 10 | 251 | 55530 | 160.63 | 1372 | 1337 | 337.4 |
| B | 10 | 16 | 1743528 | 6004.12 | 1356 | 1303 | 290.2 |
| B | 5 | 172 | 428351 | 1471.71 | 1356 | 1303 | 290.2 |
| B | 0 | 213 | 95351 | 324.11 | 1356 | 1303 | 290.2 |
| C | 15 | 198 | 9225189 | 34041.34 | 1005 | 994 | 271.0 |
| C | 12 | 252 | 1102026 | 4063.29 | 1005 | 994 | 271.0 |
| C | 14 | 254 | 52218 | 189.04 | 1005 | 994 | 271.0 |
| D | 15 | 142 | 12843155 | 36892.98 | 1242 | 1187 | 348.1 |
| D | 8 | 240 | 344742 | 986.98 | 1242 | 1187 | 348.1 |
| D | 2 | 249 | 316797 | 906.7 | 1242 | 1187 | 348.1 |
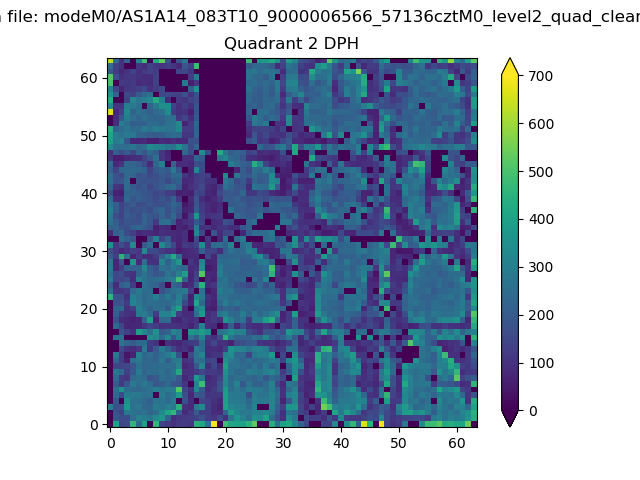
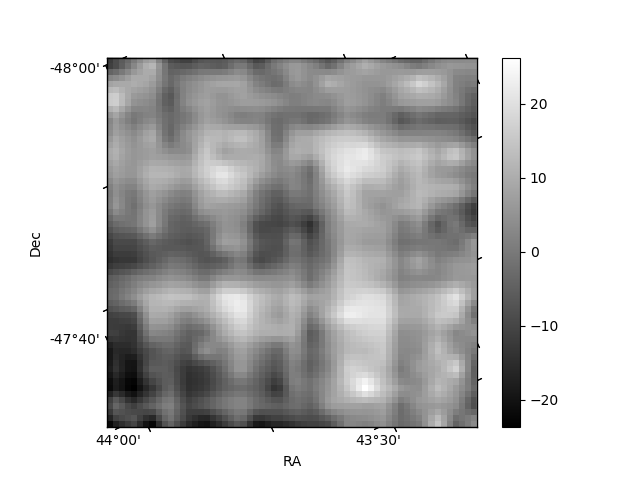
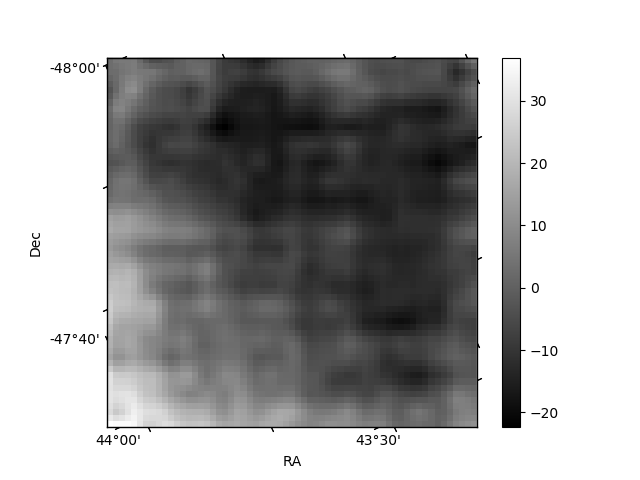
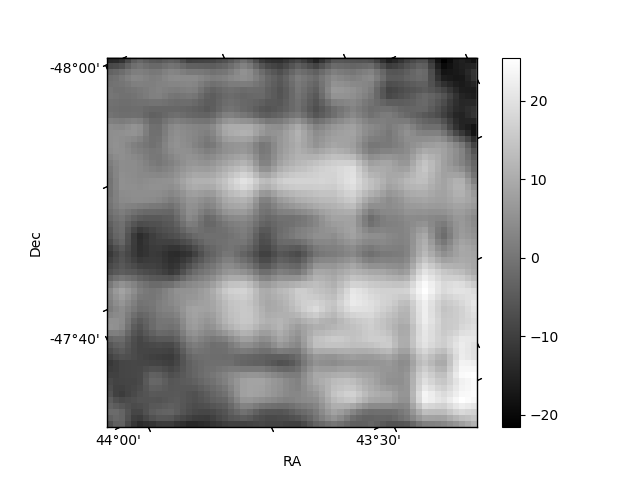
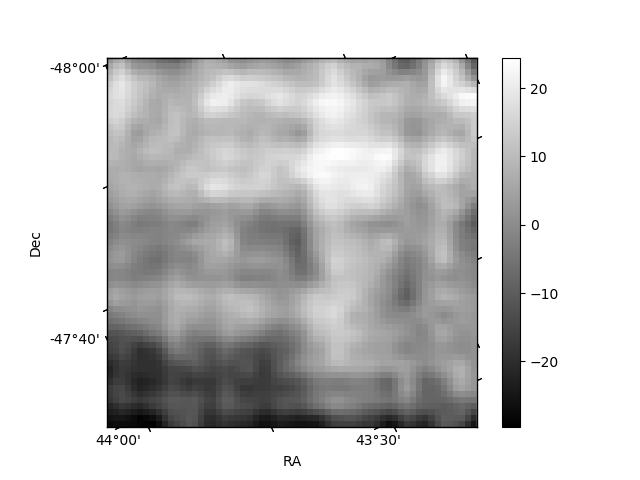
Histogram calculated using DETX and DETY for each event in the final _common_clean file
| Quadrant A | 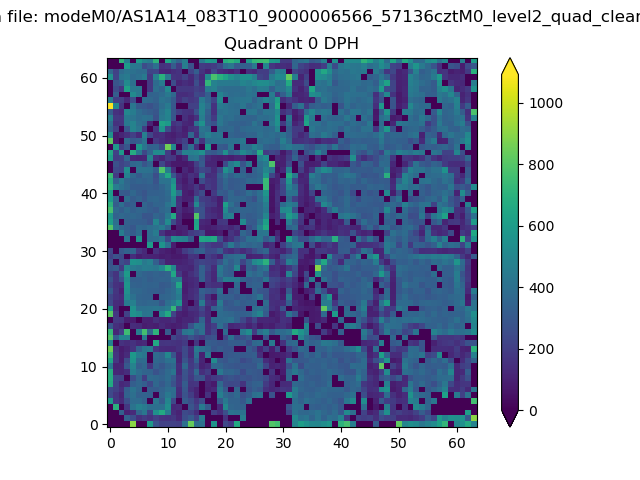 |
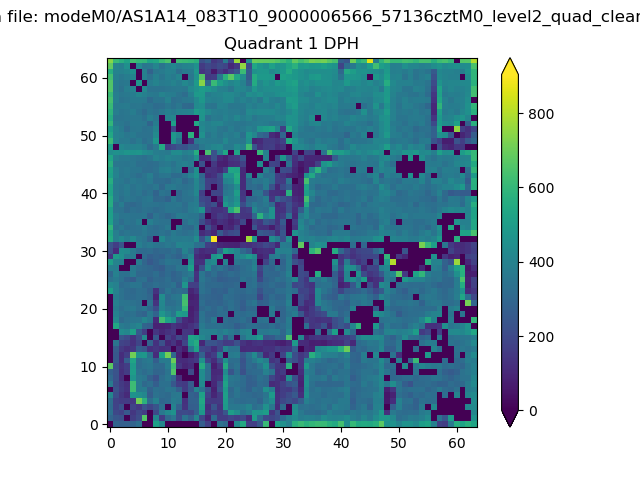 |
Quadrant B |
|---|---|---|---|
| Quadrant D | 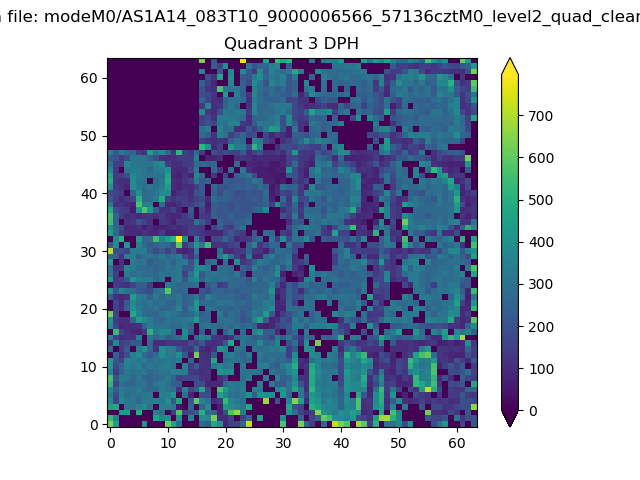 |
 |
Quadrant C |
| Plot type | Count rate plots | Images |
|---|---|---|
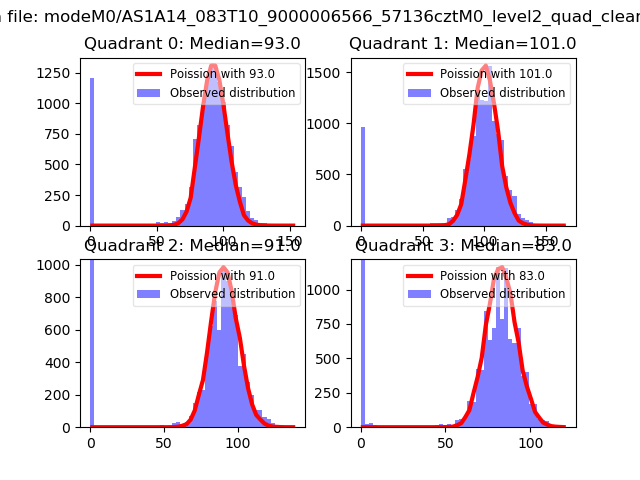
| Comparison with Poisson distribution Blue bars denote a histogram of data divided into 1 sec bins. Red curve is a Poisson curve with rate = median count rate of data. |
 |
 |
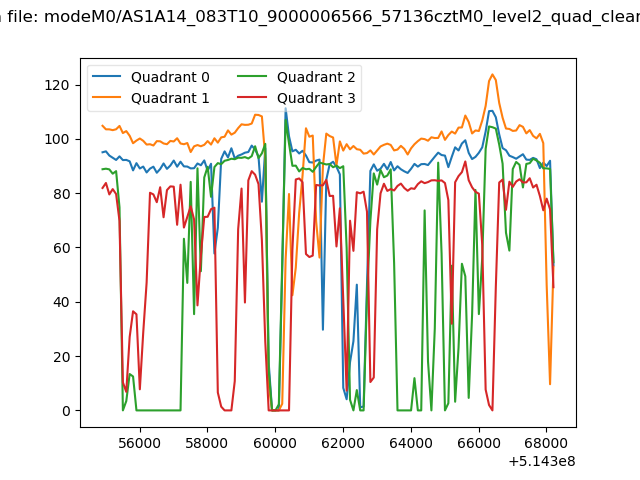
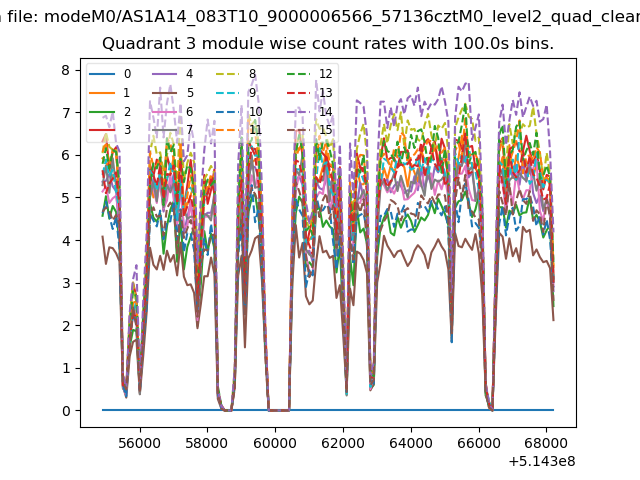
| Quadrant-wise count rates Data is divided into 100 sec bins |
 |
|
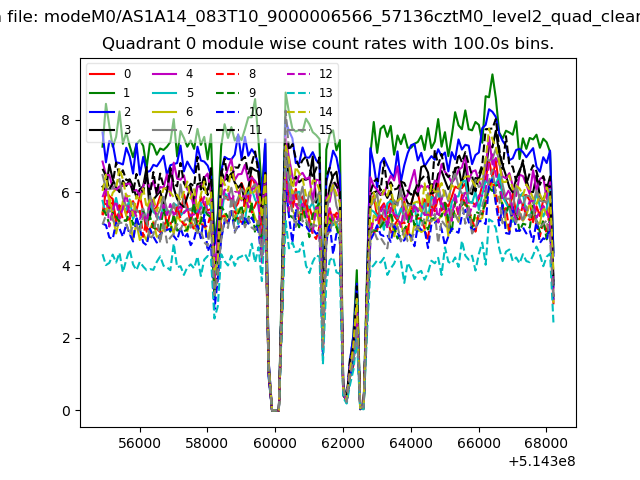
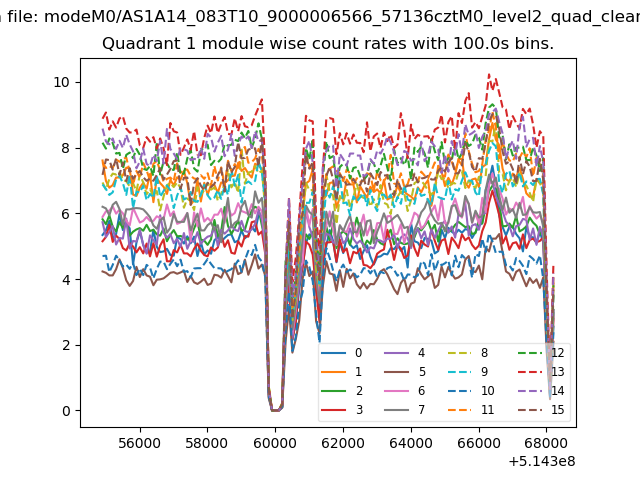
| Module-wise count rates for Quadrant A Data is divided into 100 sec bins |
 |
 |
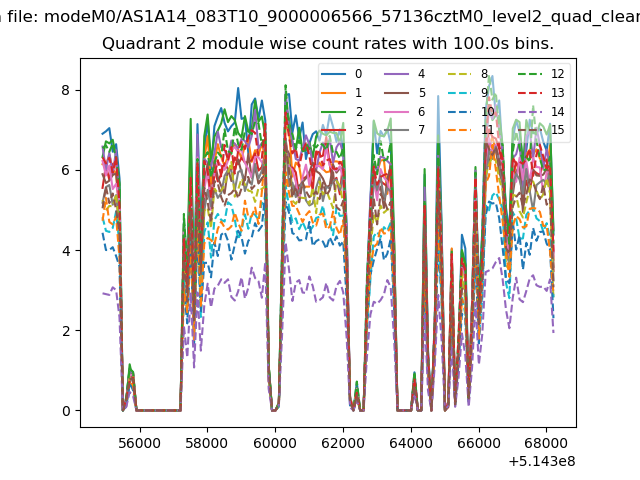
| Module-wise count rates for Quadrant B Data is divided into 100 sec bins |
 |
 |
| Module-wise count rates for Quadrant C Data is divided into 100 sec bins |
 |
 |
| Module-wise count rates for Quadrant D Data is divided into 100 sec bins |
 |
 |
| Parameter | Plot |
|---|---|
| CZT HV Monitor | 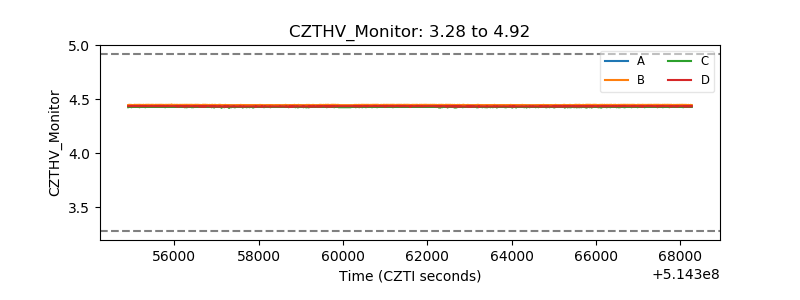 |
| D_VDD | 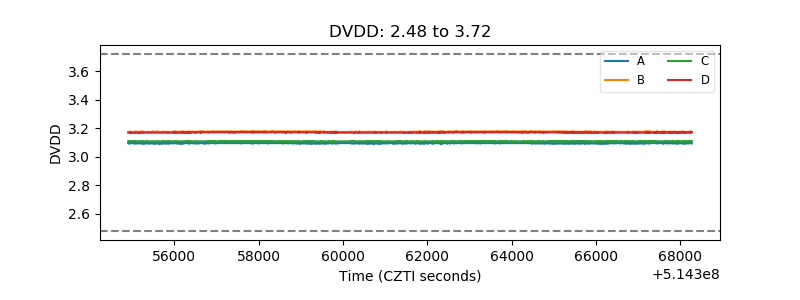 |
| Temperature 1 | 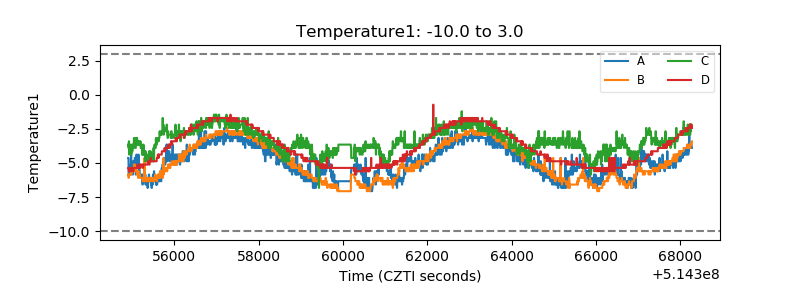 |
| Veto HV Monitor | 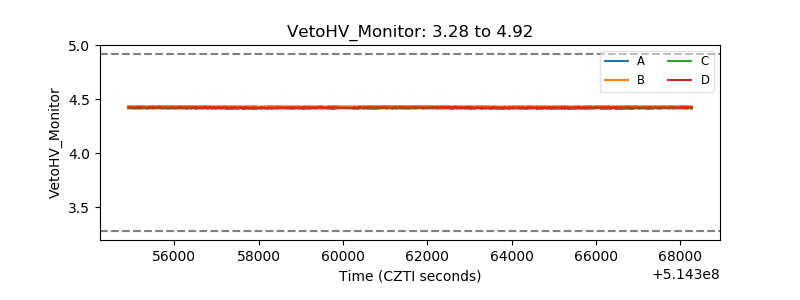 |
| Veto LLD | 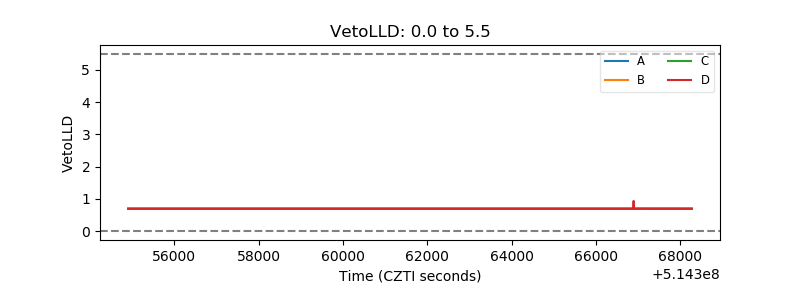 |
| Alpha Counter | 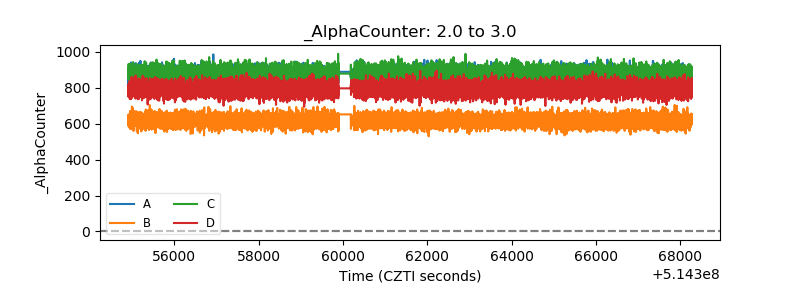 |
| _CPM_Rate | 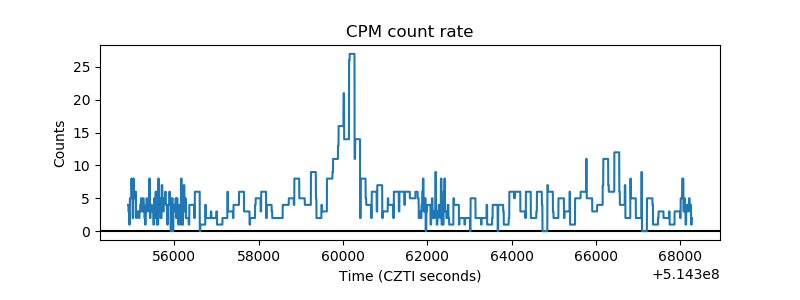 |
| CZT Counter | 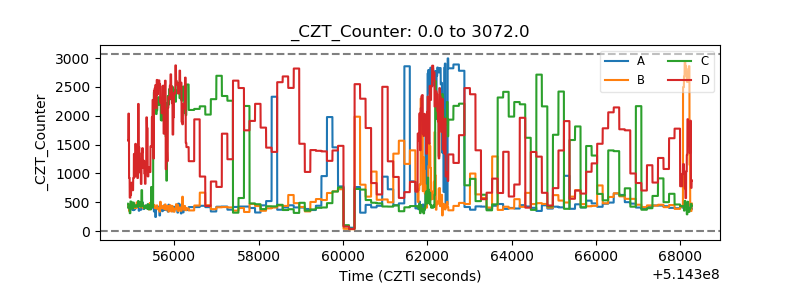 |
| +2.5 Volts monitor | 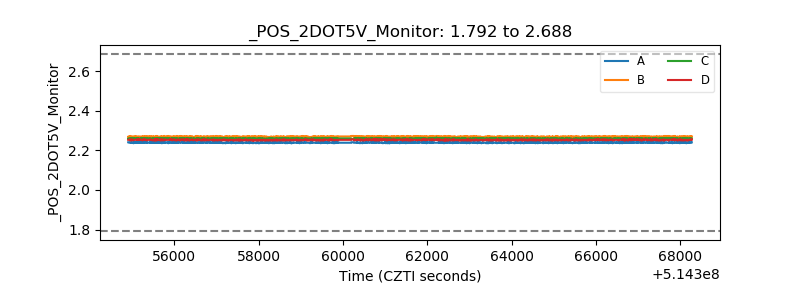 |
| +5 Volts monitor | 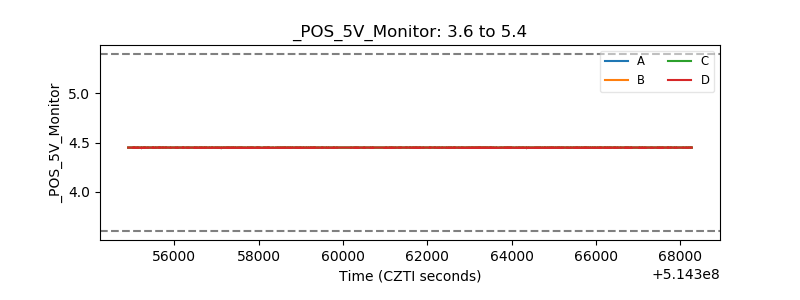 |
| _ROLL_ROT | 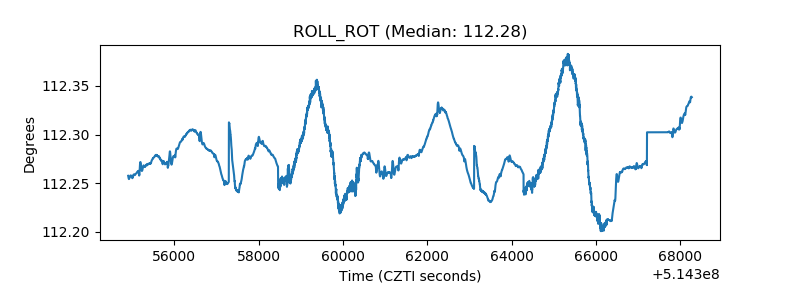 |
| _Roll_DEC | 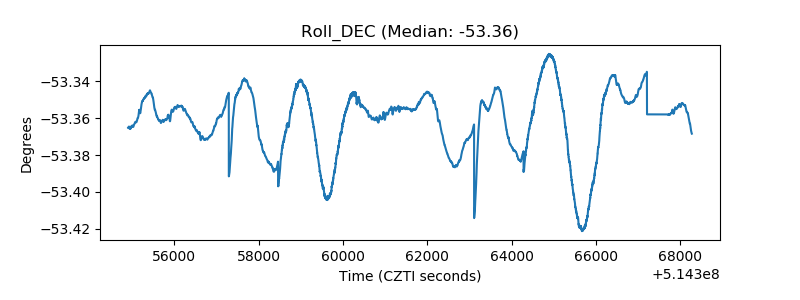 |
| _Roll_RA | 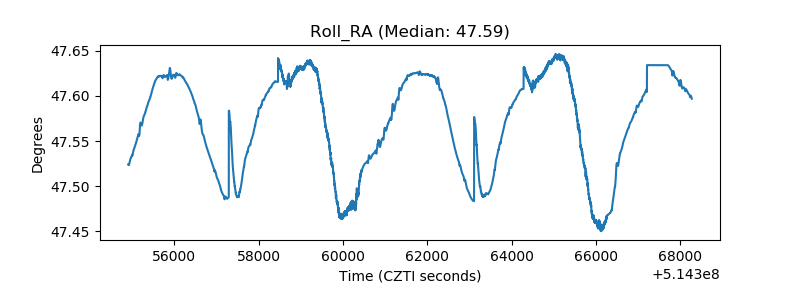 |
| Veto Counter | 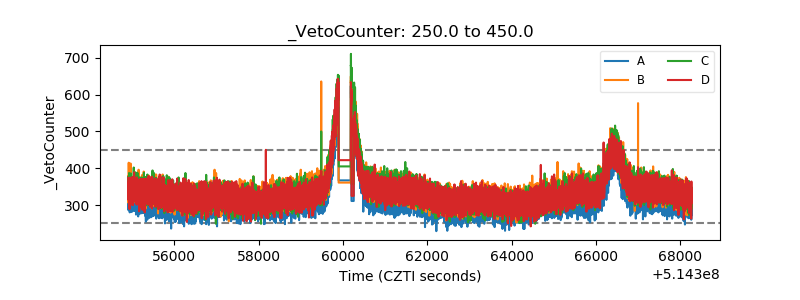 |