| Param | Original file | Final file |
|---|---|---|
| Filename | modeM0/AS1A14_083T10_9000006566_57137cztM0_level2.fits | modeM0/AS1A14_083T10_9000006566_57137cztM0_level2_quad_clean.evt |
| Size (bytes) | 531,328,320 | 106,476,480 |
| Size | 506.7 MB | 101.5 MB |
| Events in quadrant A | 3,233,703 | 709,342 |
| Events in quadrant B | 3,734,873 | 748,139 |
| Events in quadrant C | 5,667,221 | 620,599 |
| Events in quadrant D | 6,449,747 | 623,965 |
| Mode M0 | |||
|---|---|---|---|
| Quadrant | BADHDUFLAG | Total packets | Discarded packets |
| A | 0 | 15219 | 0 |
| B | 0 | 16432 | 0 |
| C | 0 | 22335 | 0 |
| D | 0 | 24447 | 0 |
| Mode SS | |||
|---|---|---|---|
| Quadrant | BADHDUFLAG | Total packets | Discarded packets |
| A | 0 | 150 | 0 |
| B | 0 | 150 | 0 |
| C | 0 | 150 | 0 |
| D | 0 | 150 | 0 |
| Quadrant | Total seconds | Saturated seconds | Saturation percentage |
|---|---|---|---|
| A | 7502 | 5 | 0.066649% |
| B | 7503 | 175 | 2.332400% |
| C | 7503 | 724 | 9.649474% |
| D | 7503 | 261 | 3.478609% |
Noise dominated data is calculated using 1-second bins in cleaned event files. If a bin has >2000 counts, and if more than 50% of those come from <1% of pixels, then it is considered to be noise-dominated and hence unusable.
| Quadrant | # 1 sec bins | Bins with >0 counts | Bins with >2000 counts | High rate bins dominated by noise | Noise dominated (total time) | Noise dominated (detector-on time) | Marked lightcurve |
|---|---|---|---|---|---|---|---|
| A | 7502 | 7502 | 1 | 1 | 0.01% | 0.01% | 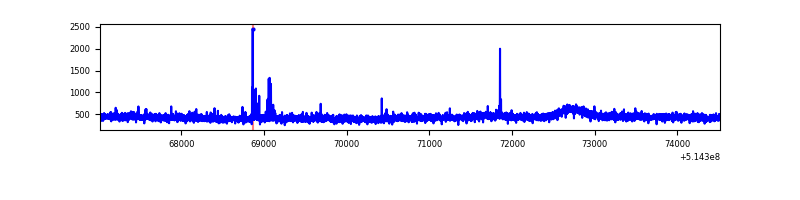 |
| B | 7503 | 7503 | 158 | 158 | 2.11% | 2.11% | 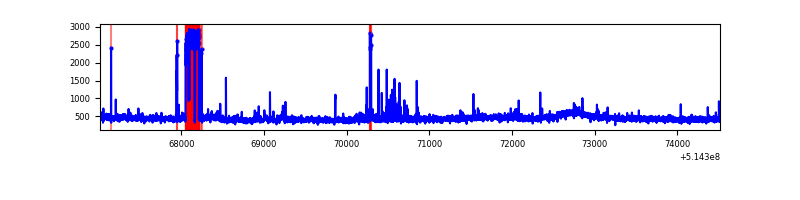 |
| C | 7503 | 7503 | 457 | 457 | 6.09% | 6.09% | 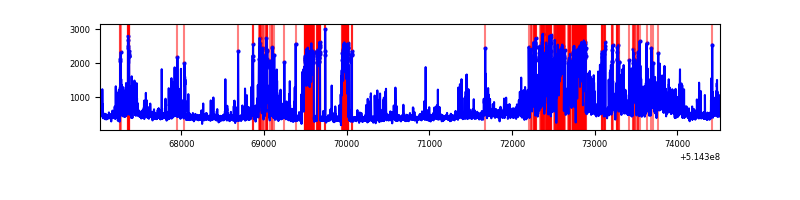 |
| D | 7503 | 7503 | 313 | 313 | 4.17% | 4.17% | 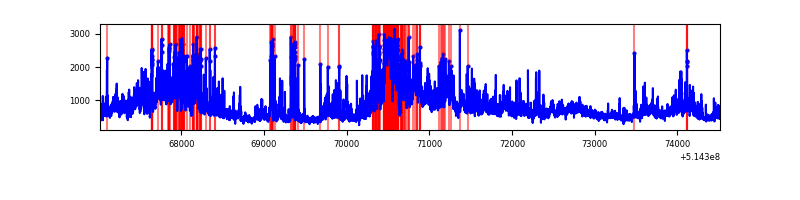 |
Top three noisy pixels from each quadrant. If the there are fewer than three noisy pixels in the level2.evt file, extra rows are filled as -1
| Pixel properties | Quadrant properties | ||||||
|---|---|---|---|---|---|---|---|
| Quadrant | DetID | PixID | Counts | Sigma | Mean | Median | Sigma |
| A | 3 | 14 | 36863 | 180.33 | 811 | 790 | 200.0 |
| A | 10 | 251 | 19175 | 91.91 | 811 | 790 | 200.0 |
| A | 5 | 113 | 17172 | 81.89 | 811 | 790 | 200.0 |
| B | 5 | 172 | 408739 | 2394.14 | 788 | 757 | 170.4 |
| B | 10 | 16 | 80281 | 466.67 | 788 | 757 | 170.4 |
| B | 0 | 199 | 33720 | 193.44 | 788 | 757 | 170.4 |
| C | 12 | 252 | 1802007 | 8970.93 | 731 | 724 | 200.8 |
| C | 15 | 198 | 954031 | 4747.76 | 731 | 724 | 200.8 |
| C | 14 | 254 | 26098 | 126.37 | 731 | 724 | 200.8 |
| D | 15 | 142 | 2487514 | 11283.5 | 781 | 745 | 220.4 |
| D | 2 | 249 | 293743 | 1329.45 | 781 | 745 | 220.4 |
| D | 8 | 240 | 273092 | 1235.75 | 781 | 745 | 220.4 |
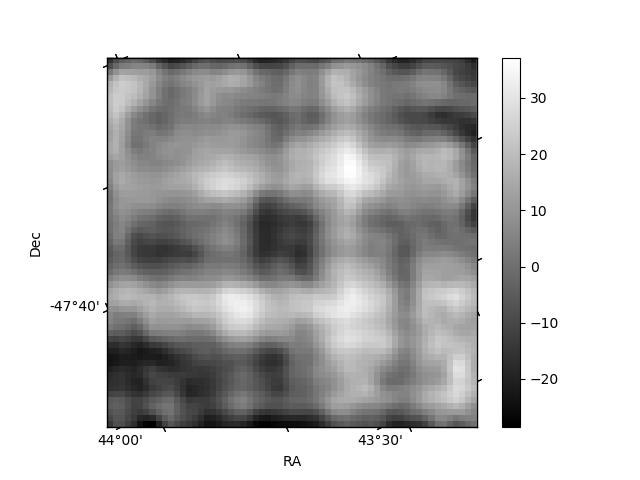
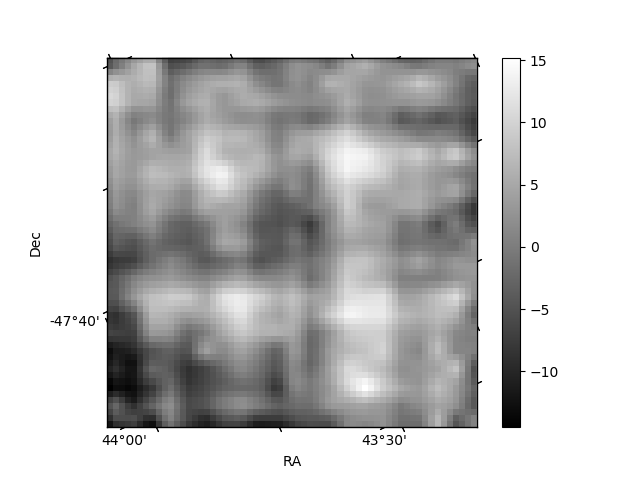
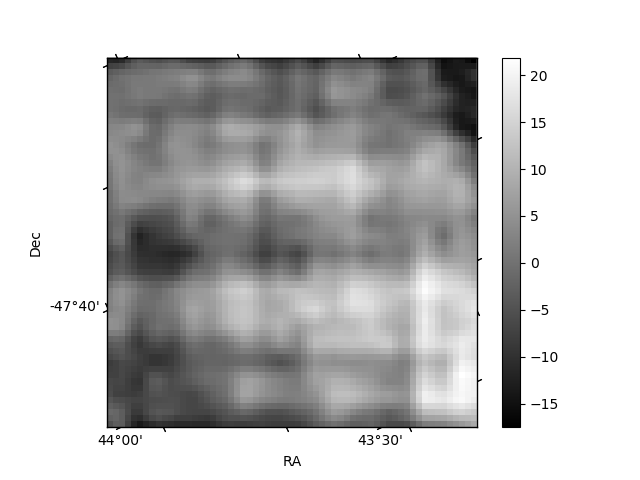
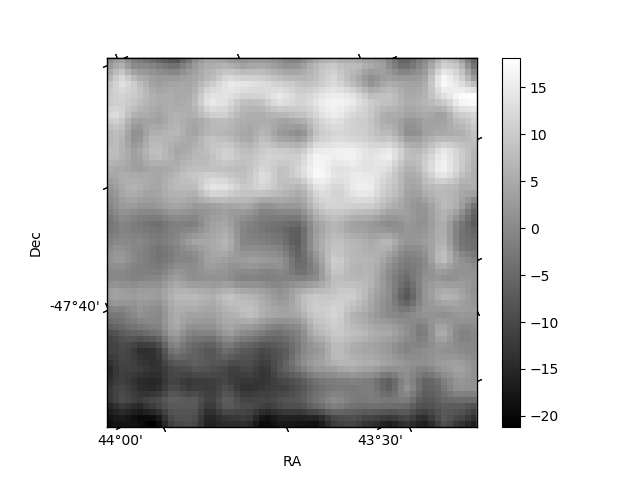
Histogram calculated using DETX and DETY for each event in the final _common_clean file
| Quadrant A | 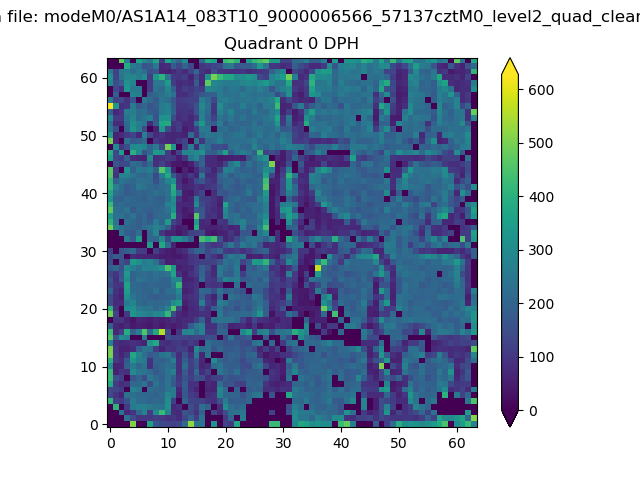 |
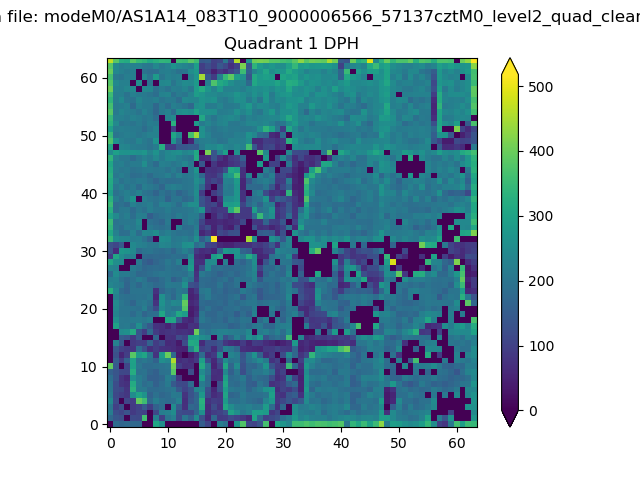 |
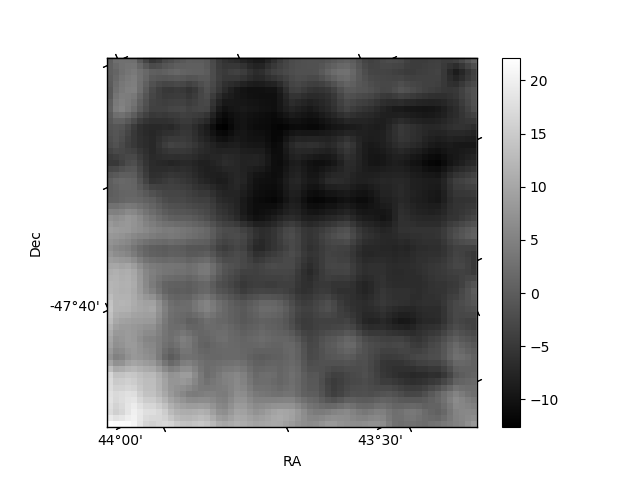
Quadrant B |
|---|---|---|---|
| Quadrant D | 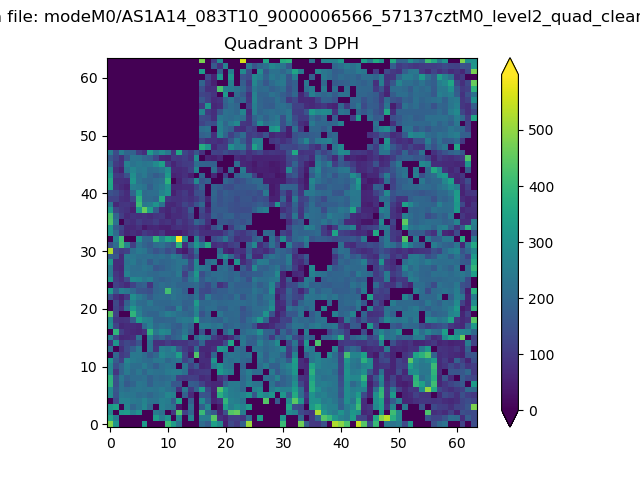 |
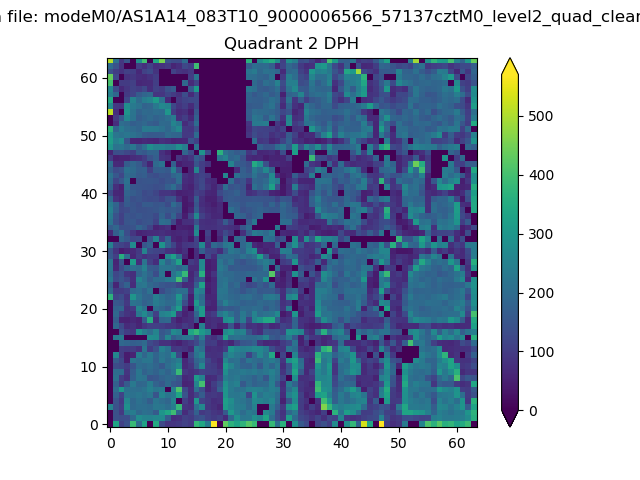 |
Quadrant C |
| Plot type | Count rate plots | Images |
|---|---|---|
| Comparison with Poisson distribution Blue bars denote a histogram of data divided into 1 sec bins. Red curve is a Poisson curve with rate = median count rate of data. |
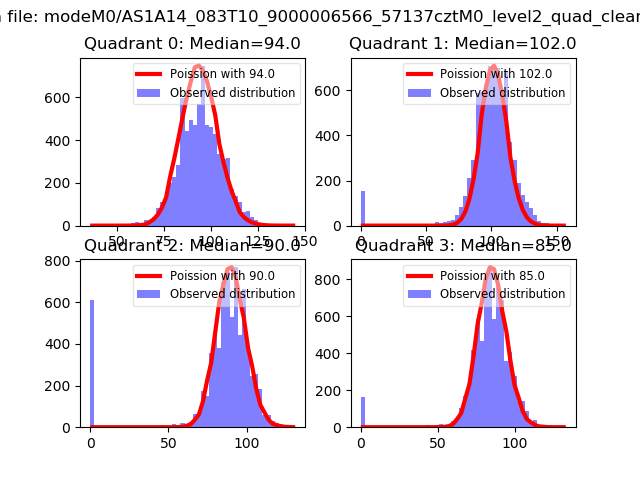 |
 |
| Quadrant-wise count rates Data is divided into 100 sec bins |
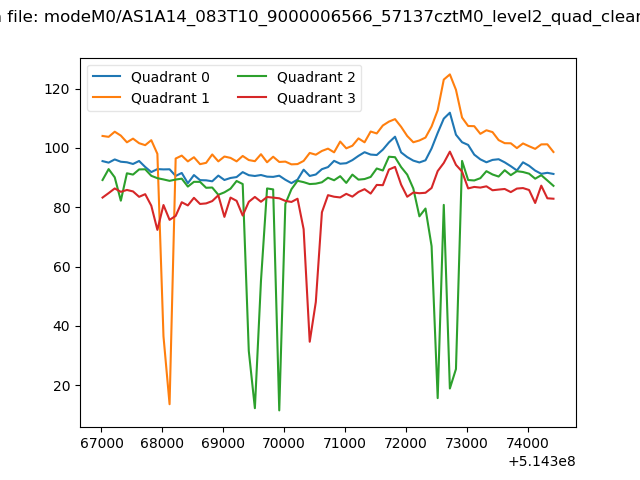 |
|
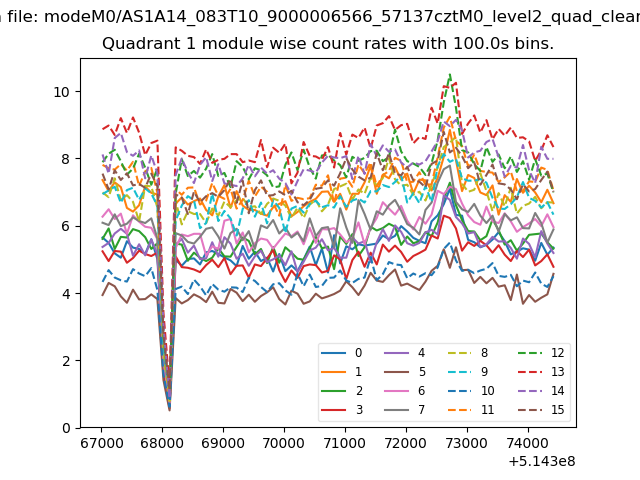
| Module-wise count rates for Quadrant A Data is divided into 100 sec bins |
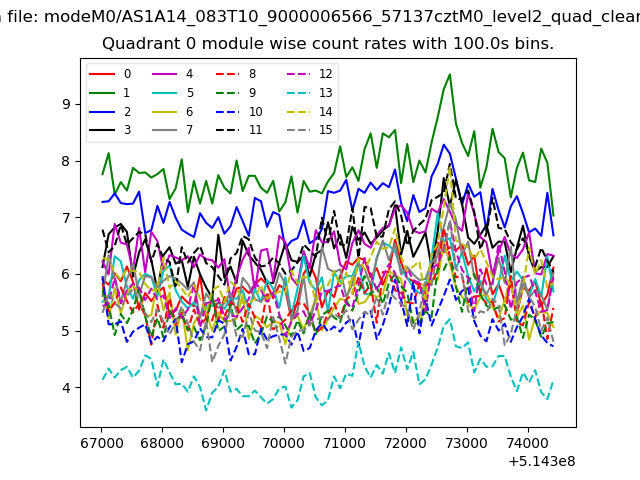 |
 |
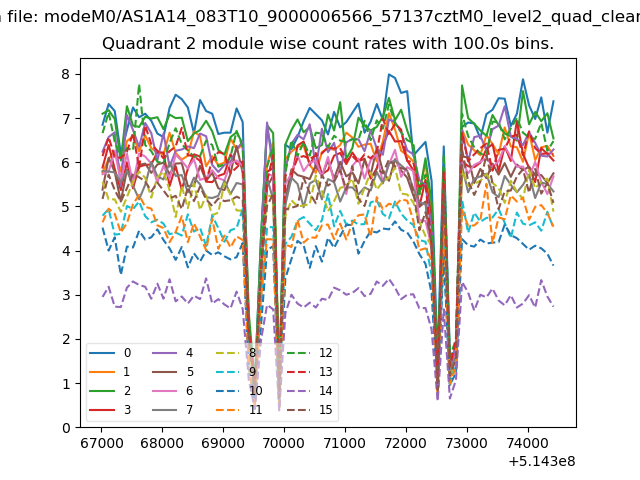
| Module-wise count rates for Quadrant B Data is divided into 100 sec bins |
 |
 |
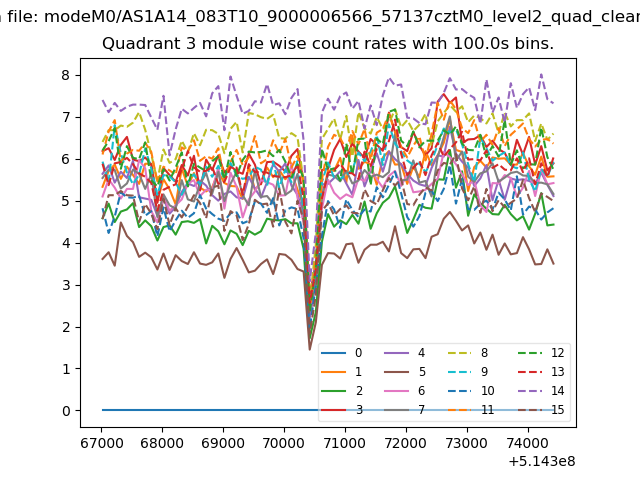
| Module-wise count rates for Quadrant C Data is divided into 100 sec bins |
 |
 |
| Module-wise count rates for Quadrant D Data is divided into 100 sec bins |
 |
 |
| Parameter | Plot |
|---|---|
| CZT HV Monitor | 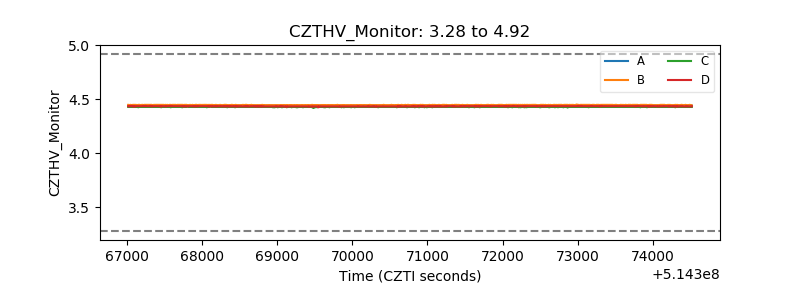 |
| D_VDD | 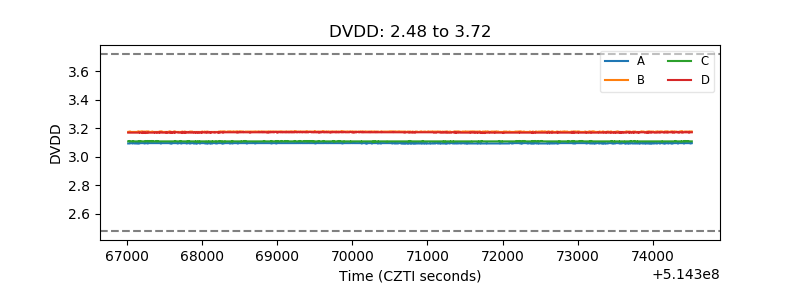 |
| Temperature 1 | 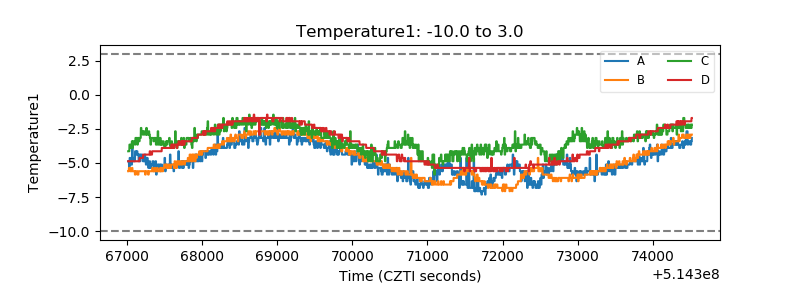 |
| Veto HV Monitor | 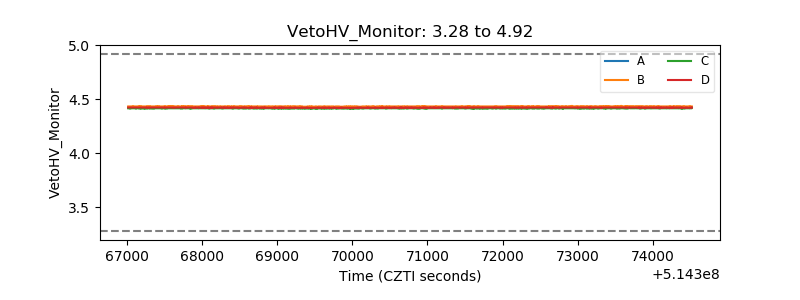 |
| Veto LLD | 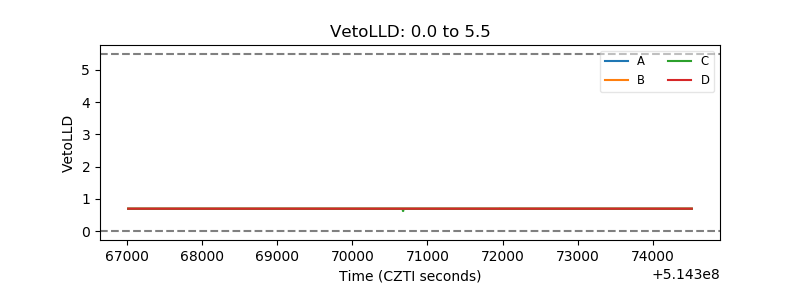 |
| Alpha Counter | 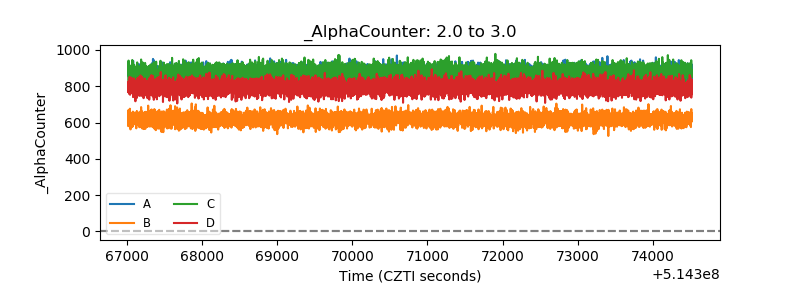 |
| _CPM_Rate | 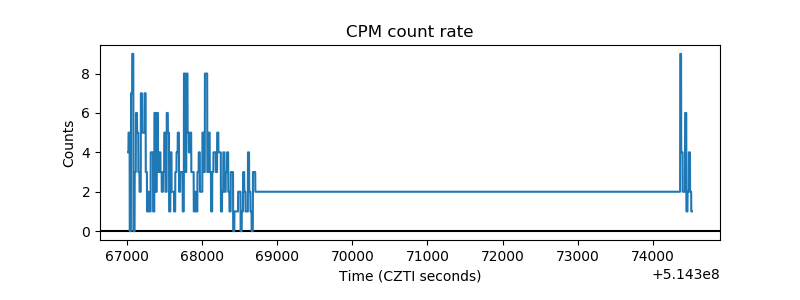 |
| CZT Counter | 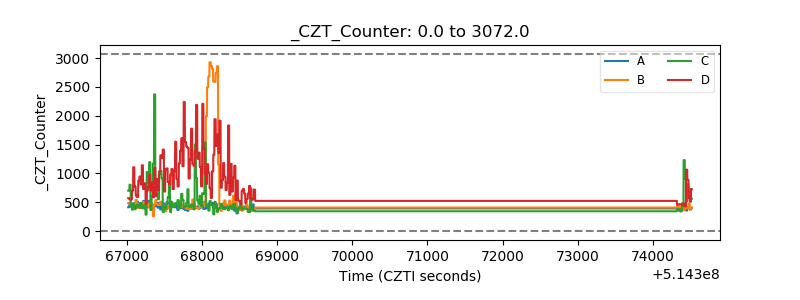 |
| +2.5 Volts monitor | 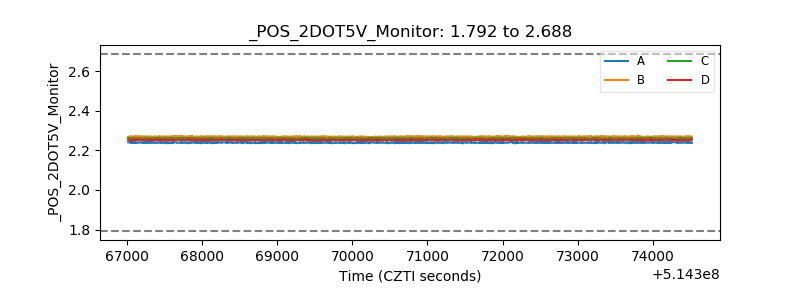 |
| +5 Volts monitor | 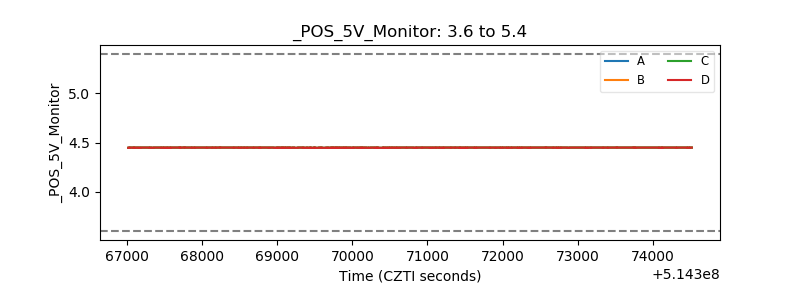 |
| _ROLL_ROT | 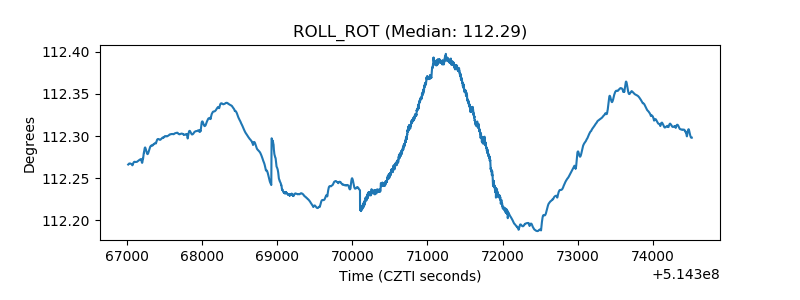 |
| _Roll_DEC | 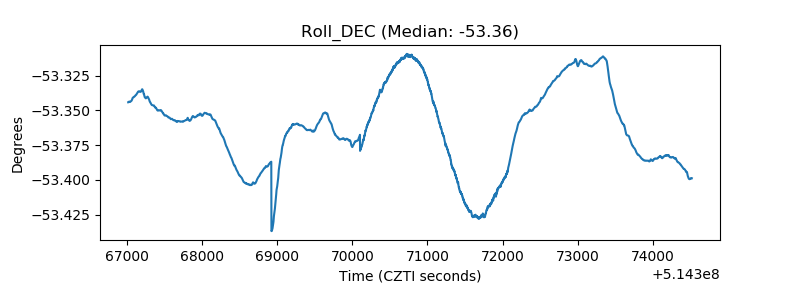 |
| _Roll_RA | 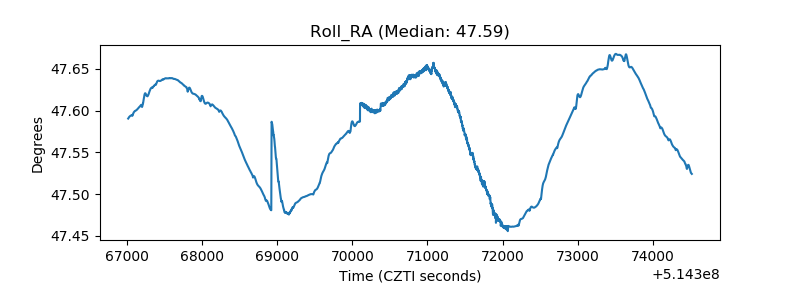 |
| Veto Counter | 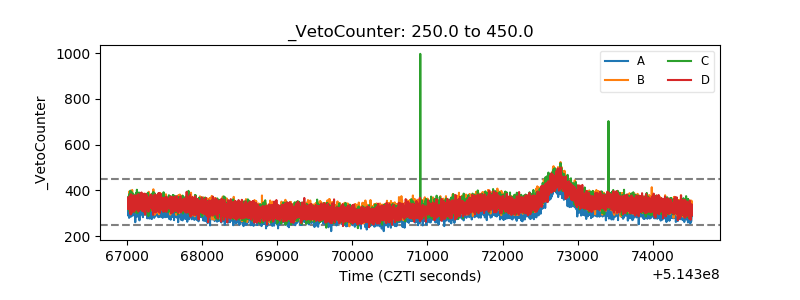 |