| Param | Original file | Final file |
|---|---|---|
| Filename | modeM0/AS1A14_083T10_9000006566_57140cztM0_level2.fits | modeM0/AS1A14_083T10_9000006566_57140cztM0_level2_quad_clean.evt |
| Size (bytes) | 1,294,398,720 | 229,867,200 |
| Size | 1.2 GB | 219.2 MB |
| Events in quadrant A | 7,173,330 | 1,547,157 |
| Events in quadrant B | 8,479,102 | 1,634,612 |
| Events in quadrant C | 13,002,399 | 1,386,093 |
| Events in quadrant D | 17,986,772 | 1,255,619 |
| Mode M9 | |||
|---|---|---|---|
| Quadrant | BADHDUFLAG | Total packets | Discarded packets |
| A | 0 | 3 | 0 |
| B | 0 | 3 | 0 |
| C | 0 | 3 | 0 |
| D | 0 | 3 | 0 |
| Mode M0 | |||
|---|---|---|---|
| Quadrant | BADHDUFLAG | Total packets | Discarded packets |
| A | 0 | 33666 | 1 |
| B | 0 | 36932 | 1 |
| C | 0 | 50303 | 1 |
| D | 0 | 64903 | 1 |
| Mode SS | |||
|---|---|---|---|
| Quadrant | BADHDUFLAG | Total packets | Discarded packets |
| A | 0 | 332 | 0 |
| B | 0 | 332 | 0 |
| C | 0 | 332 | 0 |
| D | 0 | 332 | 0 |
| Quadrant | Total seconds | Saturated seconds | Saturation percentage |
|---|---|---|---|
| A | 16473 | 127 | 0.770959% |
| B | 16473 | 439 | 2.664967% |
| C | 16472 | 1246 | 7.564352% |
| D | 16472 | 1984 | 12.044682% |
Noise dominated data is calculated using 1-second bins in cleaned event files. If a bin has >2000 counts, and if more than 50% of those come from <1% of pixels, then it is considered to be noise-dominated and hence unusable.
| Quadrant | # 1 sec bins | Bins with >0 counts | Bins with >2000 counts | High rate bins dominated by noise | Noise dominated (total time) | Noise dominated (detector-on time) | Marked lightcurve |
|---|---|---|---|---|---|---|---|
| A | 16803 | 16474 | 12 | 12 | 0.07% | 0.07% | 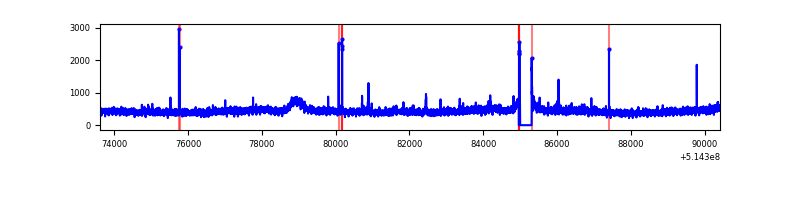 |
| B | 16803 | 16473 | 210 | 210 | 1.25% | 1.27% | 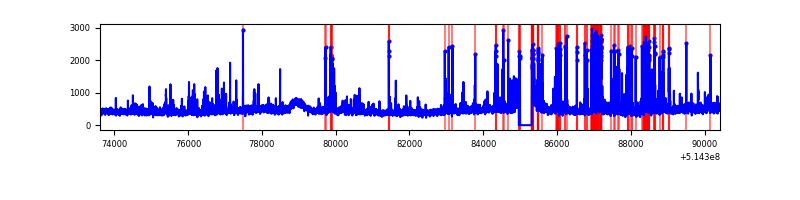 |
| C | 16802 | 16474 | 1046 | 1046 | 6.23% | 6.35% | 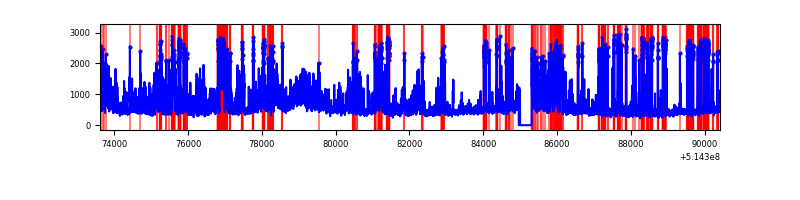 |
| D | 16802 | 16473 | 1816 | 1816 | 10.81% | 11.02% | 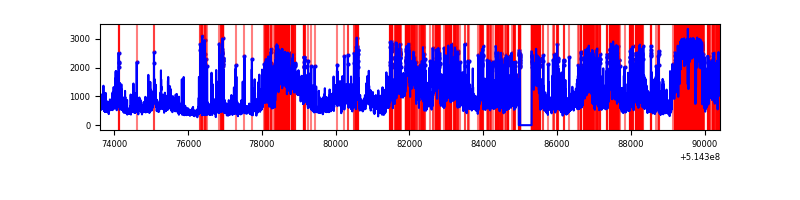 |
Top three noisy pixels from each quadrant. If the there are fewer than three noisy pixels in the level2.evt file, extra rows are filled as -1
| Pixel properties | Quadrant properties | ||||||
|---|---|---|---|---|---|---|---|
| Quadrant | DetID | PixID | Counts | Sigma | Mean | Median | Sigma |
| A | 3 | 14 | 144004 | 325.82 | 1785 | 1744 | 436.6 |
| A | 5 | 113 | 38868 | 85.03 | 1785 | 1744 | 436.6 |
| A | 4 | 3 | 35455 | 77.21 | 1785 | 1744 | 436.6 |
| B | 10 | 16 | 870863 | 2333.72 | 1741 | 1671 | 372.4 |
| B | 10 | 247 | 205535 | 547.36 | 1741 | 1671 | 372.4 |
| B | 0 | 213 | 130356 | 345.51 | 1741 | 1671 | 372.4 |
| C | 12 | 252 | 4434733 | 9917.91 | 1652 | 1638 | 447.0 |
| C | 15 | 198 | 1723654 | 3852.57 | 1652 | 1638 | 447.0 |
| C | 14 | 254 | 173094 | 383.59 | 1652 | 1638 | 447.0 |
| D | 15 | 142 | 6430998 | 14011.26 | 1628 | 1549 | 458.9 |
| D | 12 | 33 | 1956354 | 4259.97 | 1628 | 1549 | 458.9 |
| D | 6 | 159 | 1475745 | 3212.61 | 1628 | 1549 | 458.9 |
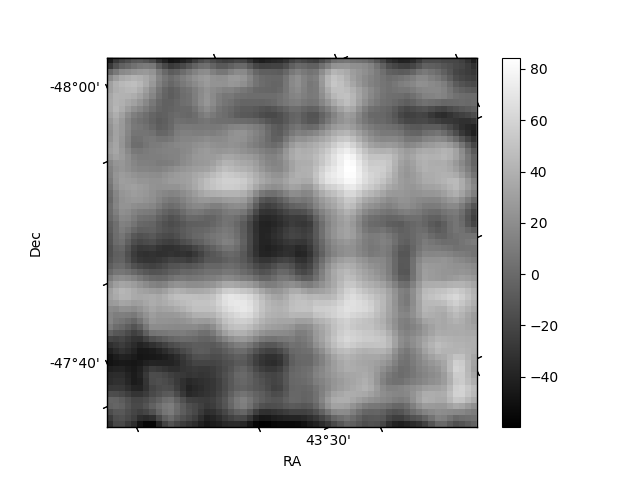
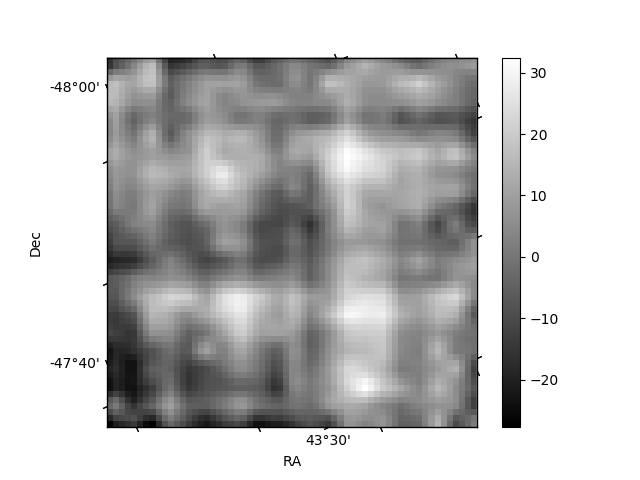
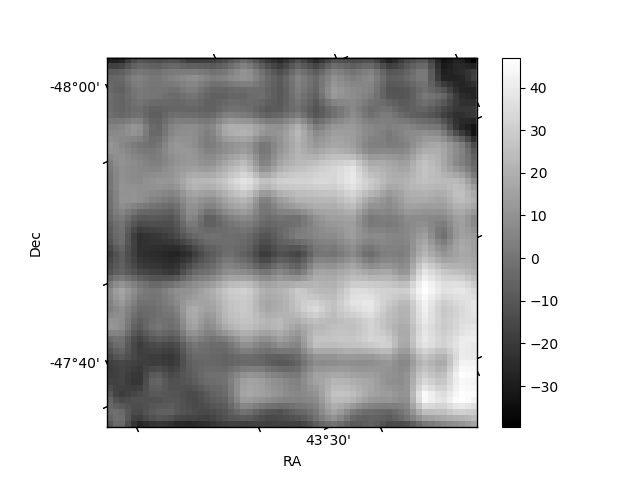
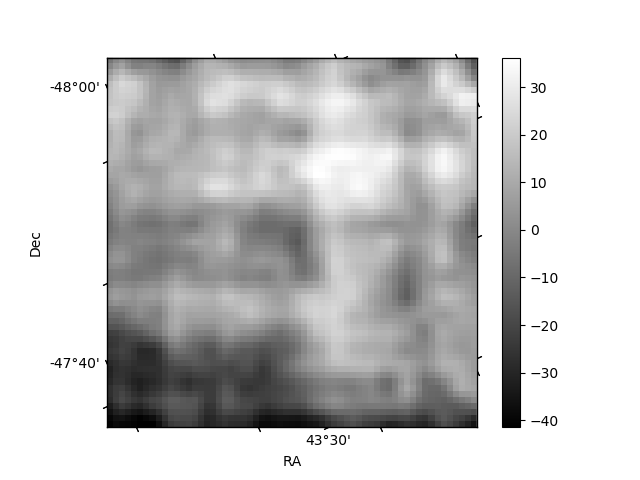
Histogram calculated using DETX and DETY for each event in the final _common_clean file
| Quadrant A | 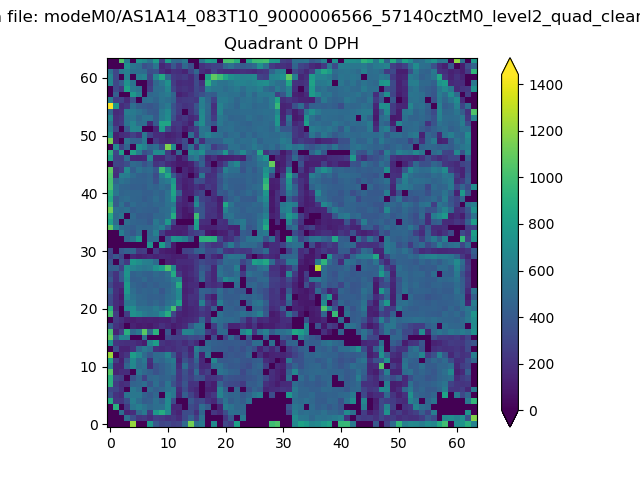 |
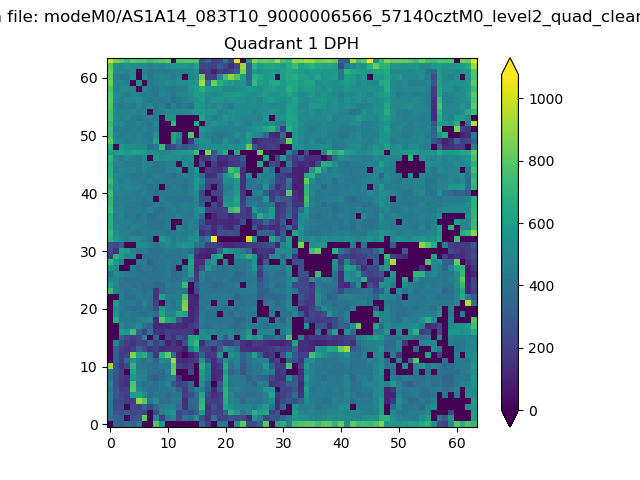 |
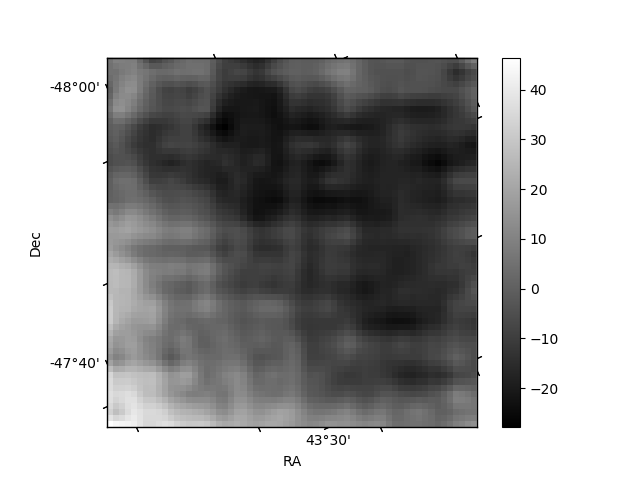
Quadrant B |
|---|---|---|---|
| Quadrant D | 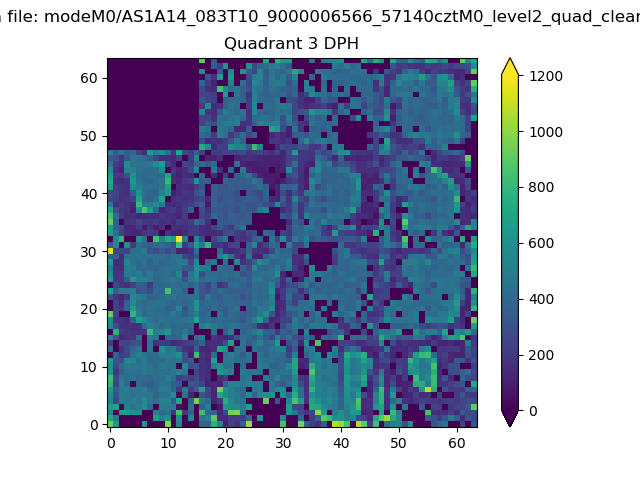 |
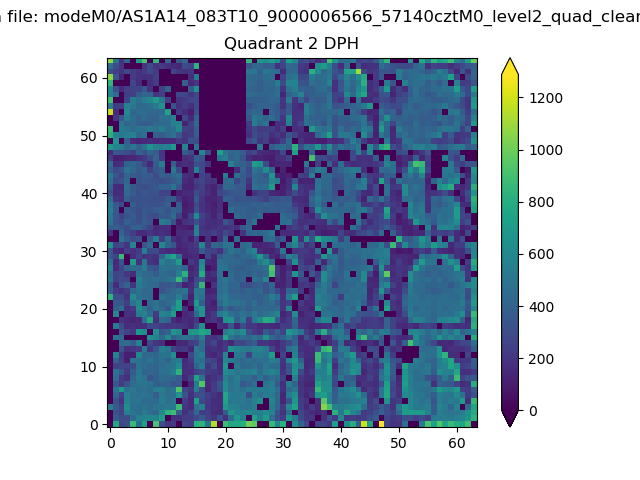 |
Quadrant C |
| Plot type | Count rate plots | Images |
|---|---|---|
| Comparison with Poisson distribution Blue bars denote a histogram of data divided into 1 sec bins. Red curve is a Poisson curve with rate = median count rate of data. |
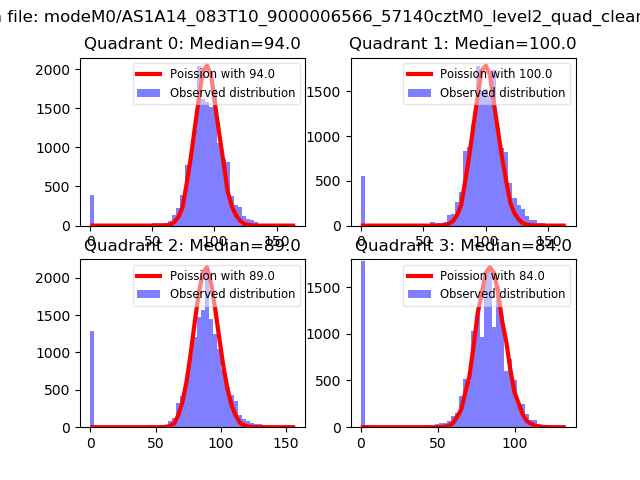 |
 |
| Quadrant-wise count rates Data is divided into 100 sec bins |
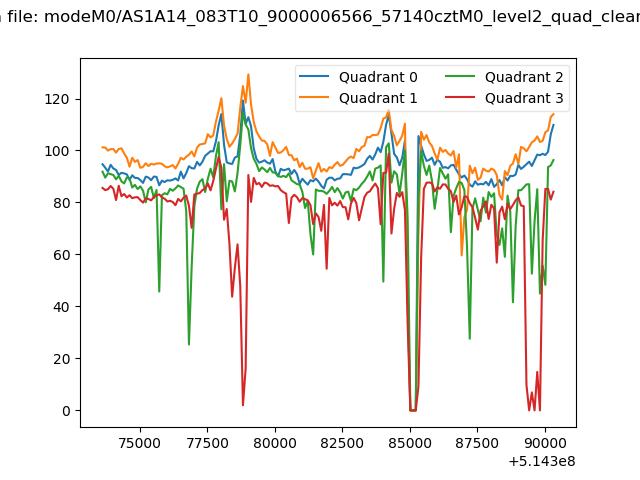 |
|
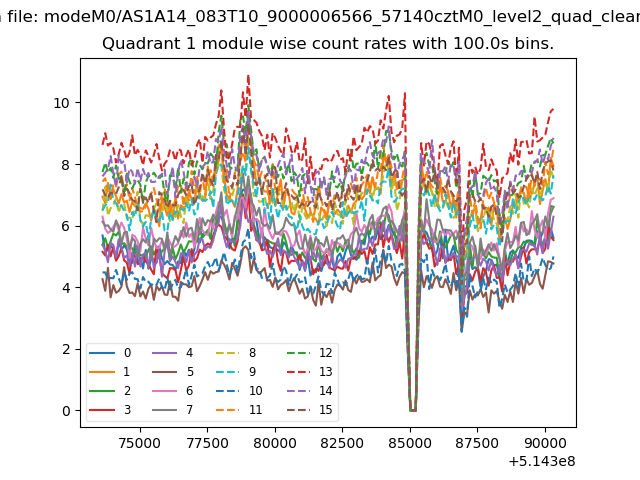
| Module-wise count rates for Quadrant A Data is divided into 100 sec bins |
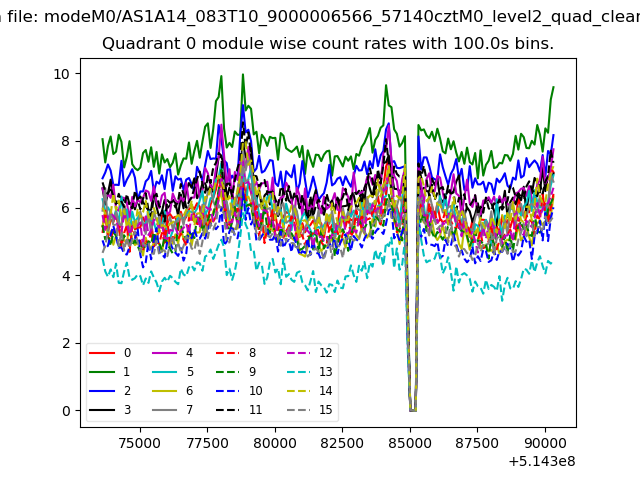 |
 |
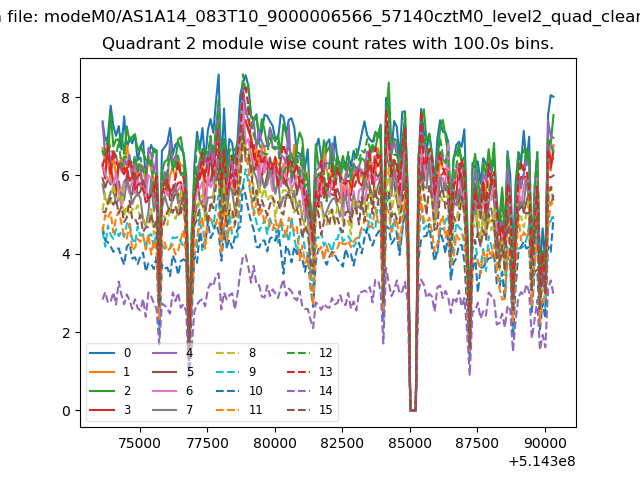
| Module-wise count rates for Quadrant B Data is divided into 100 sec bins |
 |
 |
| Module-wise count rates for Quadrant C Data is divided into 100 sec bins |
 |
 |
| Module-wise count rates for Quadrant D Data is divided into 100 sec bins |
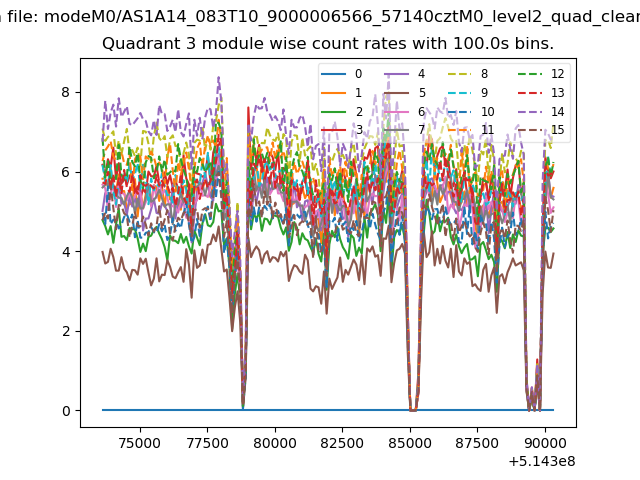 |
 |
| Parameter | Plot |
|---|---|
| CZT HV Monitor | 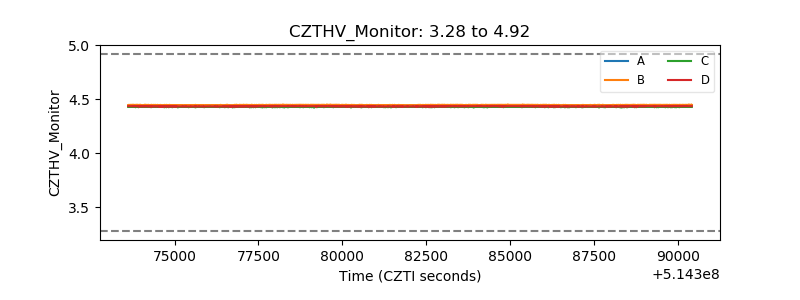 |
| D_VDD | 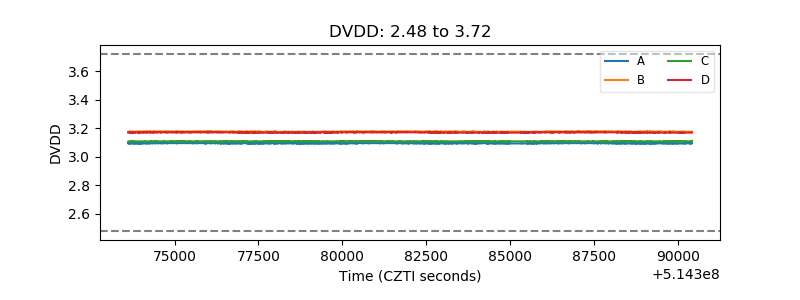 |
| Temperature 1 | 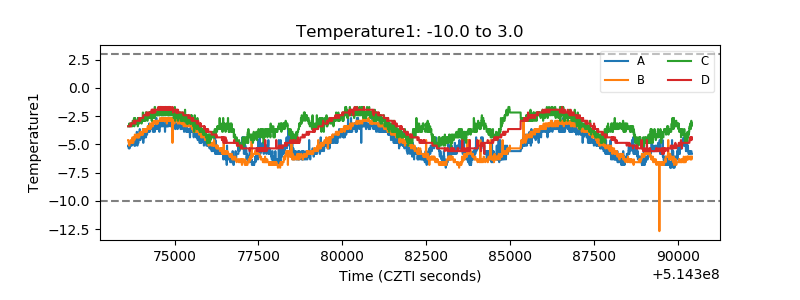 |
| Veto HV Monitor | 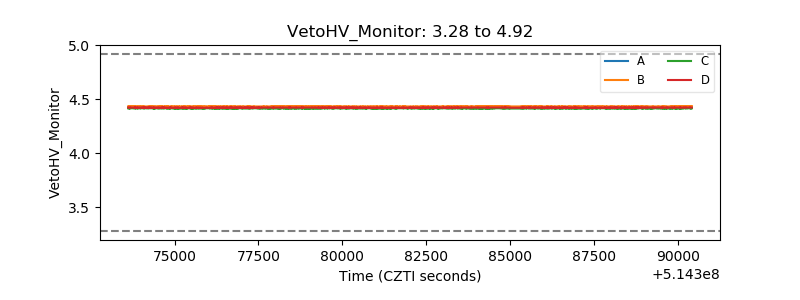 |
| Veto LLD | 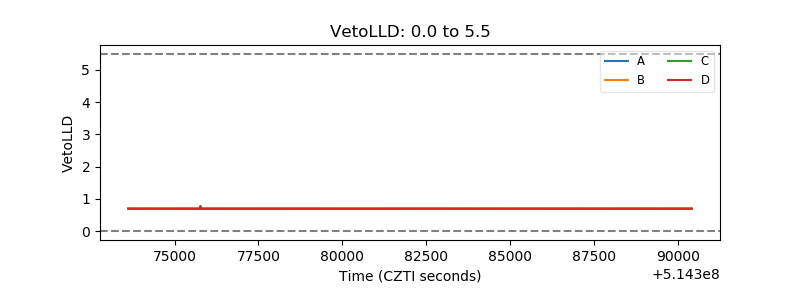 |
| Alpha Counter | 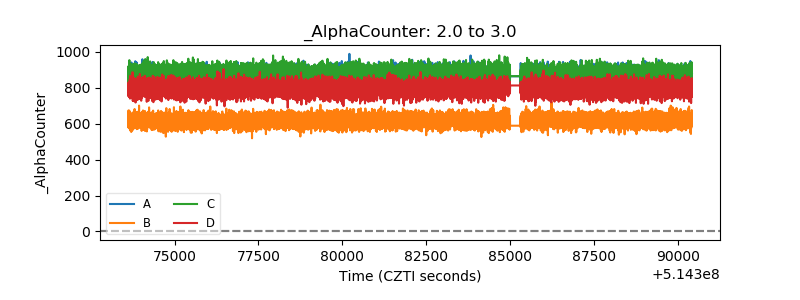 |
| _CPM_Rate | 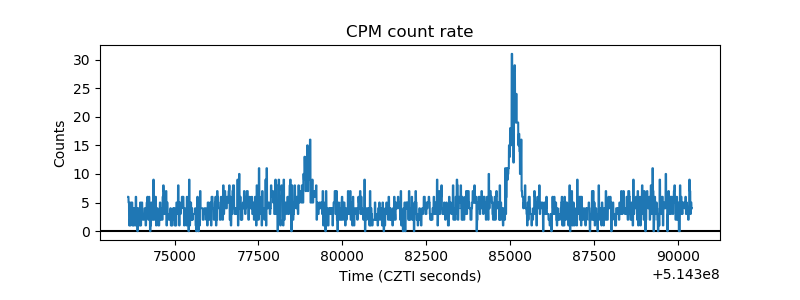 |
| CZT Counter | 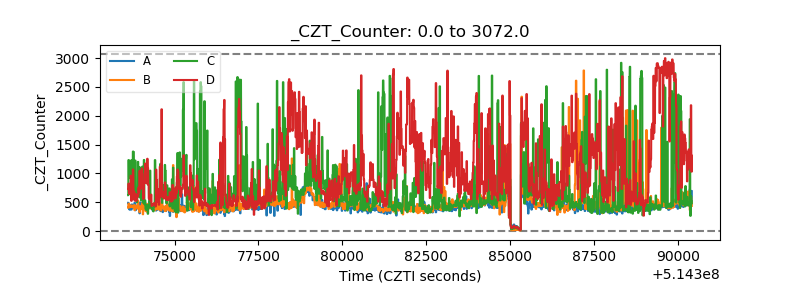 |
| +2.5 Volts monitor | 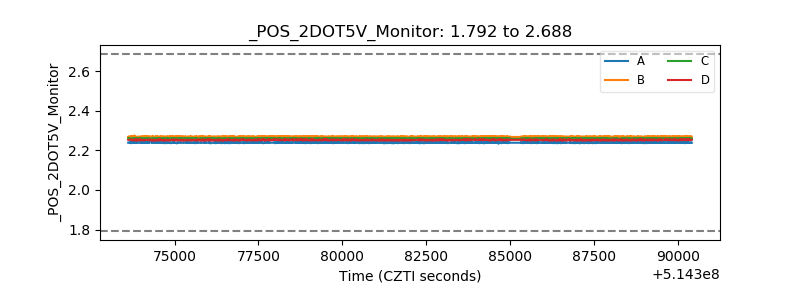 |
| +5 Volts monitor | 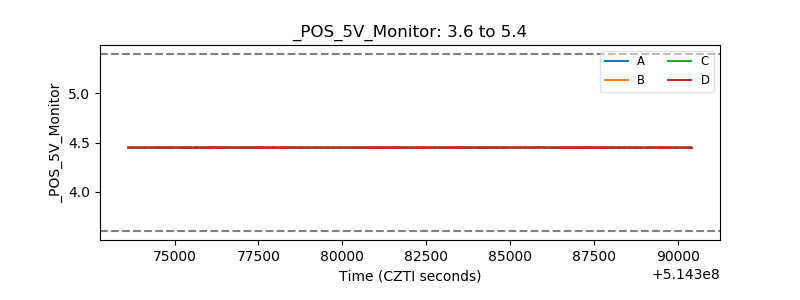 |
| _ROLL_ROT | 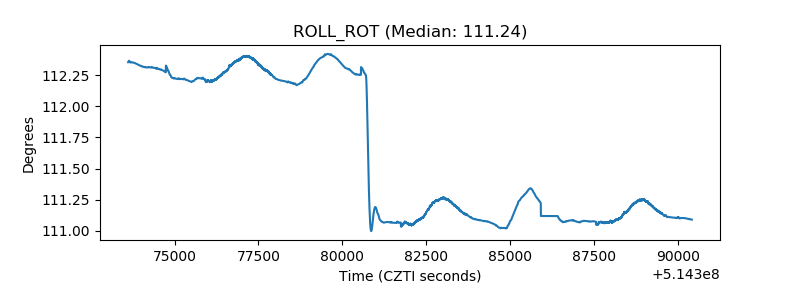 |
| _Roll_DEC | 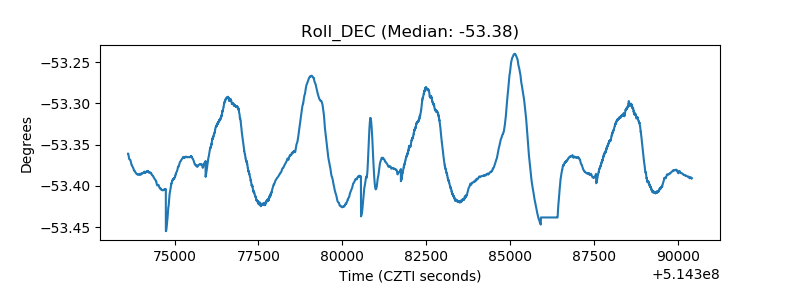 |
| _Roll_RA | 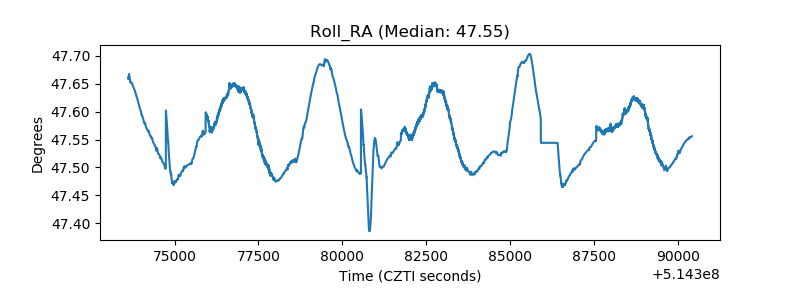 |
| Veto Counter | 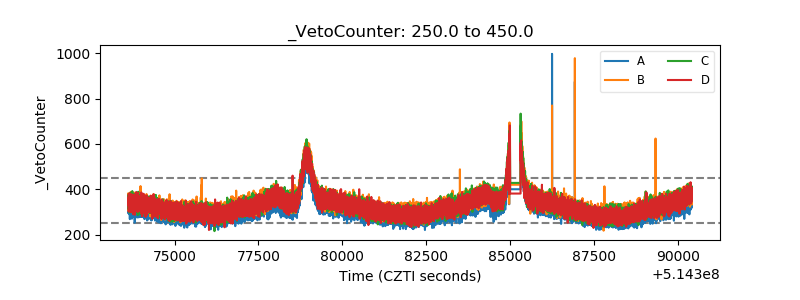 |