| Param | Original file | Final file |
|---|---|---|
| Filename | modeM0/AS1A14_083T10_9000006566_57141cztM0_level2.fits | modeM0/AS1A14_083T10_9000006566_57141cztM0_level2_quad_clean.evt |
| Size (bytes) | 2,303,870,400 | 421,862,400 |
| Size | 2.1 GB | 402.3 MB |
| Events in quadrant A | 13,174,951 | 2,844,960 |
| Events in quadrant B | 16,285,865 | 2,977,082 |
| Events in quadrant C | 22,503,366 | 2,526,950 |
| Events in quadrant D | 31,003,803 | 2,363,510 |
| Mode M9 | |||
|---|---|---|---|
| Quadrant | BADHDUFLAG | Total packets | Discarded packets |
| A | 0 | 16 | 0 |
| B | 0 | 16 | 0 |
| C | 0 | 16 | 0 |
| D | 0 | 16 | 0 |
| Mode M0 | |||
|---|---|---|---|
| Quadrant | BADHDUFLAG | Total packets | Discarded packets |
| A | 0 | 61353 | 3 |
| B | 0 | 69568 | 3 |
| C | 0 | 88276 | 3 |
| D | 0 | 113134 | 5 |
| Mode SS | |||
|---|---|---|---|
| Quadrant | BADHDUFLAG | Total packets | Discarded packets |
| A | 0 | 610 | 0 |
| B | 0 | 610 | 0 |
| C | 0 | 610 | 0 |
| D | 0 | 610 | 0 |
| Quadrant | Total seconds | Saturated seconds | Saturation percentage |
|---|---|---|---|
| A | 29964 | 199 | 0.664130% |
| B | 29965 | 1052 | 3.510763% |
| C | 29965 | 2681 | 8.947105% |
| D | 29964 | 3003 | 10.022026% |
Noise dominated data is calculated using 1-second bins in cleaned event files. If a bin has >2000 counts, and if more than 50% of those come from <1% of pixels, then it is considered to be noise-dominated and hence unusable.
| Quadrant | # 1 sec bins | Bins with >0 counts | Bins with >2000 counts | High rate bins dominated by noise | Noise dominated (total time) | Noise dominated (detector-on time) | Marked lightcurve |
|---|---|---|---|---|---|---|---|
| A | 31658 | 29964 | 19 | 19 | 0.06% | 0.06% | 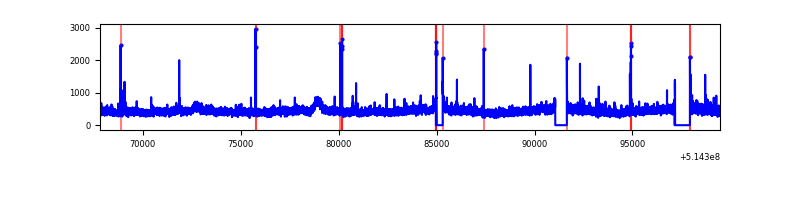 |
| B | 31660 | 29965 | 573 | 573 | 1.81% | 1.91% | 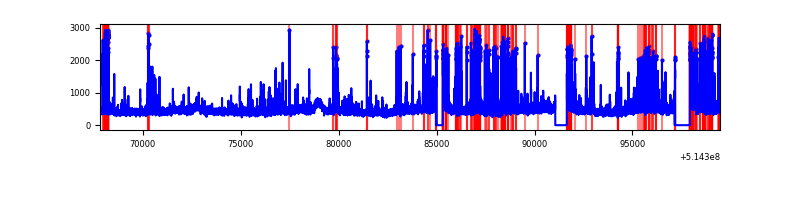 |
| C | 31659 | 29968 | 2085 | 2085 | 6.59% | 6.96% | 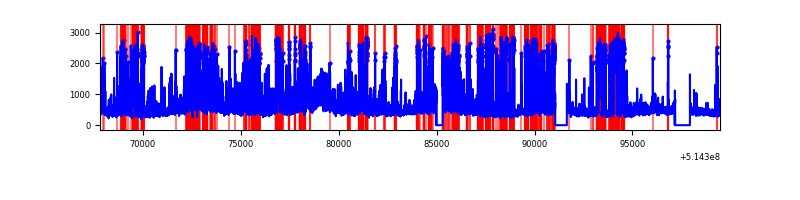 |
| D | 31659 | 29965 | 2902 | 2902 | 9.17% | 9.68% | 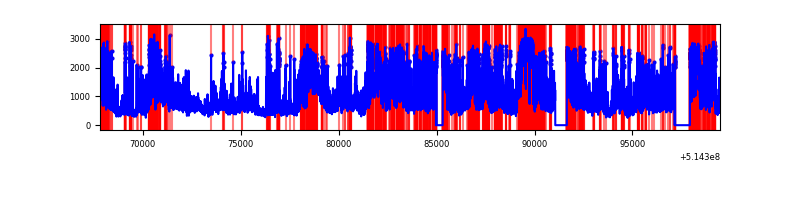 |
Top three noisy pixels from each quadrant. If the there are fewer than three noisy pixels in the level2.evt file, extra rows are filled as -1
| Pixel properties | Quadrant properties | ||||||
|---|---|---|---|---|---|---|---|
| Quadrant | DetID | PixID | Counts | Sigma | Mean | Median | Sigma |
| A | 3 | 14 | 301028 | 371.89 | 3259 | 3172 | 800.9 |
| A | 5 | 113 | 103903 | 125.77 | 3259 | 3172 | 800.9 |
| A | 10 | 251 | 43562 | 50.43 | 3259 | 3172 | 800.9 |
| B | 10 | 16 | 1940102 | 2895.75 | 3148 | 3025 | 668.9 |
| B | 5 | 172 | 412407 | 611.99 | 3148 | 3025 | 668.9 |
| B | 5 | 185 | 313785 | 464.56 | 3148 | 3025 | 668.9 |
| C | 12 | 252 | 5904997 | 7320.73 | 2976 | 2953 | 806.2 |
| C | 15 | 198 | 4279603 | 5304.64 | 2976 | 2953 | 806.2 |
| C | 14 | 254 | 225336 | 275.84 | 2976 | 2953 | 806.2 |
| D | 15 | 142 | 10792971 | 12718.96 | 3010 | 2872 | 848.3 |
| D | 12 | 33 | 3972936 | 4679.76 | 3010 | 2872 | 848.3 |
| D | 6 | 159 | 1478672 | 1739.62 | 3010 | 2872 | 848.3 |
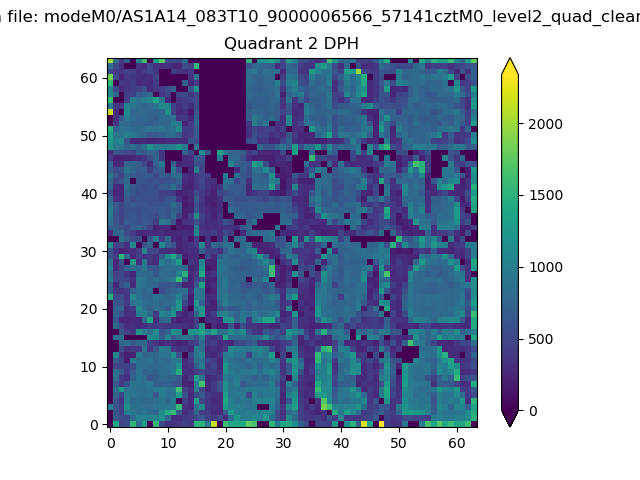
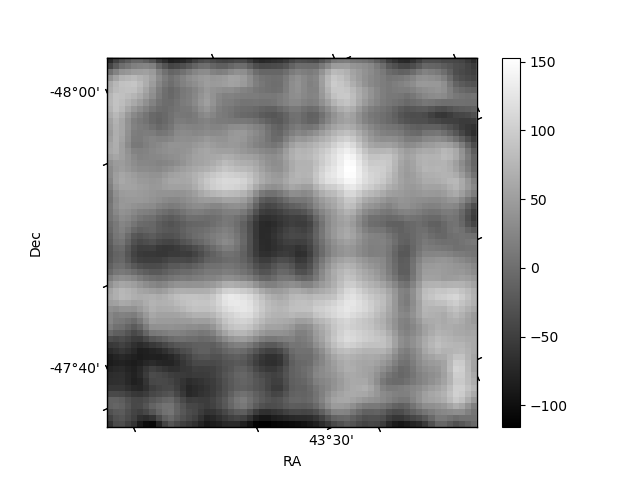
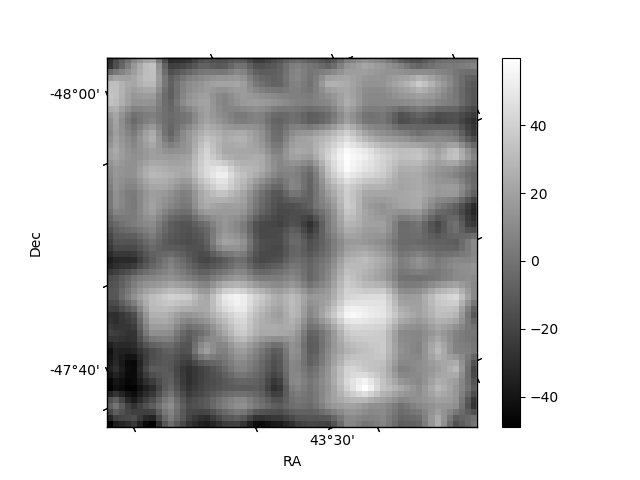
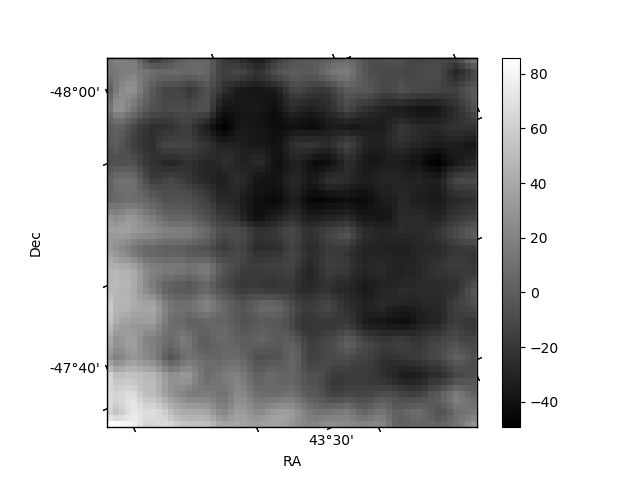
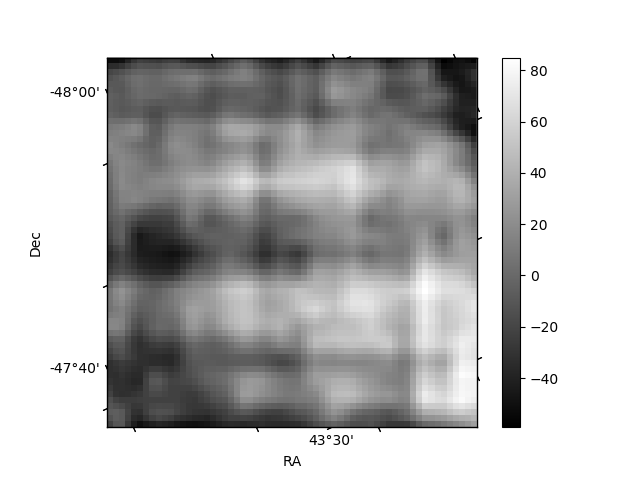
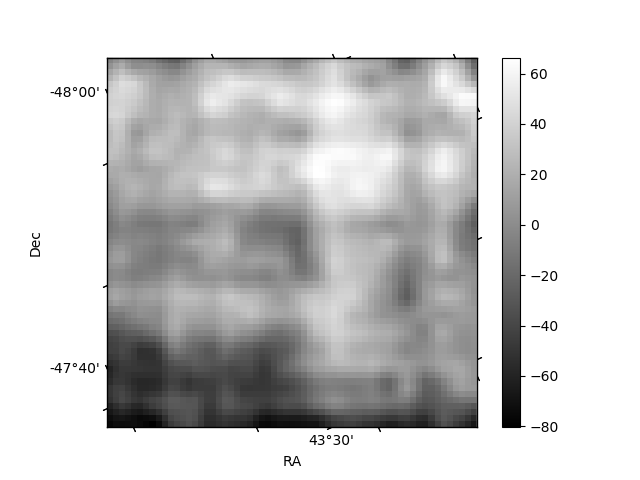
Histogram calculated using DETX and DETY for each event in the final _common_clean file
| Quadrant A | 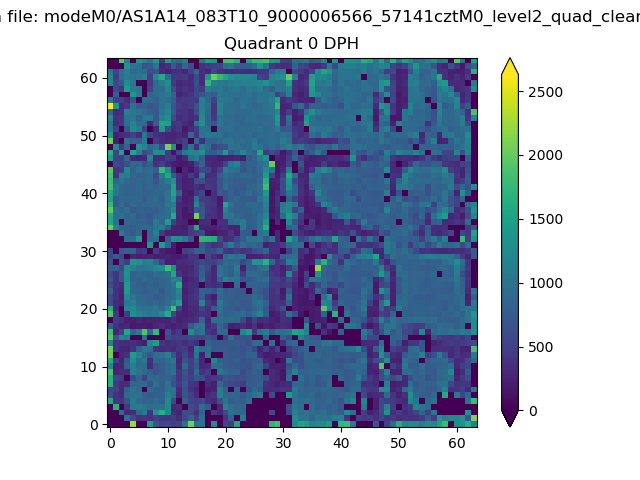 |
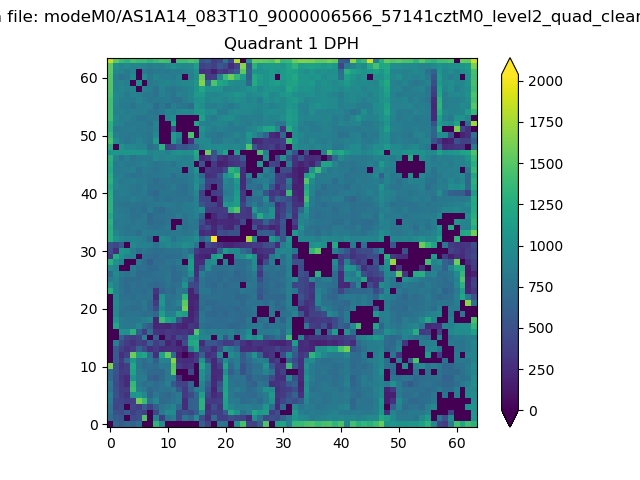 |
Quadrant B |
|---|---|---|---|
| Quadrant D | 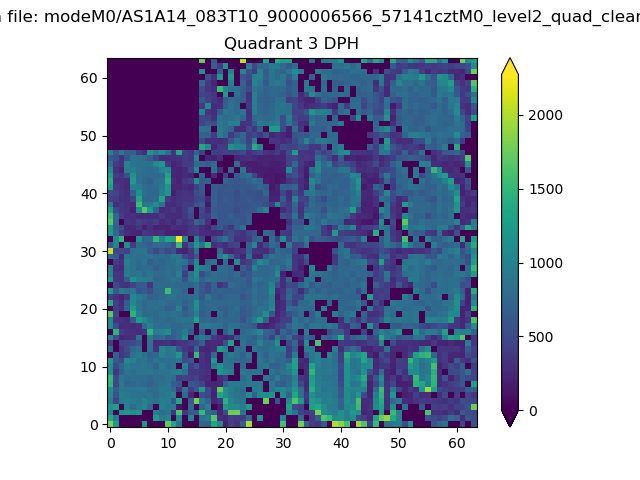 |
 |
Quadrant C |
| Plot type | Count rate plots | Images |
|---|---|---|
| Comparison with Poisson distribution Blue bars denote a histogram of data divided into 1 sec bins. Red curve is a Poisson curve with rate = median count rate of data. |
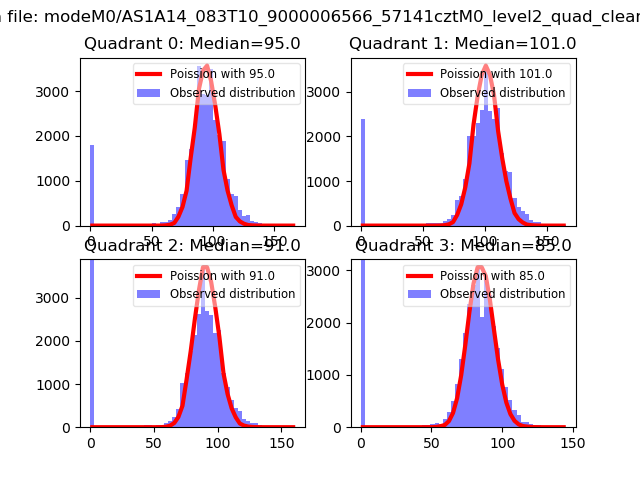 |
 |
| Quadrant-wise count rates Data is divided into 100 sec bins |
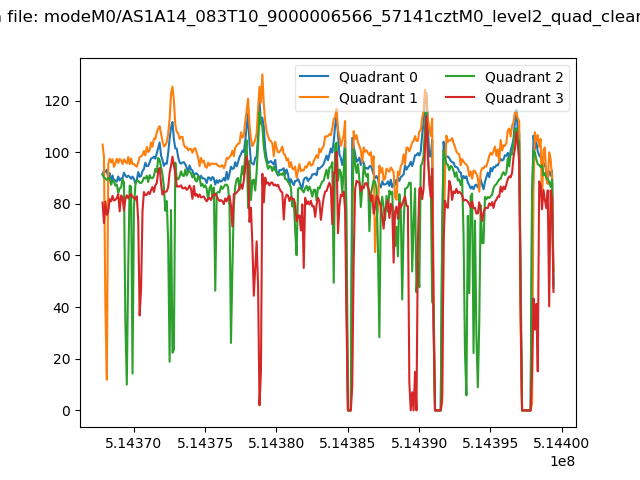 |
|
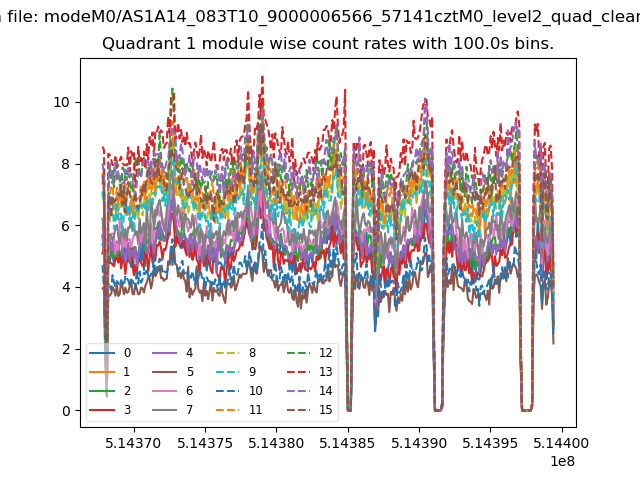
| Module-wise count rates for Quadrant A Data is divided into 100 sec bins |
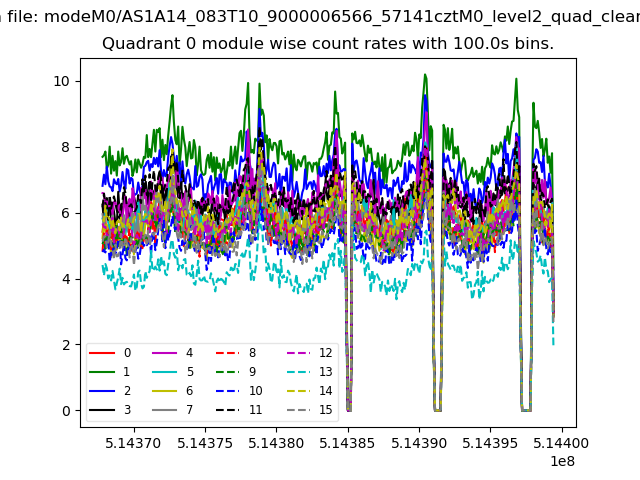 |
 |
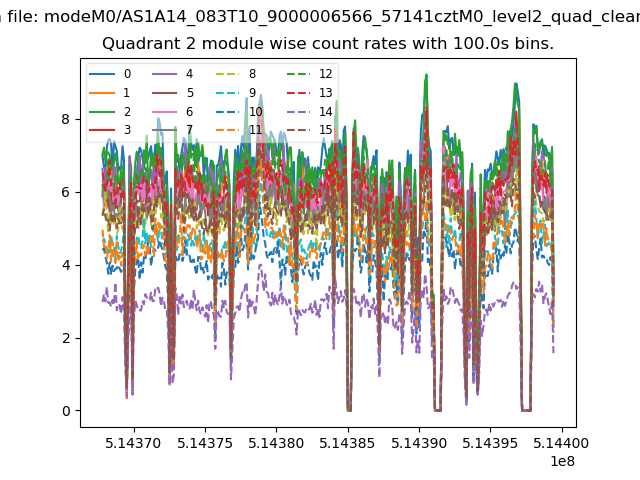
| Module-wise count rates for Quadrant B Data is divided into 100 sec bins |
 |
 |
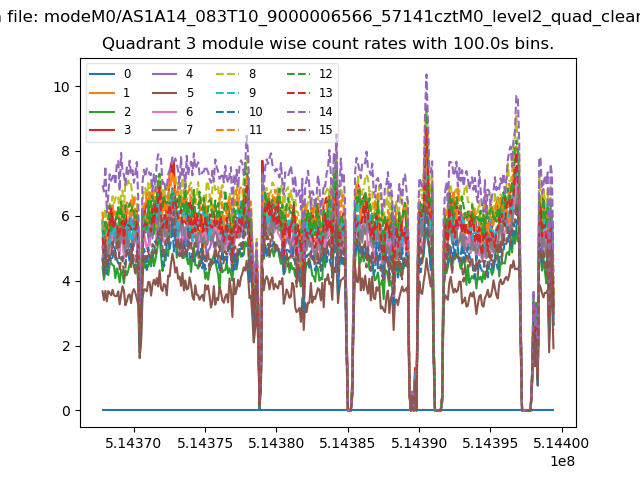
| Module-wise count rates for Quadrant C Data is divided into 100 sec bins |
 |
 |
| Module-wise count rates for Quadrant D Data is divided into 100 sec bins |
 |
 |
| Parameter | Plot |
|---|---|
| CZT HV Monitor | 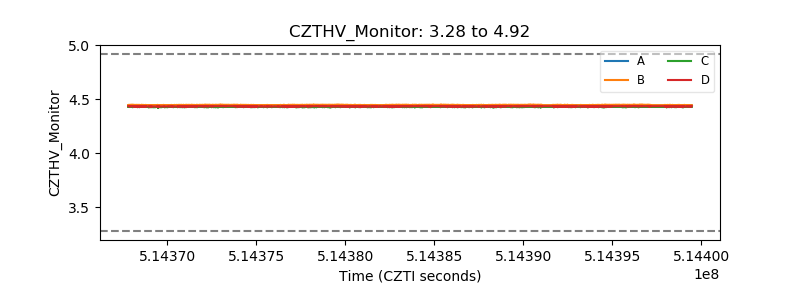 |
| D_VDD | 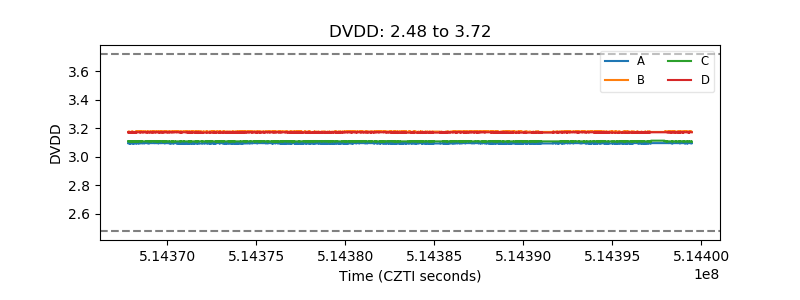 |
| Temperature 1 | 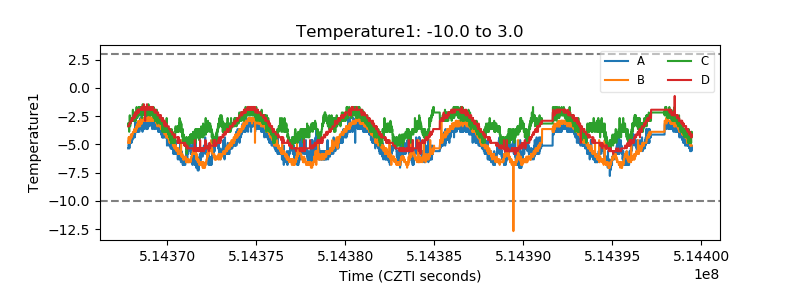 |
| Veto HV Monitor | 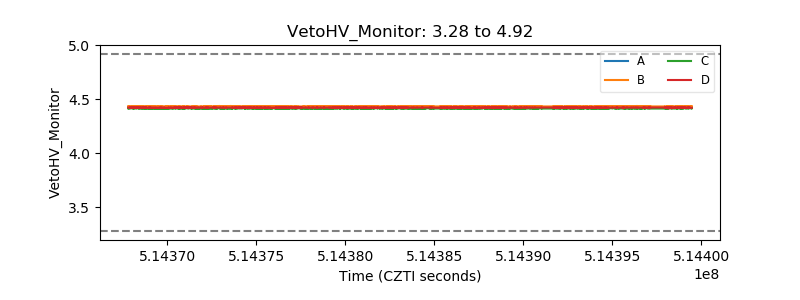 |
| Veto LLD | 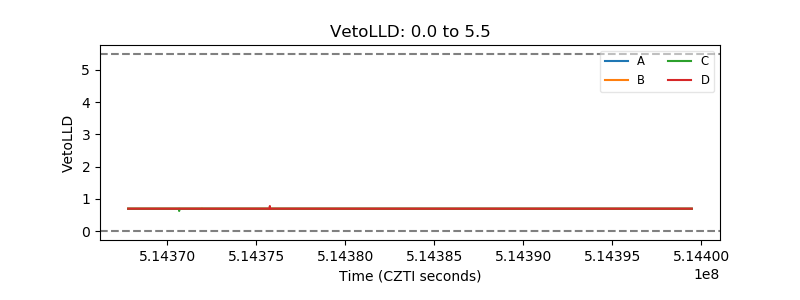 |
| Alpha Counter | 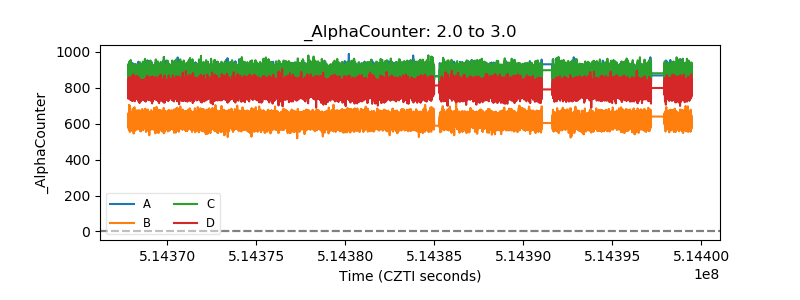 |
| _CPM_Rate | 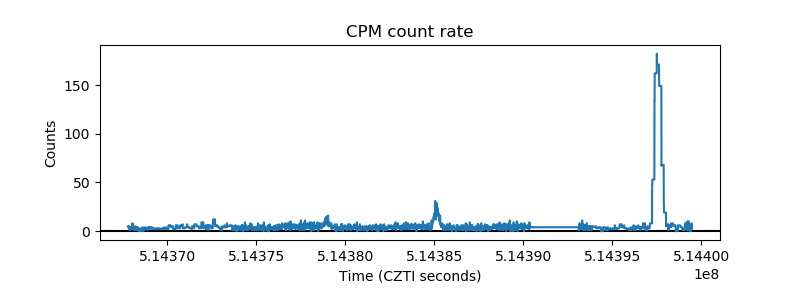 |
| CZT Counter | 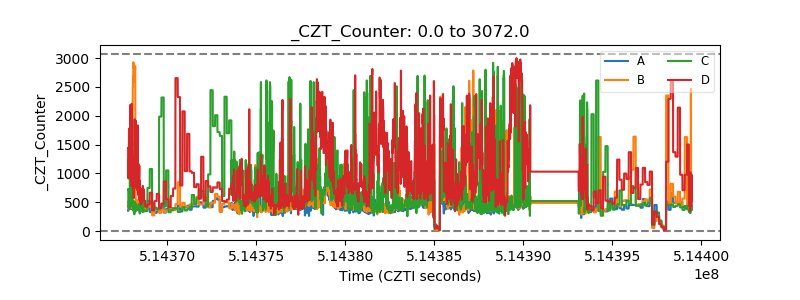 |
| +2.5 Volts monitor | 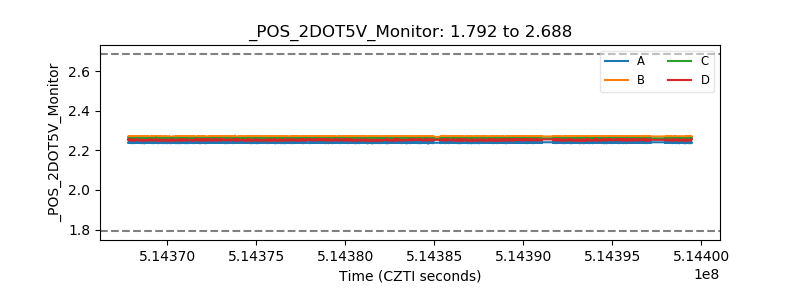 |
| +5 Volts monitor | 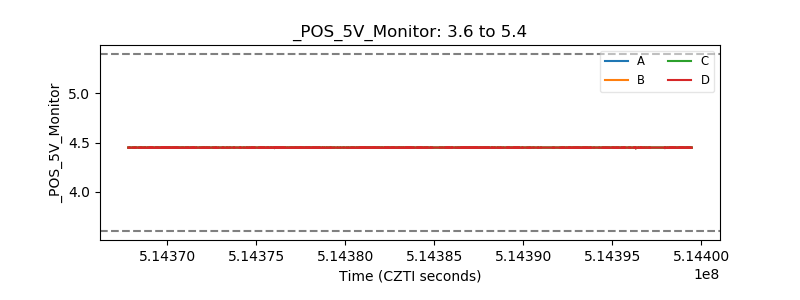 |
| _ROLL_ROT | 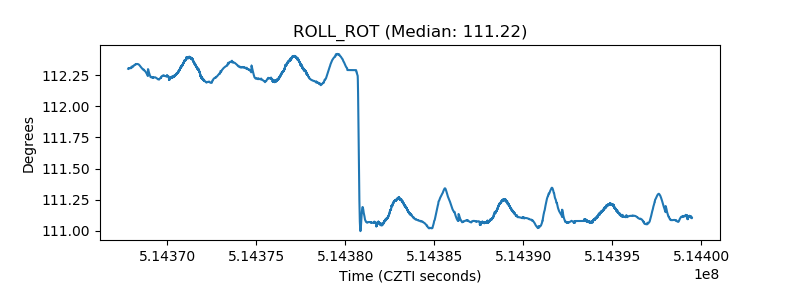 |
| _Roll_DEC | 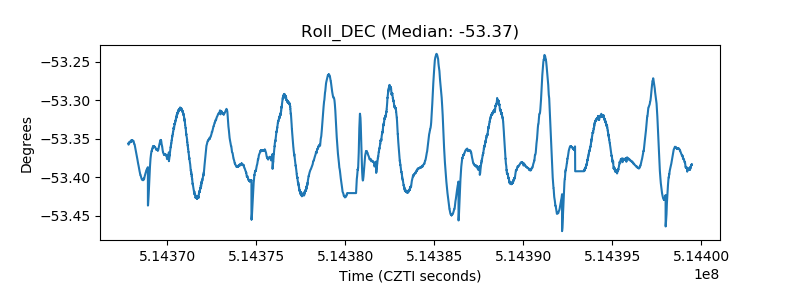 |
| _Roll_RA | 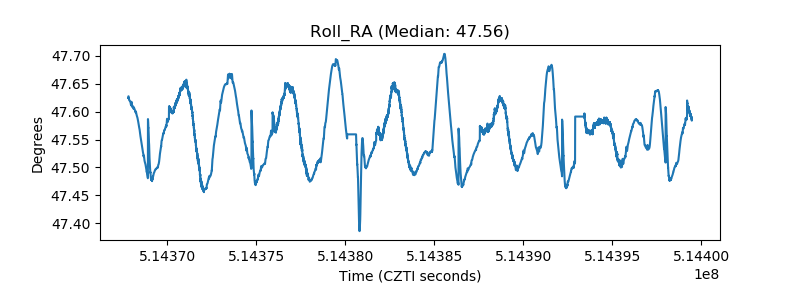 |
| Veto Counter | 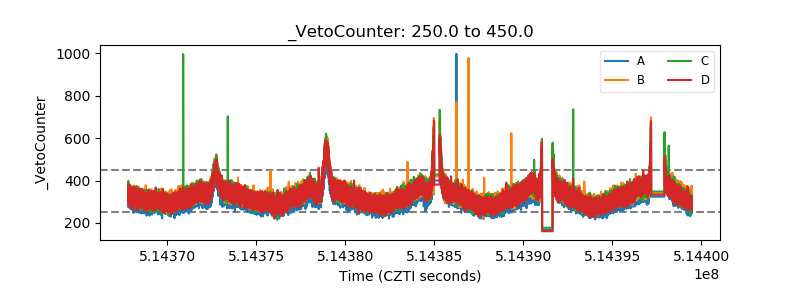 |