| Param | Original file | Final file |
|---|---|---|
| Filename | modeM0/AS1A14_083T10_9000006566_57142cztM0_level2.fits | modeM0/AS1A14_083T10_9000006566_57142cztM0_level2_quad_clean.evt |
| Size (bytes) | 491,290,560 | 84,539,520 |
| Size | 468.5 MB | 80.6 MB |
| Events in quadrant A | 2,725,567 | 579,566 |
| Events in quadrant B | 5,216,282 | 535,979 |
| Events in quadrant C | 3,315,217 | 544,204 |
| Events in quadrant D | 6,457,040 | 475,689 |
| Mode M9 | |||
|---|---|---|---|
| Quadrant | BADHDUFLAG | Total packets | Discarded packets |
| A | 0 | 9 | 0 |
| B | 0 | 9 | 0 |
| C | 0 | 9 | 0 |
| D | 0 | 9 | 0 |
| Mode M0 | |||
|---|---|---|---|
| Quadrant | BADHDUFLAG | Total packets | Discarded packets |
| A | 0 | 12639 | 1 |
| B | 0 | 19545 | 1 |
| C | 0 | 14531 | 1 |
| D | 0 | 23431 | 1 |
| Mode SS | |||
|---|---|---|---|
| Quadrant | BADHDUFLAG | Total packets | Discarded packets |
| A | 0 | 124 | 0 |
| B | 0 | 124 | 0 |
| C | 0 | 124 | 0 |
| D | 0 | 124 | 0 |
| Quadrant | Total seconds | Saturated seconds | Saturation percentage |
|---|---|---|---|
| A | 6074 | 33 | 0.543299% |
| B | 6075 | 875 | 14.403292% |
| C | 6075 | 169 | 2.781893% |
| D | 6075 | 596 | 9.810700% |
Noise dominated data is calculated using 1-second bins in cleaned event files. If a bin has >2000 counts, and if more than 50% of those come from <1% of pixels, then it is considered to be noise-dominated and hence unusable.
| Quadrant | # 1 sec bins | Bins with >0 counts | Bins with >2000 counts | High rate bins dominated by noise | Noise dominated (total time) | Noise dominated (detector-on time) | Marked lightcurve |
|---|---|---|---|---|---|---|---|
| A | 7033 | 6073 | 6 | 6 | 0.09% | 0.10% | 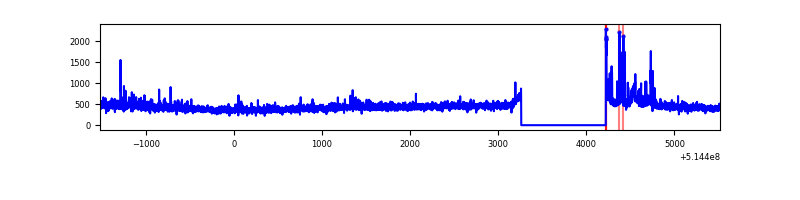 |
| B | 7034 | 6075 | 752 | 752 | 10.69% | 12.38% | 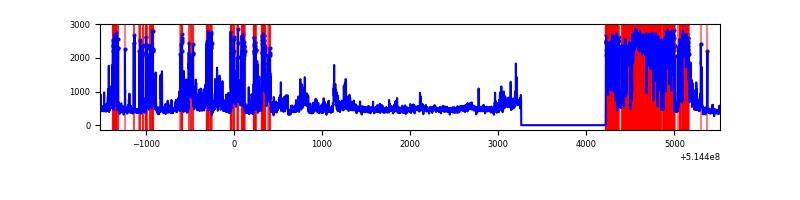 |
| C | 7034 | 6075 | 132 | 132 | 1.88% | 2.17% | 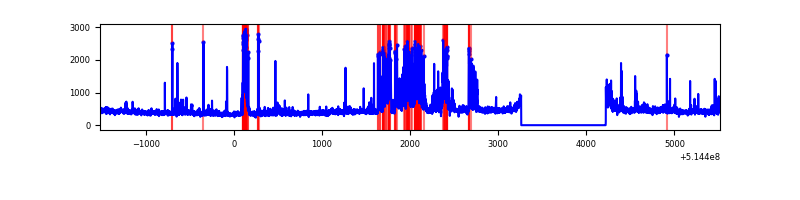 |
| D | 7034 | 6075 | 642 | 642 | 9.13% | 10.57% | 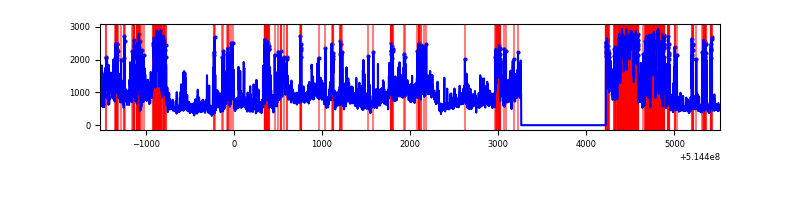 |
Top three noisy pixels from each quadrant. If the there are fewer than three noisy pixels in the level2.evt file, extra rows are filled as -1
| Pixel properties | Quadrant properties | ||||||
|---|---|---|---|---|---|---|---|
| Quadrant | DetID | PixID | Counts | Sigma | Mean | Median | Sigma |
| A | 3 | 14 | 150080 | 930.22 | 649 | 631 | 160.7 |
| A | 5 | 113 | 40668 | 249.2 | 649 | 631 | 160.7 |
| A | 13 | 254 | 11255 | 66.13 | 649 | 631 | 160.7 |
| B | 10 | 16 | 2632930 | 20573.39 | 587 | 566 | 127.9 |
| B | 0 | 199 | 138400 | 1077.25 | 587 | 566 | 127.9 |
| B | 4 | 171 | 45517 | 351.32 | 587 | 566 | 127.9 |
| C | 15 | 198 | 568298 | 3356.37 | 620 | 614 | 169.1 |
| C | 9 | 237 | 132121 | 777.52 | 620 | 614 | 169.1 |
| C | 14 | 254 | 57996 | 339.27 | 620 | 614 | 169.1 |
| D | 12 | 33 | 1747264 | 10250.43 | 597 | 568 | 170.4 |
| D | 15 | 142 | 1722283 | 10103.83 | 597 | 568 | 170.4 |
| D | 2 | 249 | 186172 | 1089.21 | 597 | 568 | 170.4 |
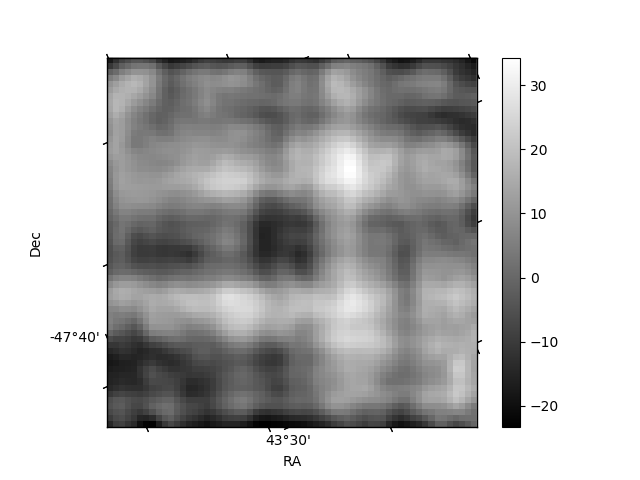
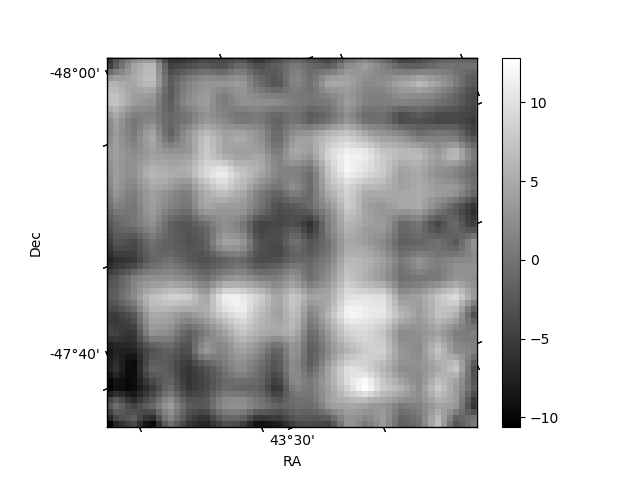
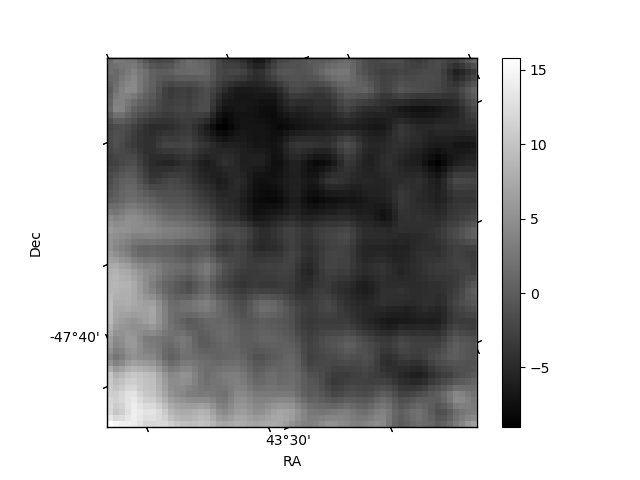
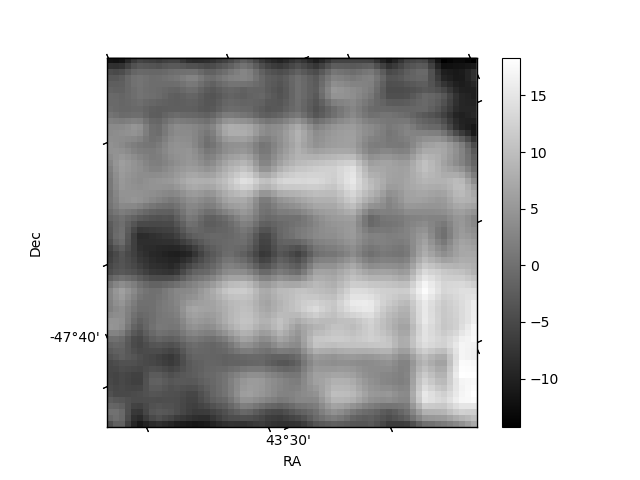
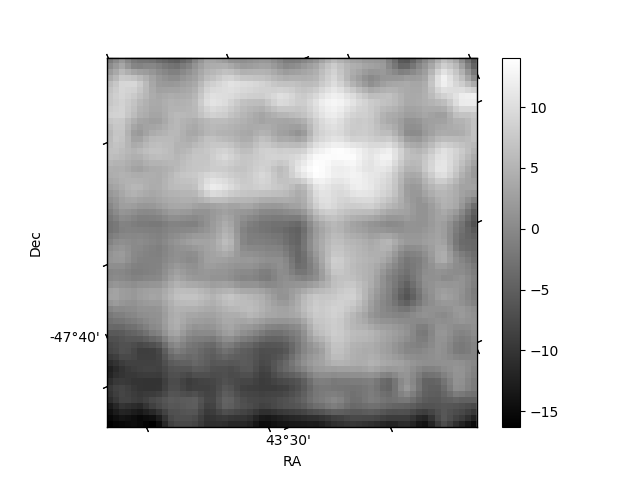
Histogram calculated using DETX and DETY for each event in the final _common_clean file
| Quadrant A | 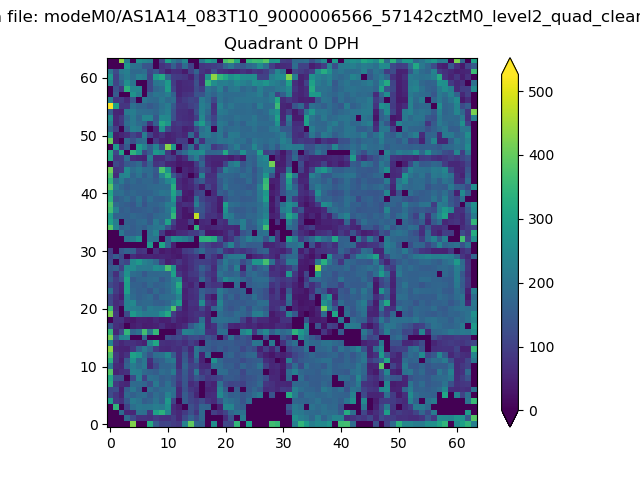 |
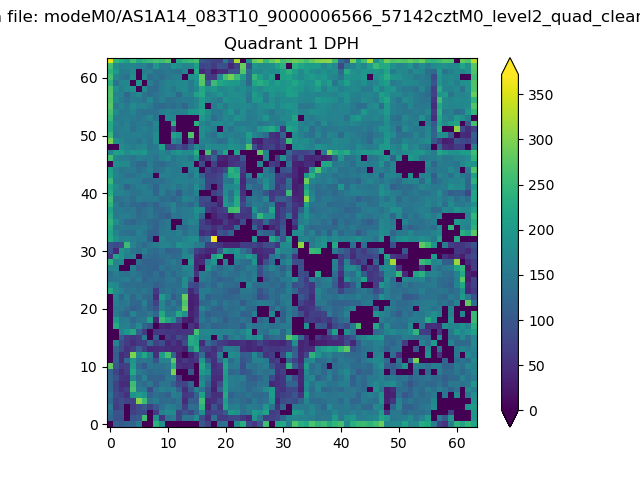 |
Quadrant B |
|---|---|---|---|
| Quadrant D | 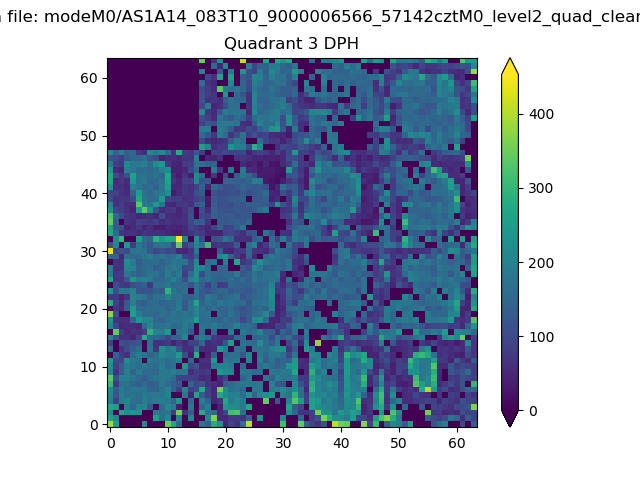 |
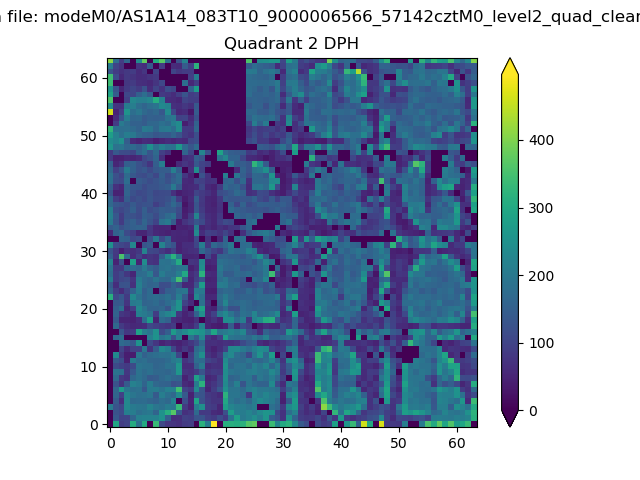 |
Quadrant C |
| Plot type | Count rate plots | Images |
|---|---|---|
| Comparison with Poisson distribution Blue bars denote a histogram of data divided into 1 sec bins. Red curve is a Poisson curve with rate = median count rate of data. |
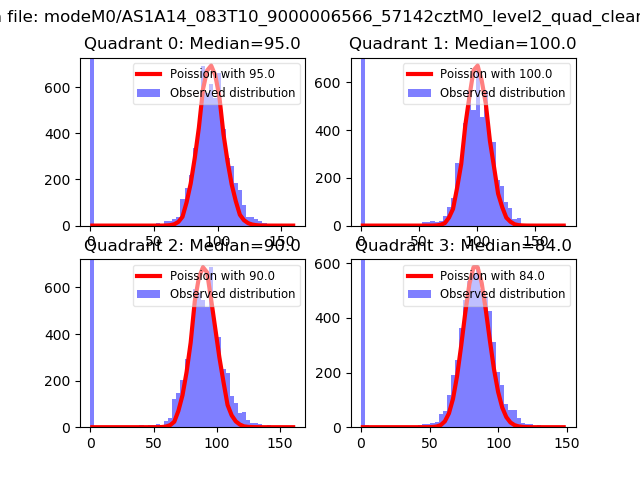 |
 |
| Quadrant-wise count rates Data is divided into 100 sec bins |
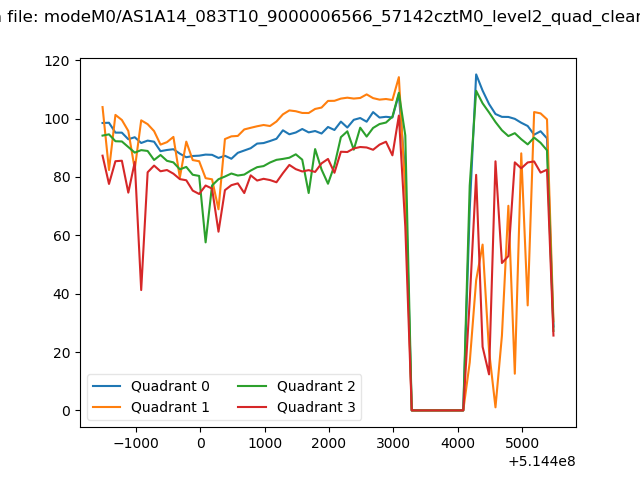 |
|
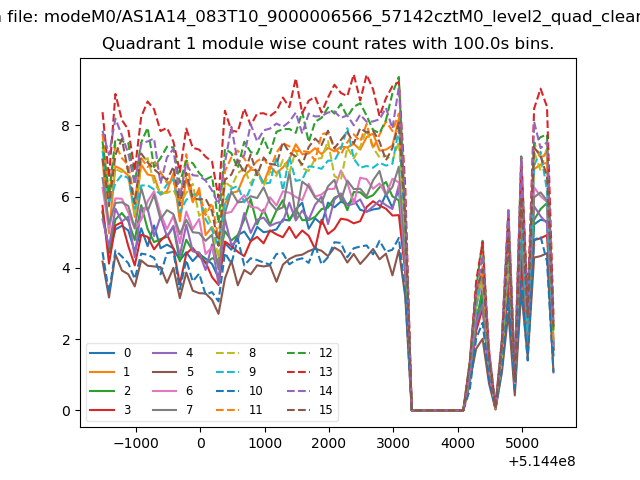
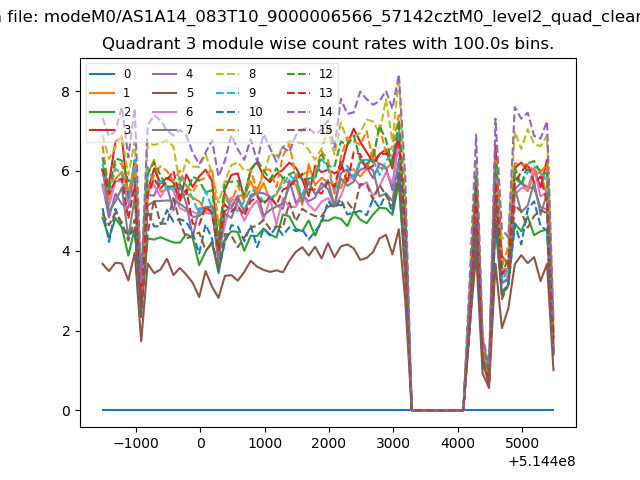
| Module-wise count rates for Quadrant A Data is divided into 100 sec bins |
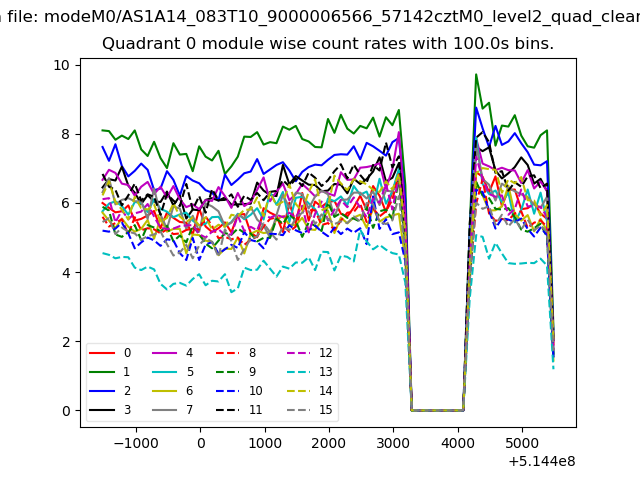 |
 |
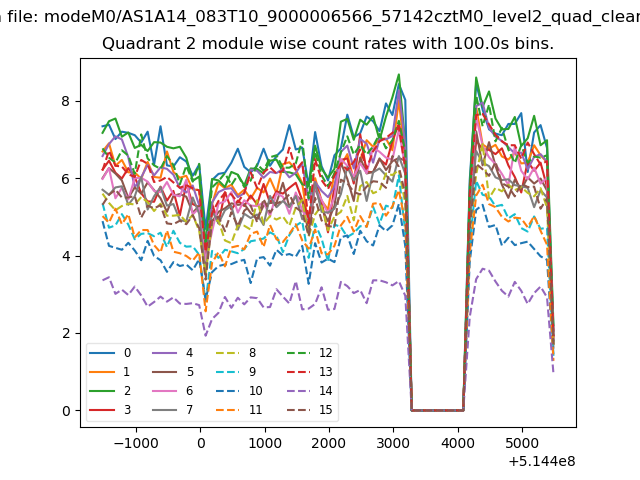
| Module-wise count rates for Quadrant B Data is divided into 100 sec bins |
 |
 |
| Module-wise count rates for Quadrant C Data is divided into 100 sec bins |
 |
 |
| Module-wise count rates for Quadrant D Data is divided into 100 sec bins |
 |
 |
| Parameter | Plot |
|---|---|
| CZT HV Monitor | 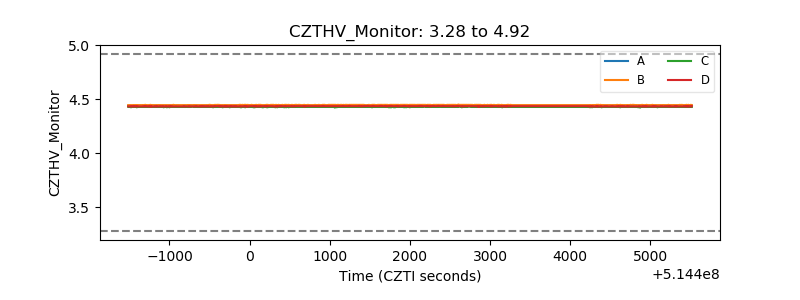 |
| D_VDD | 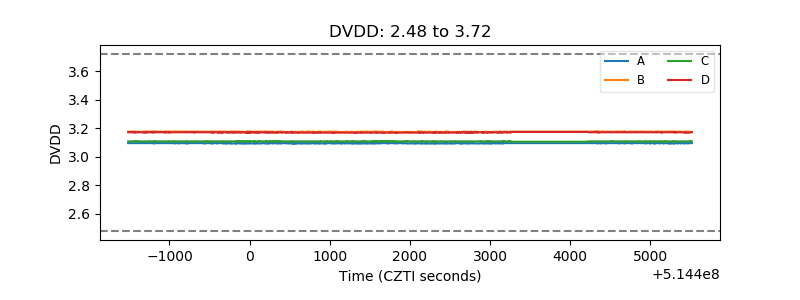 |
| Temperature 1 | 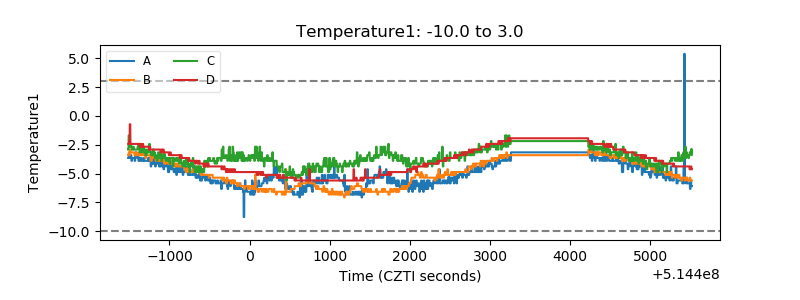 |
| Veto HV Monitor | 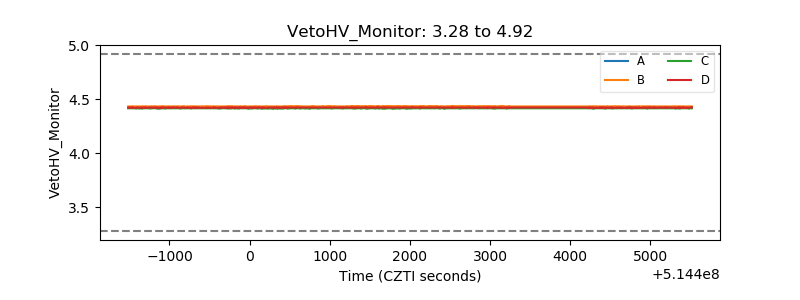 |
| Veto LLD | 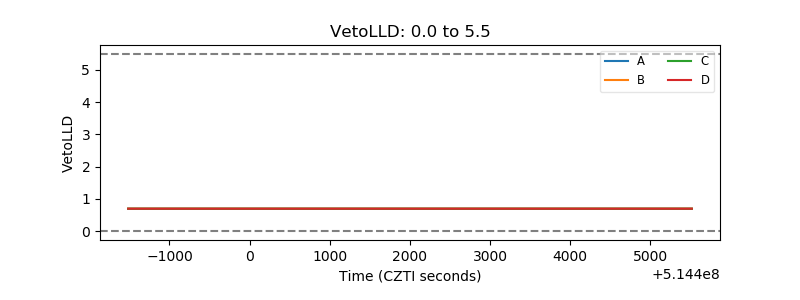 |
| Alpha Counter | 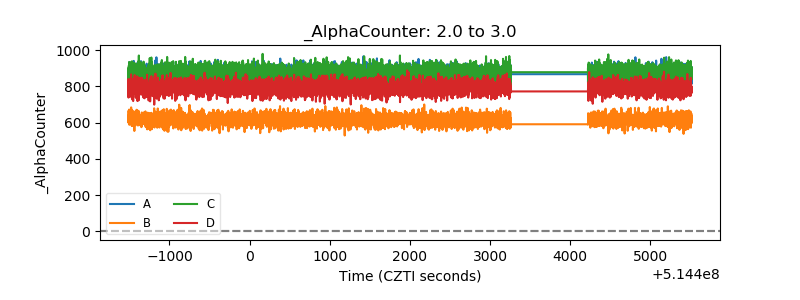 |
| _CPM_Rate | 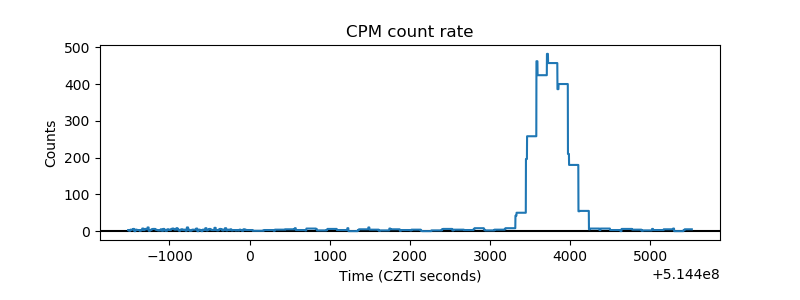 |
| CZT Counter | 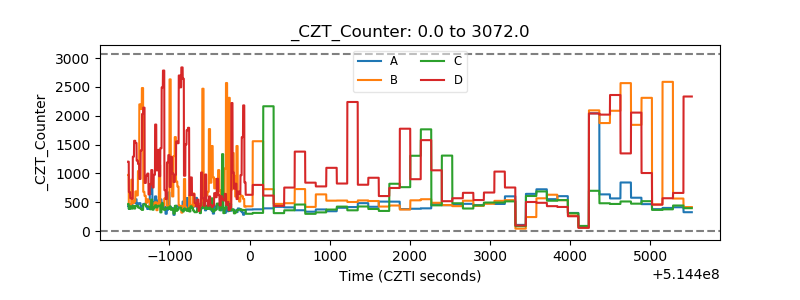 |
| +2.5 Volts monitor |  |
| +5 Volts monitor | 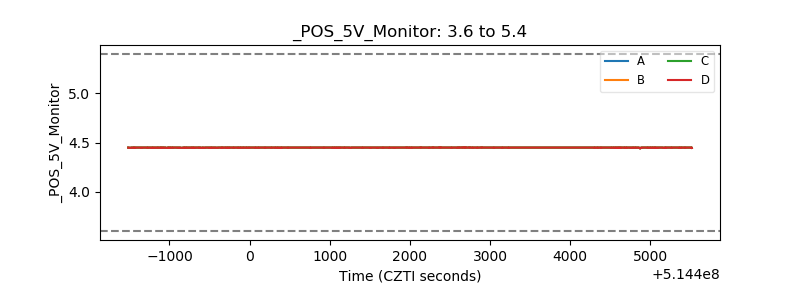 |
| _ROLL_ROT | 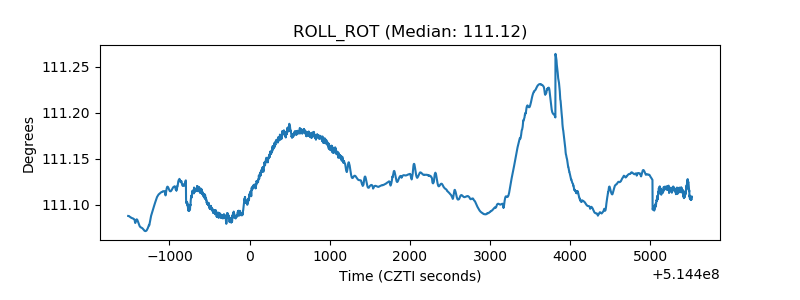 |
| _Roll_DEC | 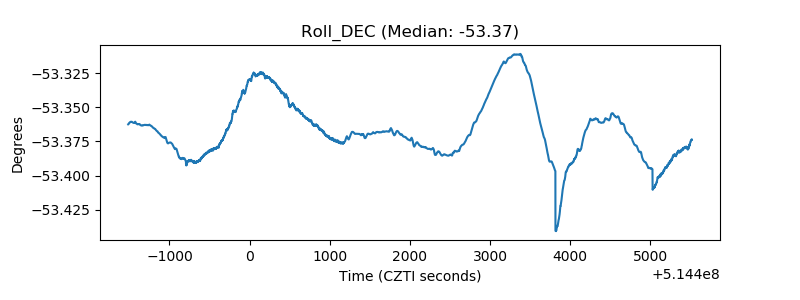 |
| _Roll_RA | 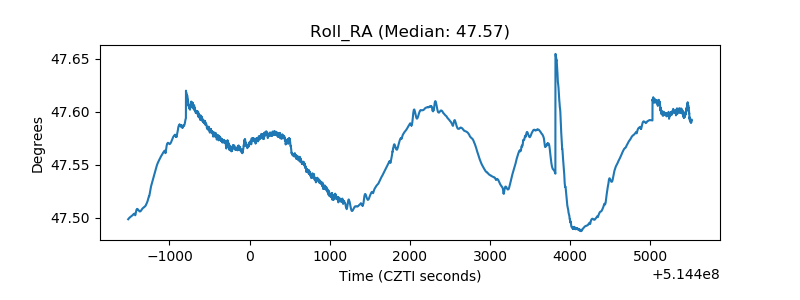 |
| Veto Counter | 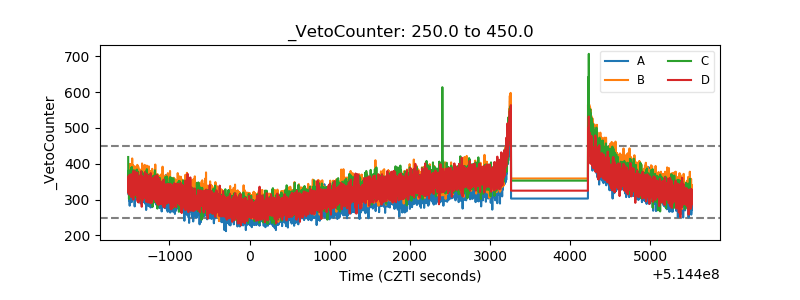 |