| Param | Original file | Final file |
|---|---|---|
| Filename | modeM0/AS1A14_083T10_9000006566_57144cztM0_level2.fits | modeM0/AS1A14_083T10_9000006566_57144cztM0_level2_quad_clean.evt |
| Size (bytes) | 500,088,960 | 89,386,560 |
| Size | 476.9 MB | 85.2 MB |
| Events in quadrant A | 2,739,756 | 620,422 |
| Events in quadrant B | 5,138,609 | 562,291 |
| Events in quadrant C | 4,315,169 | 562,014 |
| Events in quadrant D | 5,832,720 | 526,055 |
| Mode M9 | |||
|---|---|---|---|
| Quadrant | BADHDUFLAG | Total packets | Discarded packets |
| A | 0 | 11 | 0 |
| B | 0 | 11 | 0 |
| C | 0 | 11 | 0 |
| D | 0 | 11 | 0 |
| Mode M0 | |||
|---|---|---|---|
| Quadrant | BADHDUFLAG | Total packets | Discarded packets |
| A | 0 | 12855 | 1 |
| B | 0 | 19705 | 1 |
| C | 0 | 17215 | 1 |
| D | 0 | 21726 | 1 |
| Mode SS | |||
|---|---|---|---|
| Quadrant | BADHDUFLAG | Total packets | Discarded packets |
| A | 0 | 126 | 0 |
| B | 0 | 126 | 0 |
| C | 0 | 126 | 0 |
| D | 0 | 126 | 0 |
| Quadrant | Total seconds | Saturated seconds | Saturation percentage |
|---|---|---|---|
| A | 6247 | 23 | 0.368177% |
| B | 6248 | 984 | 15.749040% |
| C | 6248 | 428 | 6.850192% |
| D | 6248 | 440 | 7.042254% |
Noise dominated data is calculated using 1-second bins in cleaned event files. If a bin has >2000 counts, and if more than 50% of those come from <1% of pixels, then it is considered to be noise-dominated and hence unusable.
| Quadrant | # 1 sec bins | Bins with >0 counts | Bins with >2000 counts | High rate bins dominated by noise | Noise dominated (total time) | Noise dominated (detector-on time) | Marked lightcurve |
|---|---|---|---|---|---|---|---|
| A | 7327 | 6248 | 4 | 4 | 0.05% | 0.06% | 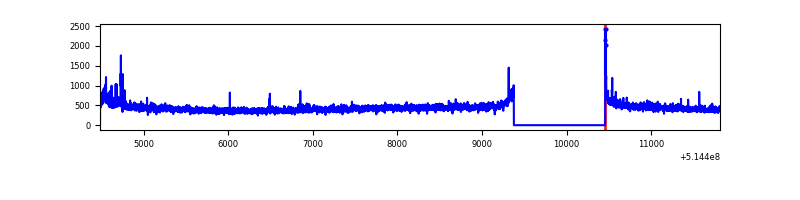 |
| B | 7328 | 6249 | 801 | 801 | 10.93% | 12.82% | 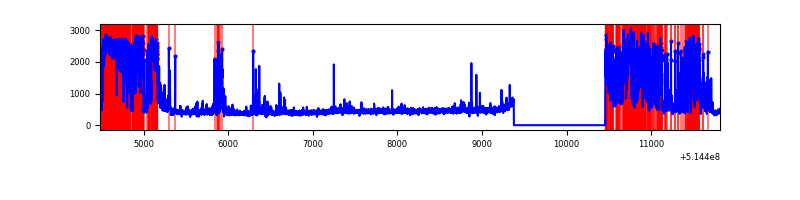 |
| C | 7328 | 6249 | 398 | 398 | 5.43% | 6.37% | 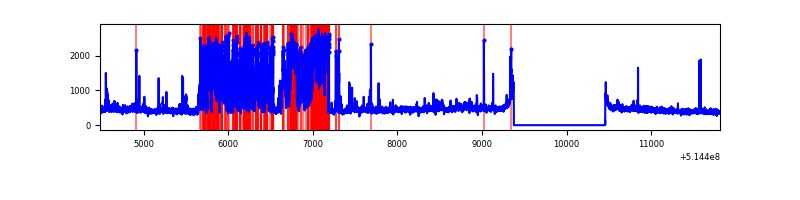 |
| D | 7328 | 6249 | 432 | 432 | 5.90% | 6.91% | 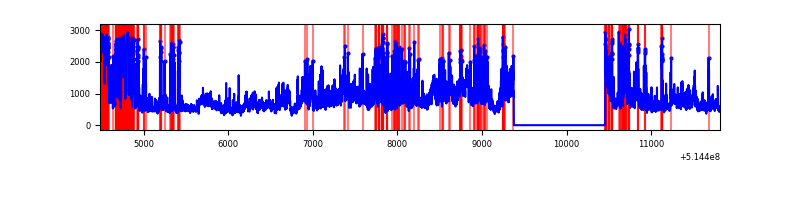 |
Top three noisy pixels from each quadrant. If the there are fewer than three noisy pixels in the level2.evt file, extra rows are filled as -1
| Pixel properties | Quadrant properties | ||||||
|---|---|---|---|---|---|---|---|
| Quadrant | DetID | PixID | Counts | Sigma | Mean | Median | Sigma |
| A | 3 | 14 | 53856 | 315.68 | 678 | 661 | 168.5 |
| A | 5 | 113 | 39525 | 230.64 | 678 | 661 | 168.5 |
| A | 13 | 254 | 10972 | 61.19 | 678 | 661 | 168.5 |
| B | 10 | 16 | 2482683 | 18797.2 | 612 | 589 | 132.0 |
| B | 10 | 32 | 53158 | 398.11 | 612 | 589 | 132.0 |
| B | 5 | 185 | 50244 | 376.04 | 612 | 589 | 132.0 |
| C | 15 | 198 | 1531649 | 8763.03 | 637 | 632 | 174.7 |
| C | 14 | 254 | 135216 | 770.31 | 637 | 632 | 174.7 |
| C | 9 | 38 | 61158 | 346.43 | 637 | 632 | 174.7 |
| D | 12 | 33 | 1574712 | 8691.89 | 630 | 599 | 181.1 |
| D | 15 | 142 | 1229719 | 6786.92 | 630 | 599 | 181.1 |
| D | 7 | 96 | 273006 | 1504.17 | 630 | 599 | 181.1 |
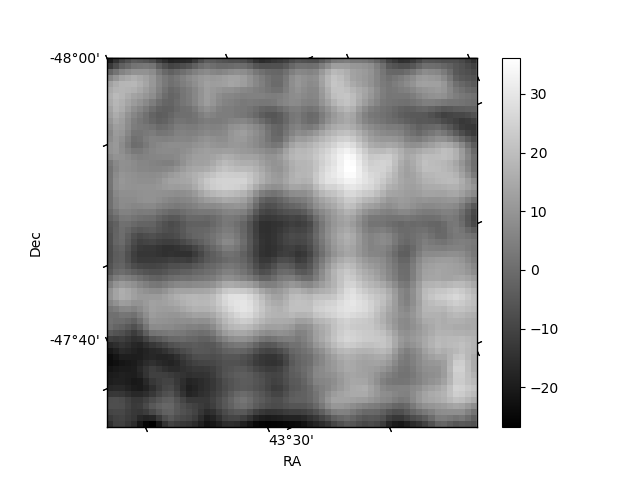
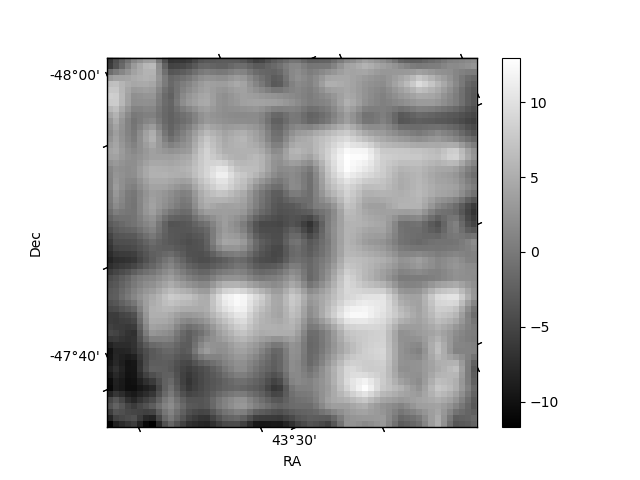
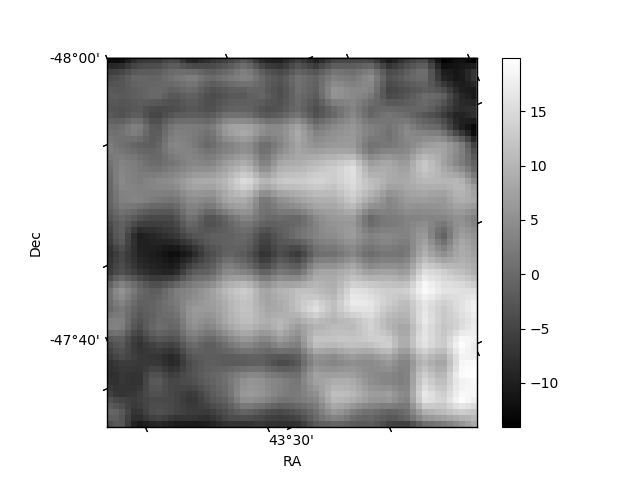
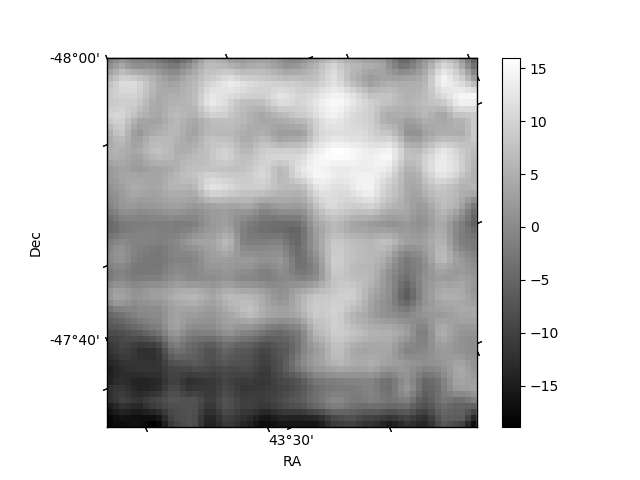
Histogram calculated using DETX and DETY for each event in the final _common_clean file
| Quadrant A | 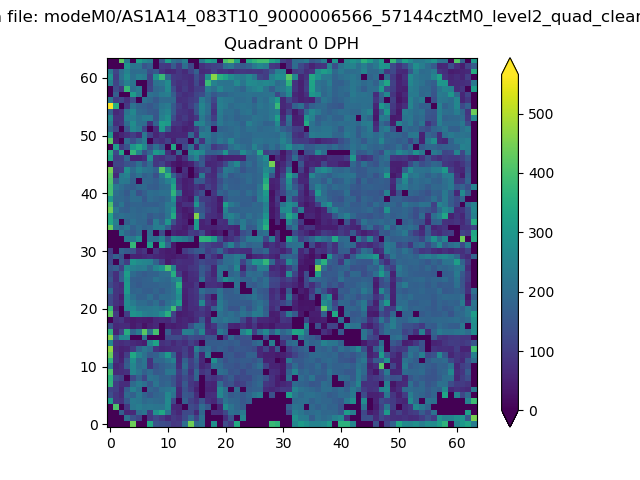 |
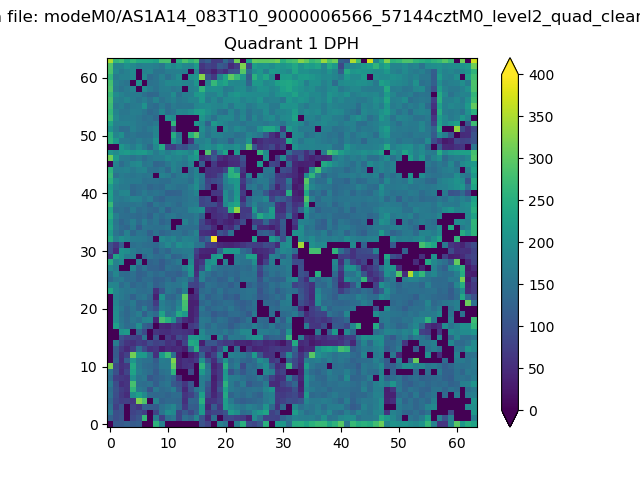 |
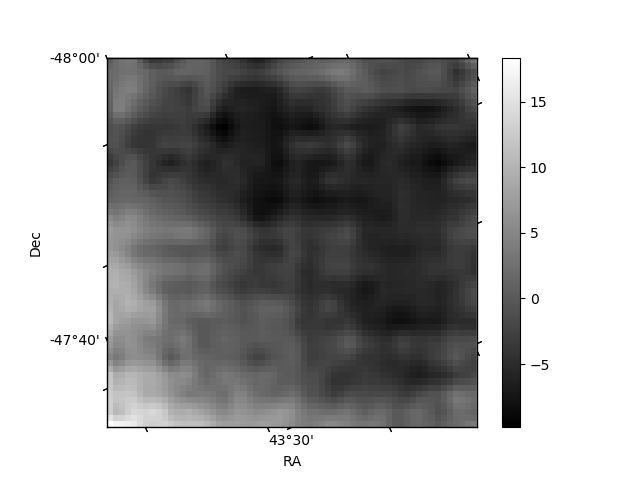
Quadrant B |
|---|---|---|---|
| Quadrant D | 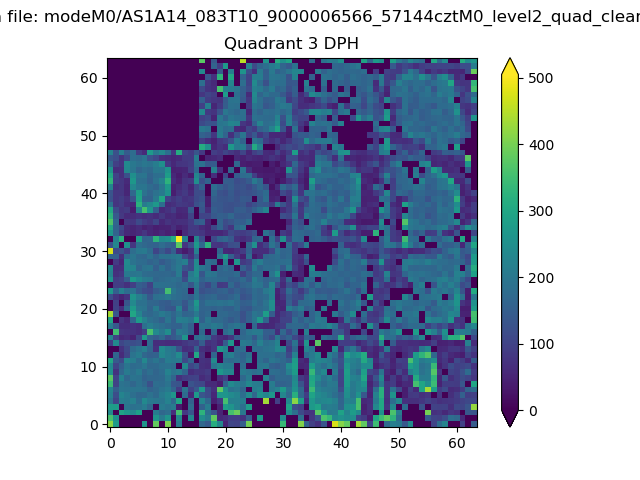 |
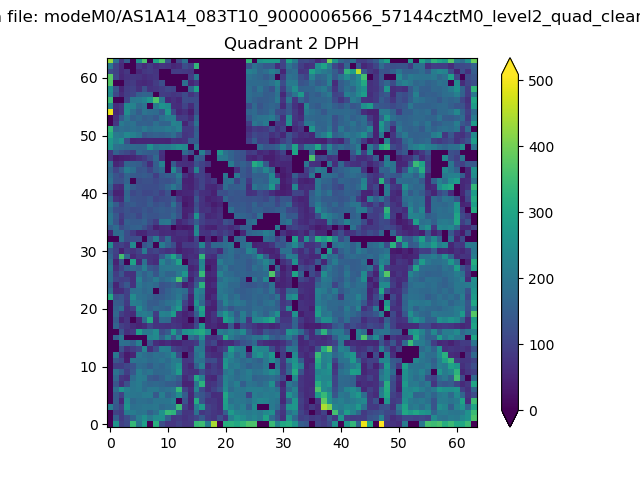 |
Quadrant C |
| Plot type | Count rate plots | Images |
|---|---|---|
| Comparison with Poisson distribution Blue bars denote a histogram of data divided into 1 sec bins. Red curve is a Poisson curve with rate = median count rate of data. |
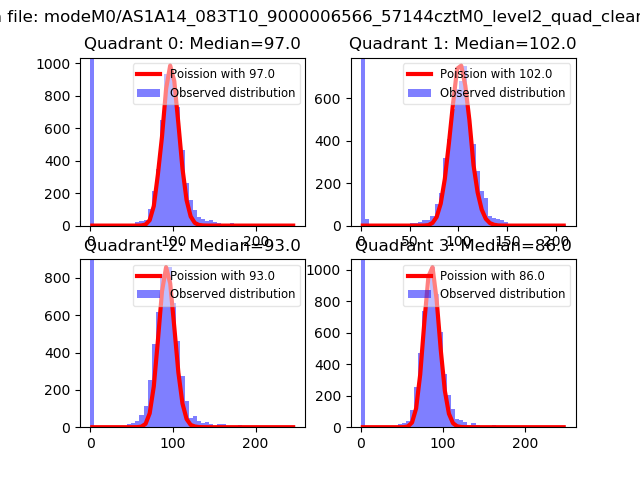 |
 |
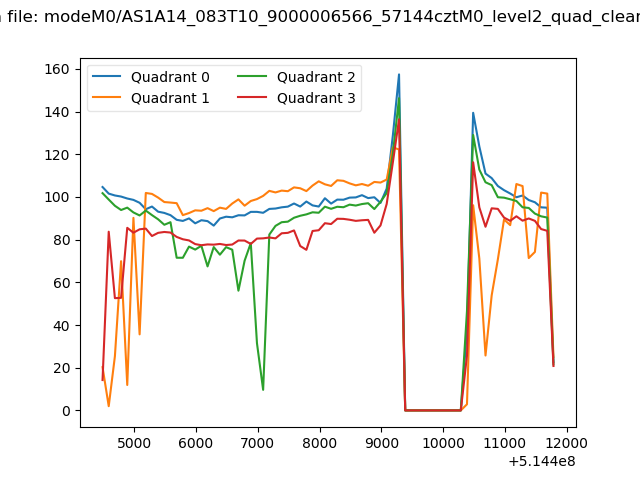
| Quadrant-wise count rates Data is divided into 100 sec bins |
 |
|
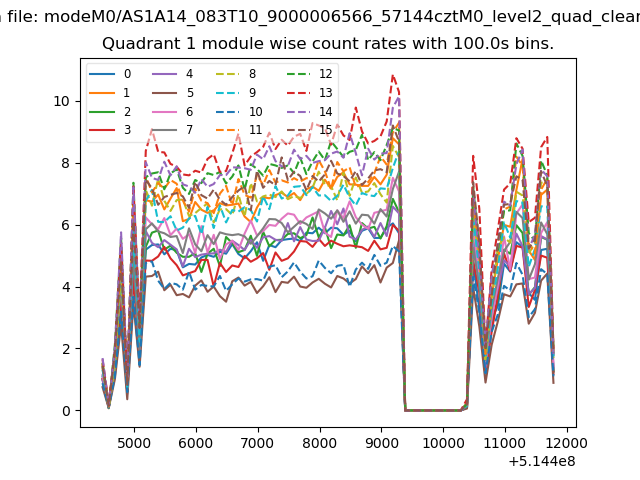
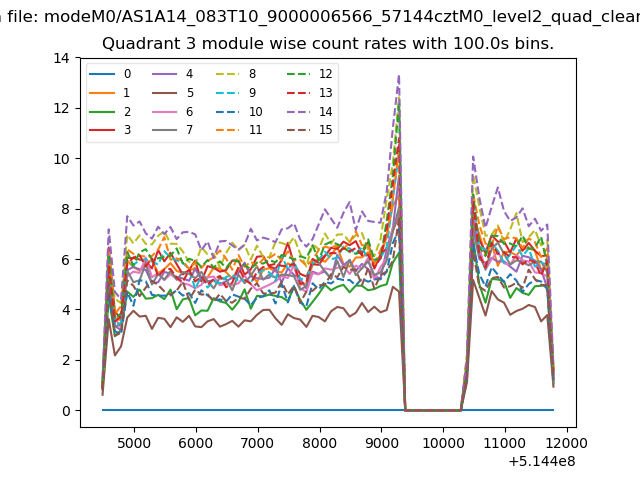
| Module-wise count rates for Quadrant A Data is divided into 100 sec bins |
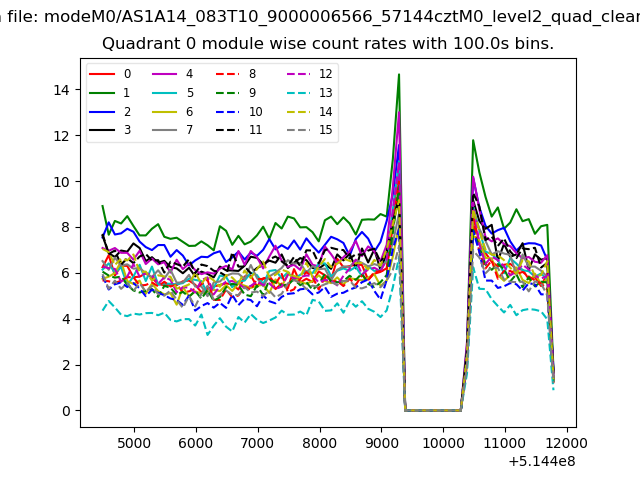 |
 |
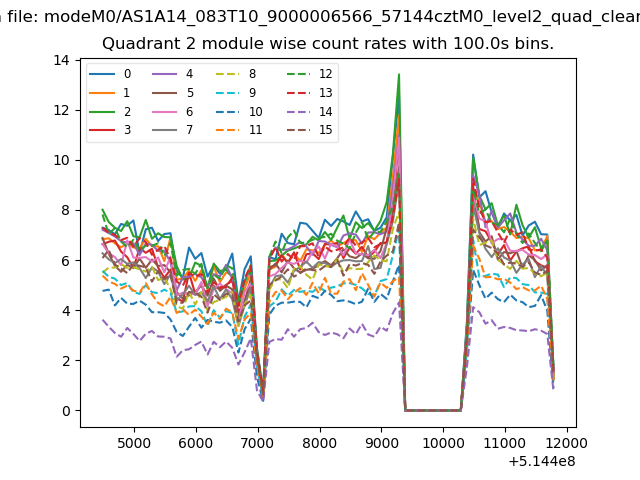
| Module-wise count rates for Quadrant B Data is divided into 100 sec bins |
 |
 |
| Module-wise count rates for Quadrant C Data is divided into 100 sec bins |
 |
 |
| Module-wise count rates for Quadrant D Data is divided into 100 sec bins |
 |
 |
| Parameter | Plot |
|---|---|
| CZT HV Monitor |  |
| D_VDD | 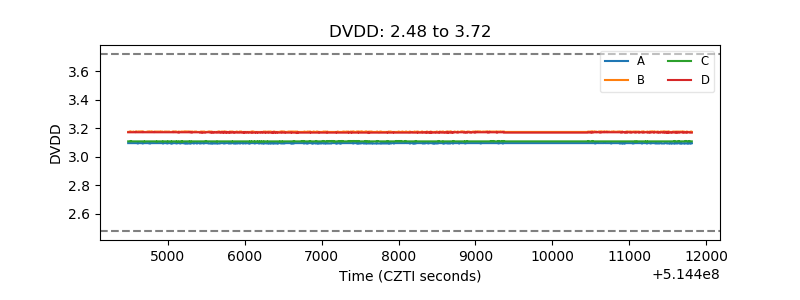 |
| Temperature 1 | 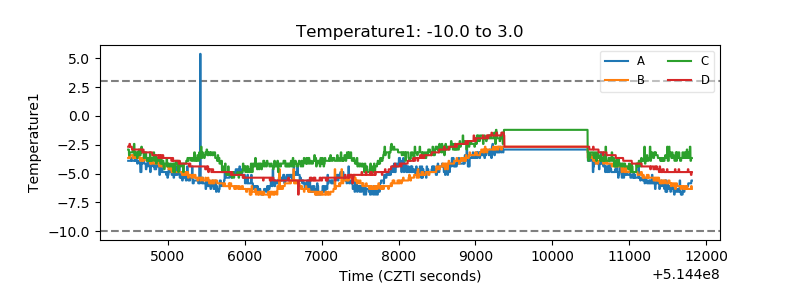 |
| Veto HV Monitor | 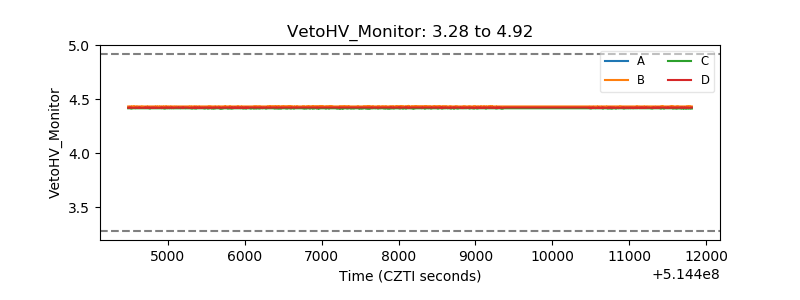 |
| Veto LLD | 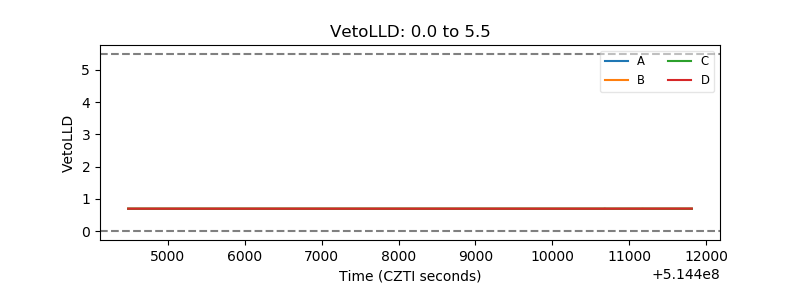 |
| Alpha Counter | 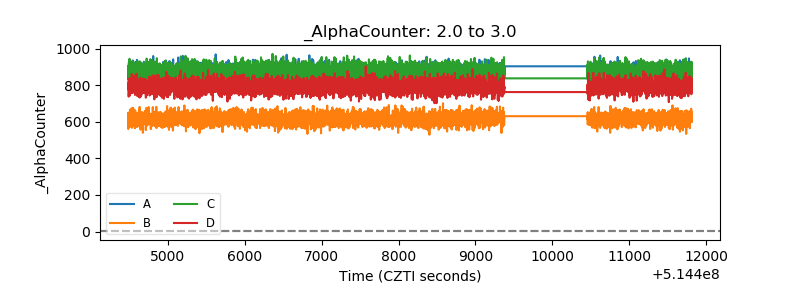 |
| _CPM_Rate | 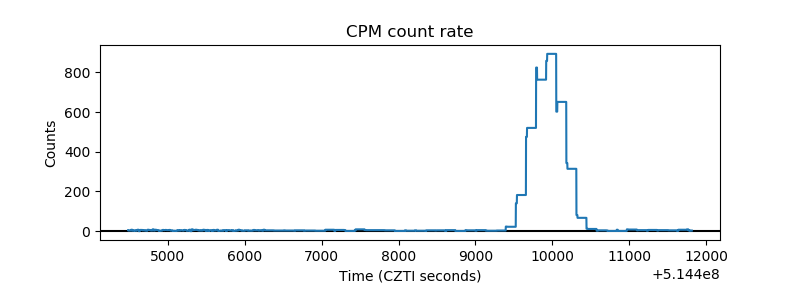 |
| CZT Counter | 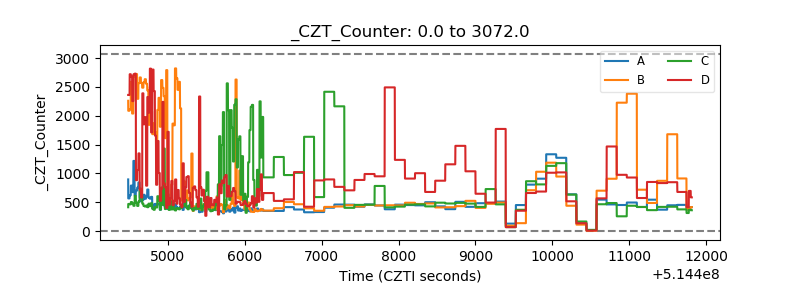 |
| +2.5 Volts monitor |  |
| +5 Volts monitor | 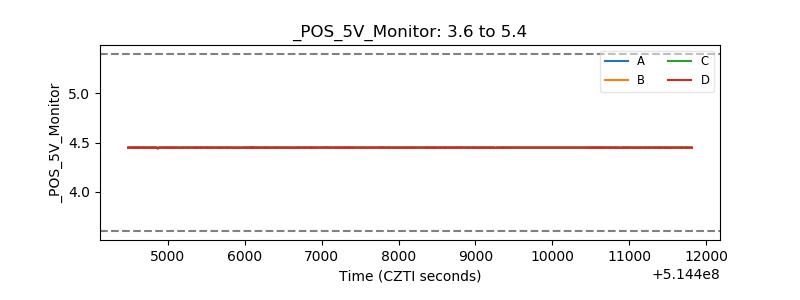 |
| _ROLL_ROT | 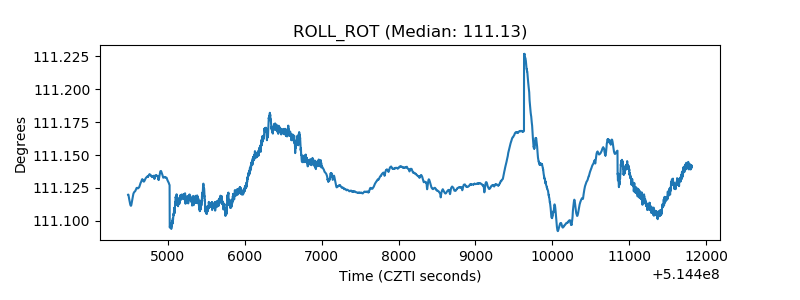 |
| _Roll_DEC | 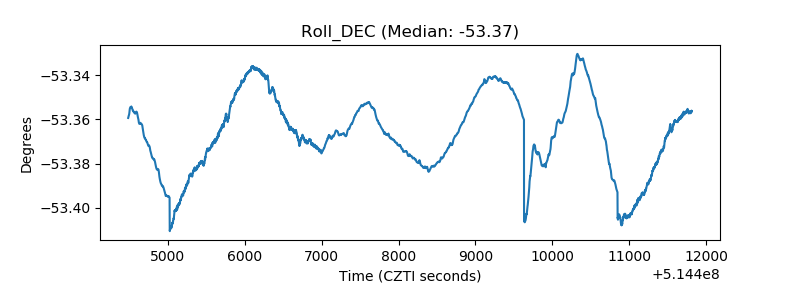 |
| _Roll_RA | 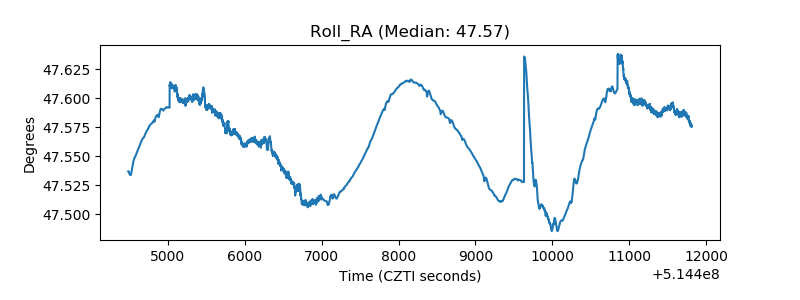 |
| Veto Counter | 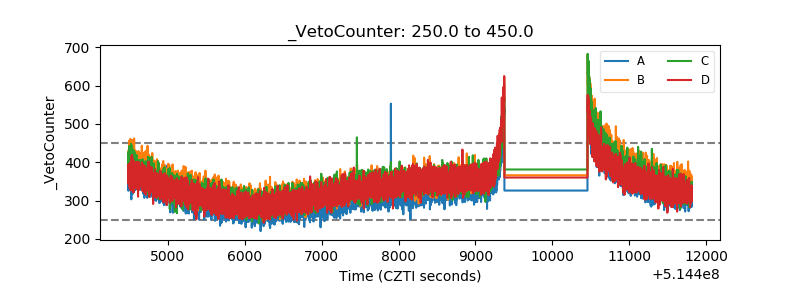 |