| Param | Original file | Final file |
|---|---|---|
| Filename | modeM0/AS1A14_083T10_9000006566_57146cztM0_level2.fits | modeM0/AS1A14_083T10_9000006566_57146cztM0_level2_quad_clean.evt |
| Size (bytes) | 585,080,640 | 89,470,080 |
| Size | 558.0 MB | 85.3 MB |
| Events in quadrant A | 2,838,891 | 649,260 |
| Events in quadrant B | 5,125,891 | 614,699 |
| Events in quadrant C | 7,270,517 | 450,566 |
| Events in quadrant D | 5,927,244 | 550,085 |
| Mode M9 | |||
|---|---|---|---|
| Quadrant | BADHDUFLAG | Total packets | Discarded packets |
| A | 0 | 13 | 0 |
| B | 0 | 14 | 0 |
| C | 0 | 14 | 0 |
| D | 0 | 14 | 0 |
| Mode M0 | |||
|---|---|---|---|
| Quadrant | BADHDUFLAG | Total packets | Discarded packets |
| A | 0 | 13117 | 3 |
| B | 0 | 19625 | 2 |
| C | 0 | 25949 | 2 |
| D | 0 | 22024 | 2 |
| Mode SS | |||
|---|---|---|---|
| Quadrant | BADHDUFLAG | Total packets | Discarded packets |
| A | 0 | 128 | 0 |
| B | 0 | 128 | 0 |
| C | 0 | 128 | 0 |
| D | 0 | 128 | 0 |
| Quadrant | Total seconds | Saturated seconds | Saturation percentage |
|---|---|---|---|
| A | 6375 | 45 | 0.705882% |
| B | 6375 | 844 | 13.239216% |
| C | 6375 | 1952 | 30.619608% |
| D | 6375 | 413 | 6.478431% |
Noise dominated data is calculated using 1-second bins in cleaned event files. If a bin has >2000 counts, and if more than 50% of those come from <1% of pixels, then it is considered to be noise-dominated and hence unusable.
| Quadrant | # 1 sec bins | Bins with >0 counts | Bins with >2000 counts | High rate bins dominated by noise | Noise dominated (total time) | Noise dominated (detector-on time) | Marked lightcurve |
|---|---|---|---|---|---|---|---|
| A | 7535 | 6376 | 6 | 6 | 0.08% | 0.09% | 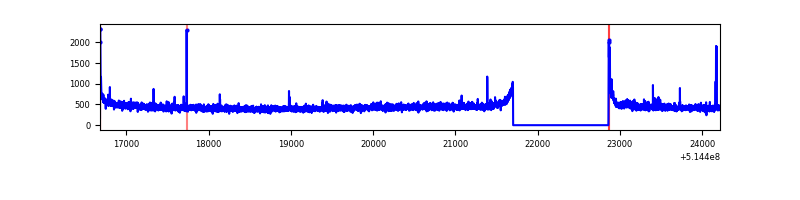 |
| B | 7535 | 6376 | 590 | 590 | 7.83% | 9.25% | 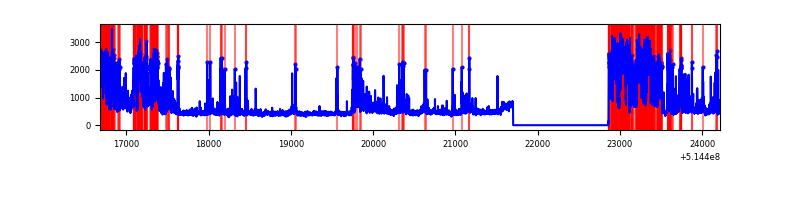 |
| C | 7535 | 6376 | 1658 | 1658 | 22.00% | 26.00% | 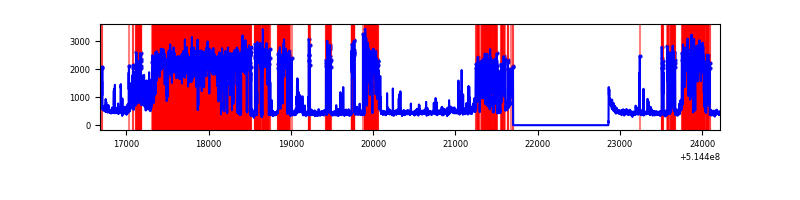 |
| D | 7535 | 6376 | 394 | 394 | 5.23% | 6.18% | 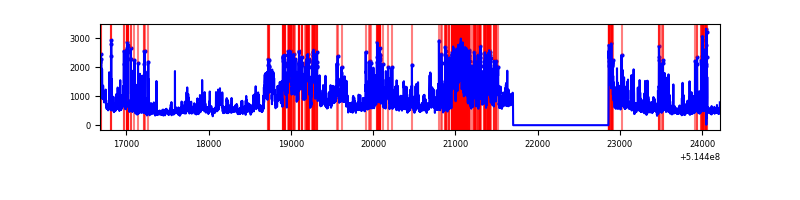 |
Top three noisy pixels from each quadrant. If the there are fewer than three noisy pixels in the level2.evt file, extra rows are filled as -1
| Pixel properties | Quadrant properties | ||||||
|---|---|---|---|---|---|---|---|
| Quadrant | DetID | PixID | Counts | Sigma | Mean | Median | Sigma |
| A | 3 | 14 | 39761 | 223.31 | 712 | 694 | 174.9 |
| A | 8 | 6 | 20614 | 113.86 | 712 | 694 | 174.9 |
| A | 5 | 113 | 19371 | 106.76 | 712 | 694 | 174.9 |
| B | 10 | 16 | 2224002 | 15962.41 | 653 | 629 | 139.3 |
| B | 5 | 185 | 71812 | 511.05 | 653 | 629 | 139.3 |
| B | 0 | 213 | 68008 | 483.74 | 653 | 629 | 139.3 |
| C | 15 | 198 | 4067429 | 25256.65 | 589 | 583 | 161.0 |
| C | 9 | 38 | 662915 | 4113.33 | 589 | 583 | 161.0 |
| C | 2 | 12 | 65630 | 403.97 | 589 | 583 | 161.0 |
| D | 15 | 142 | 1472628 | 7696.83 | 668 | 635 | 191.2 |
| D | 12 | 33 | 985517 | 5149.8 | 668 | 635 | 191.2 |
| D | 2 | 249 | 420464 | 2195.22 | 668 | 635 | 191.2 |
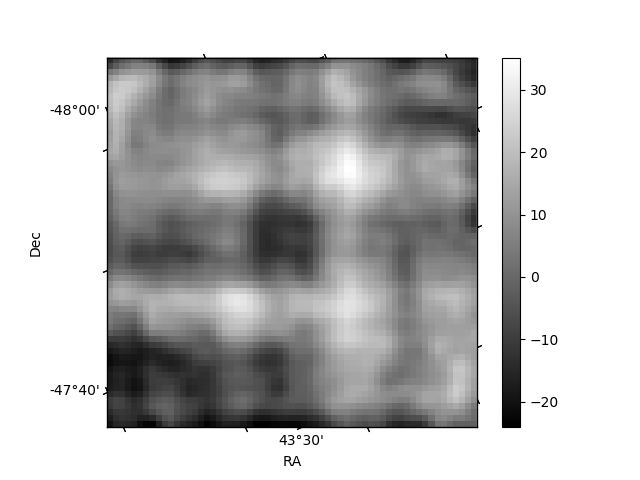
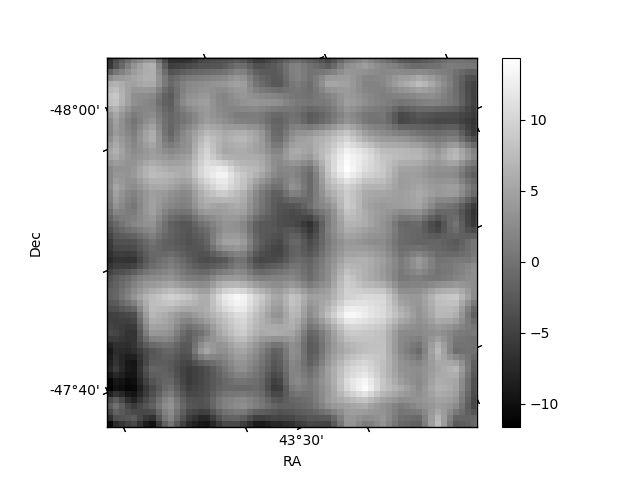
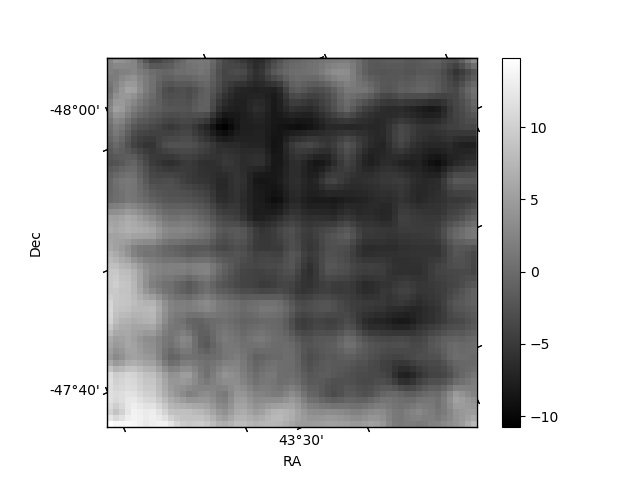
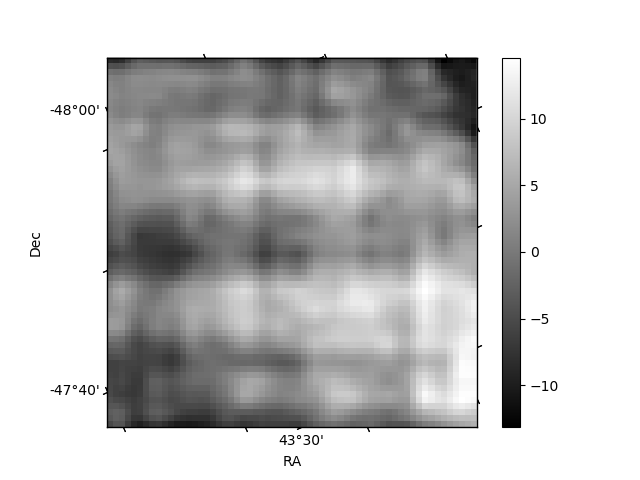
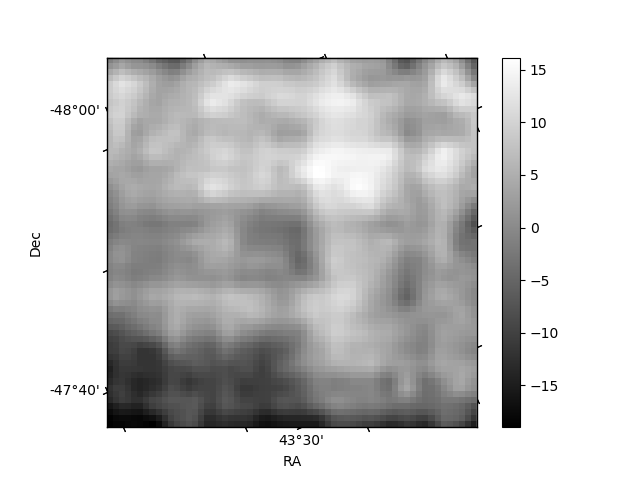
Histogram calculated using DETX and DETY for each event in the final _common_clean file
| Quadrant A | 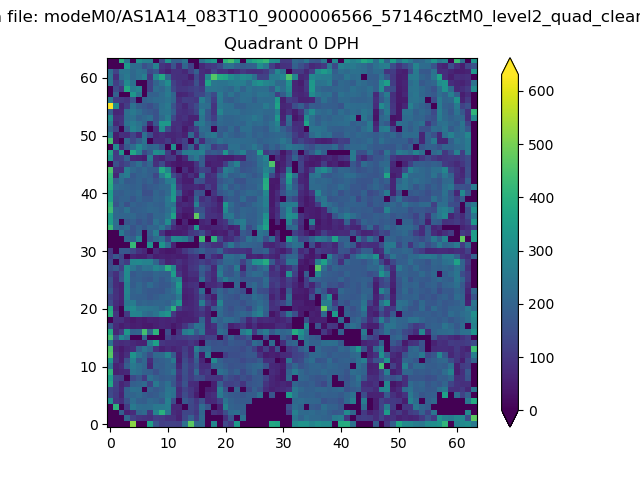 |
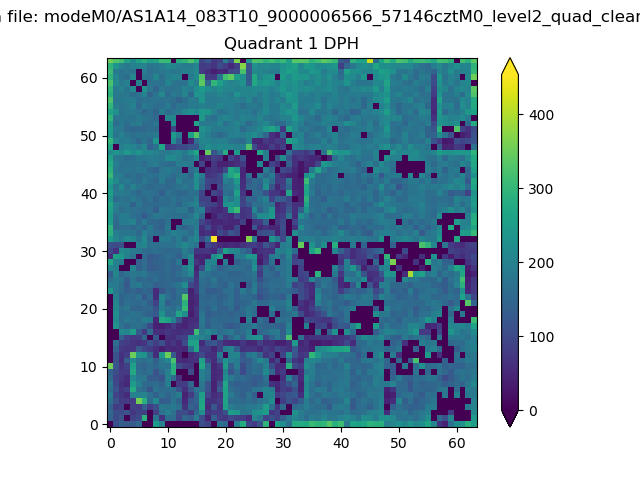 |
Quadrant B |
|---|---|---|---|
| Quadrant D | 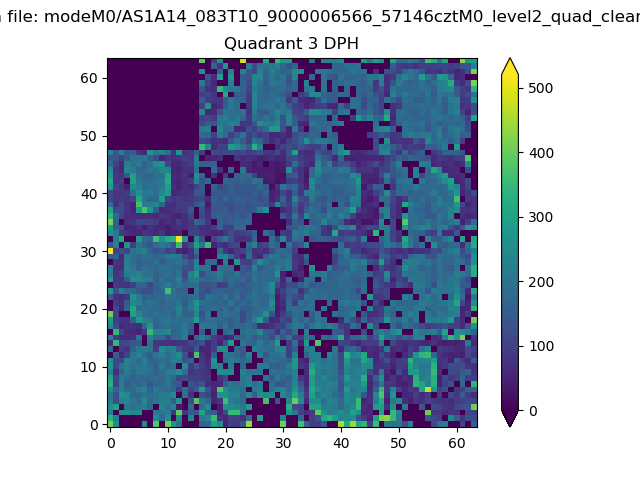 |
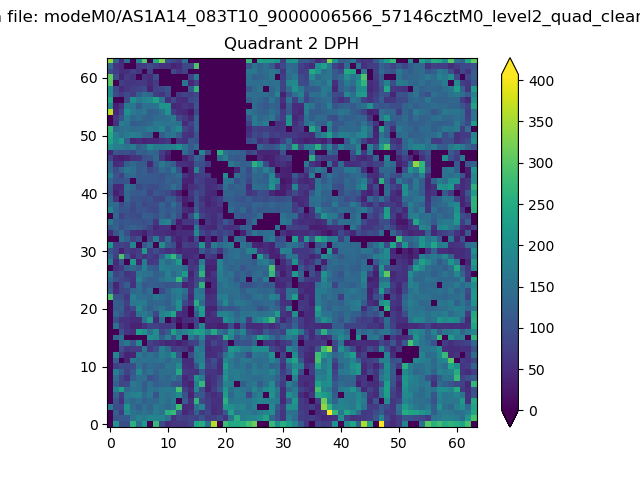 |
Quadrant C |
| Plot type | Count rate plots | Images |
|---|---|---|
| Comparison with Poisson distribution Blue bars denote a histogram of data divided into 1 sec bins. Red curve is a Poisson curve with rate = median count rate of data. |
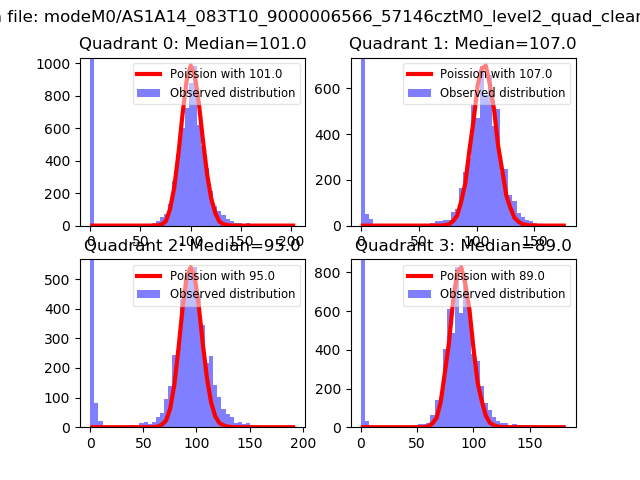 |
 |
| Quadrant-wise count rates Data is divided into 100 sec bins |
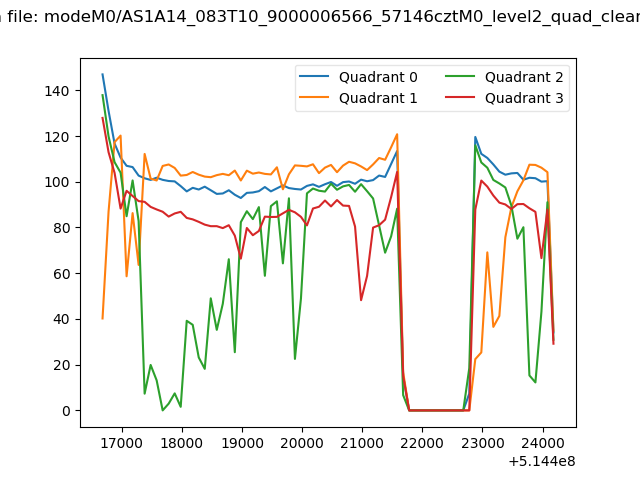 |
|
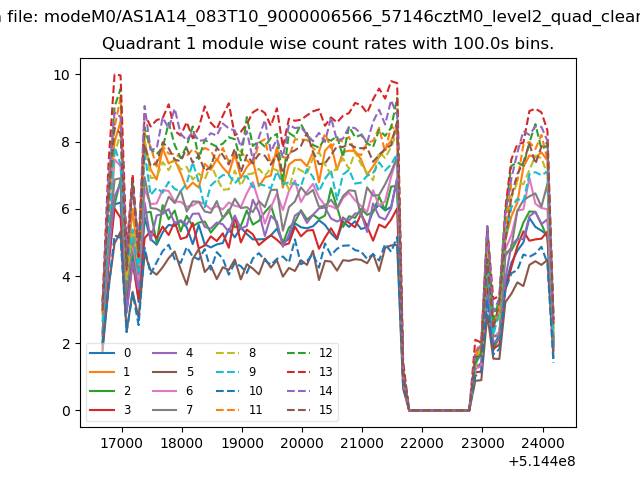
| Module-wise count rates for Quadrant A Data is divided into 100 sec bins |
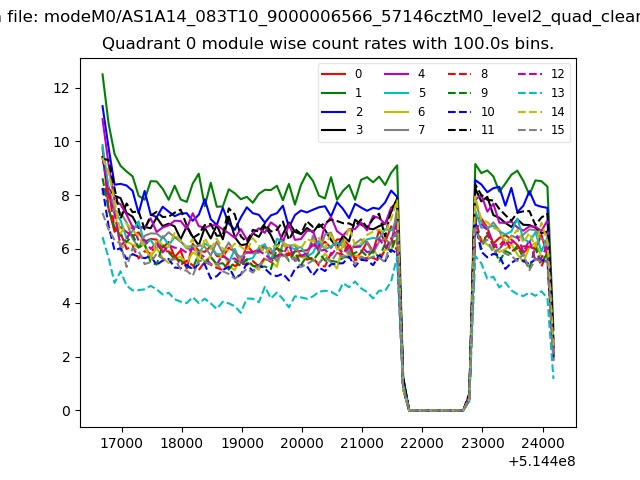 |
 |
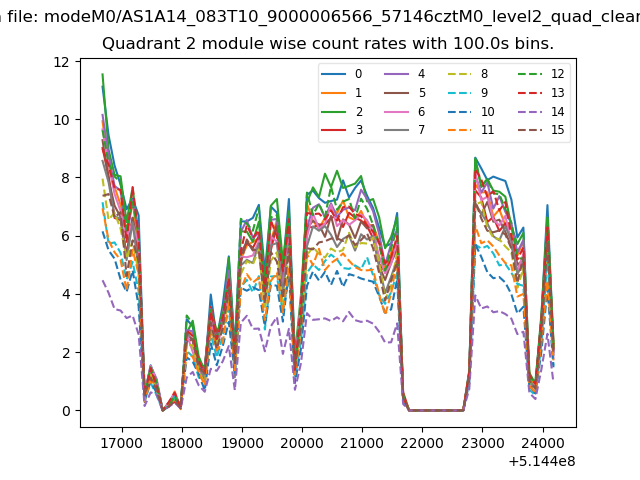
| Module-wise count rates for Quadrant B Data is divided into 100 sec bins |
 |
 |
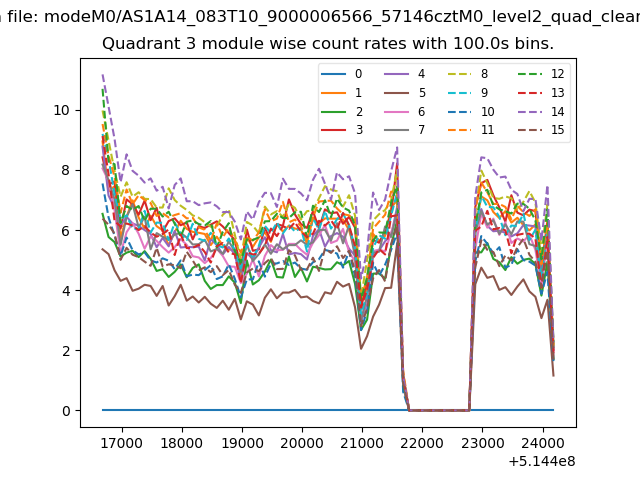
| Module-wise count rates for Quadrant C Data is divided into 100 sec bins |
 |
 |
| Module-wise count rates for Quadrant D Data is divided into 100 sec bins |
 |
 |
| Parameter | Plot |
|---|---|
| CZT HV Monitor | 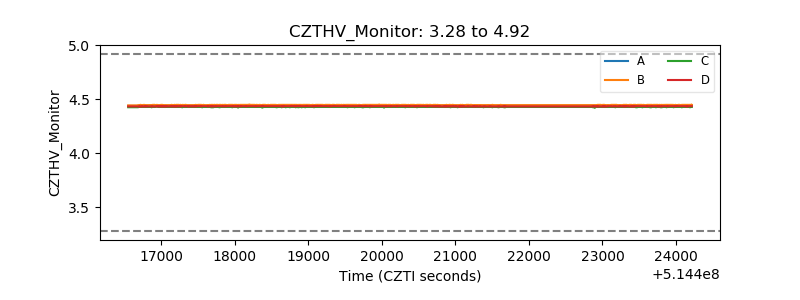 |
| D_VDD | 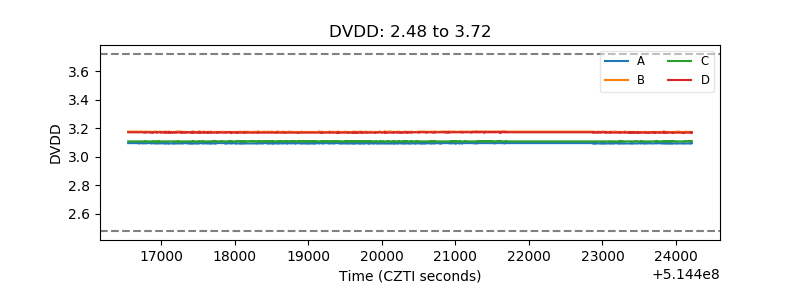 |
| Temperature 1 | 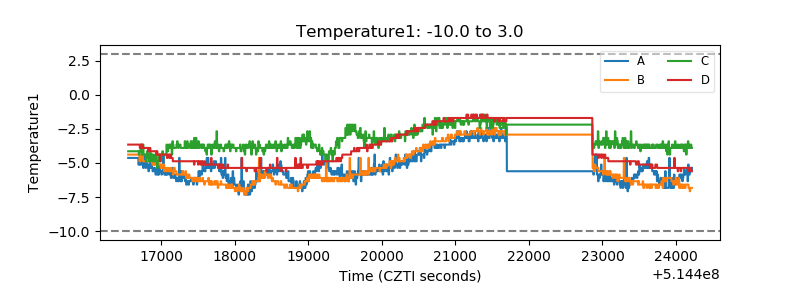 |
| Veto HV Monitor | 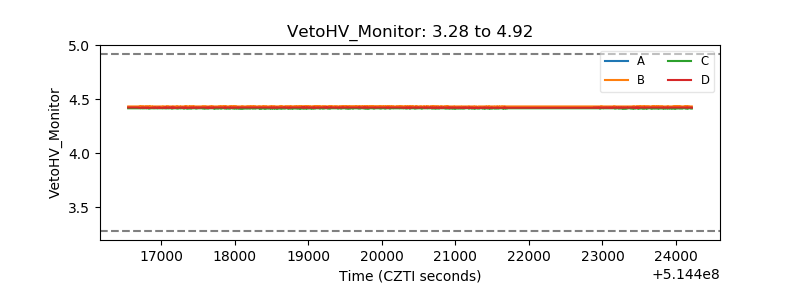 |
| Veto LLD | 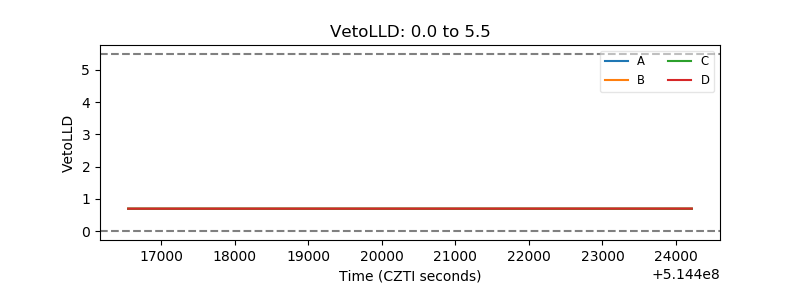 |
| Alpha Counter | 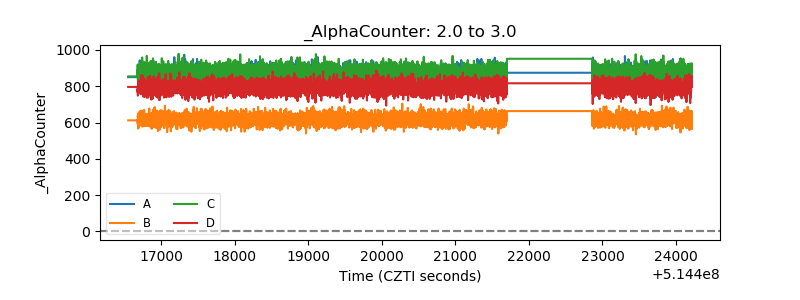 |
| _CPM_Rate | 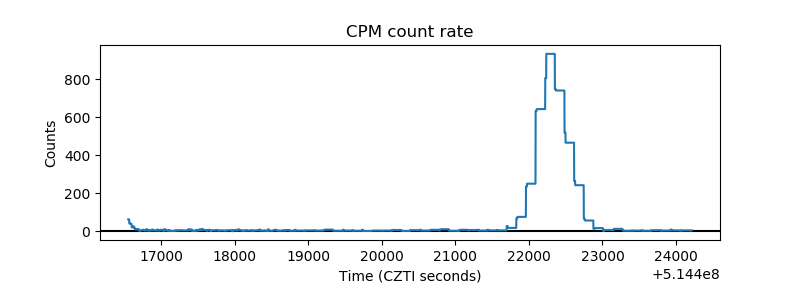 |
| CZT Counter | 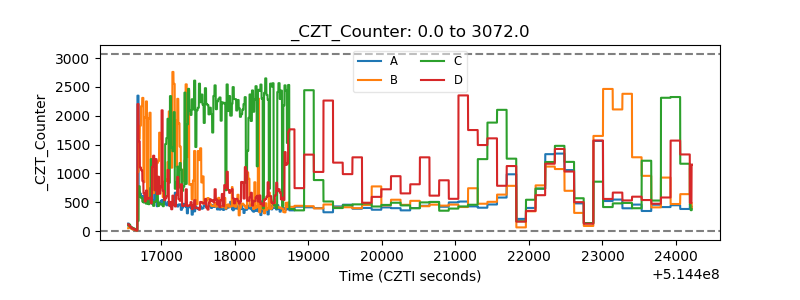 |
| +2.5 Volts monitor |  |
| +5 Volts monitor |  |
| _ROLL_ROT | 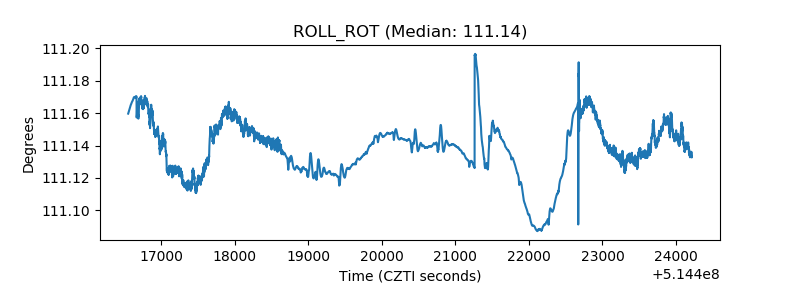 |
| _Roll_DEC | 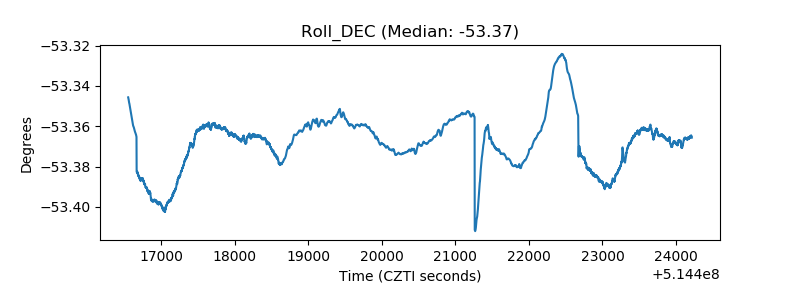 |
| _Roll_RA | 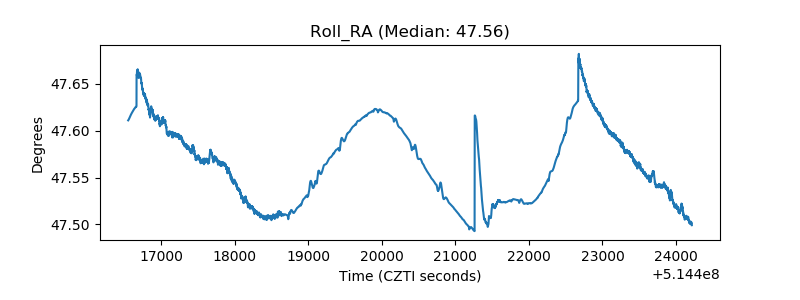 |
| Veto Counter | 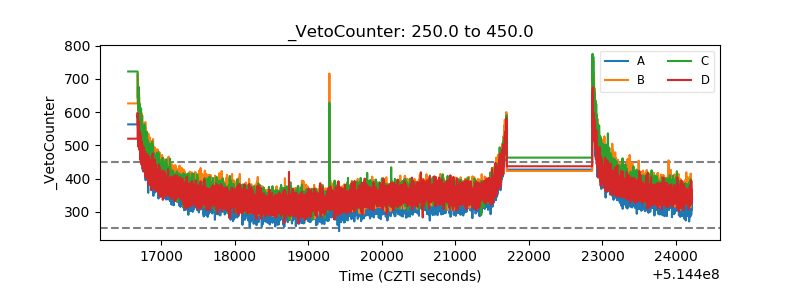 |