| Param | Original file | Final file |
|---|---|---|
| Filename | modeM0/AS1A14_083T10_9000006566_57147cztM0_level2.fits | modeM0/AS1A14_083T10_9000006566_57147cztM0_level2_quad_clean.evt |
| Size (bytes) | 470,099,520 | 93,548,160 |
| Size | 448.3 MB | 89.2 MB |
| Events in quadrant A | 3,032,683 | 644,367 |
| Events in quadrant B | 4,966,775 | 609,563 |
| Events in quadrant C | 3,730,026 | 584,905 |
| Events in quadrant D | 5,173,221 | 546,375 |
| Mode M9 | |||
|---|---|---|---|
| Quadrant | BADHDUFLAG | Total packets | Discarded packets |
| A | 0 | 18 | 0 |
| B | 0 | 19 | 0 |
| C | 0 | 19 | 0 |
| D | 0 | 19 | 0 |
| Mode M0 | |||
|---|---|---|---|
| Quadrant | BADHDUFLAG | Total packets | Discarded packets |
| A | 0 | 13674 | 2 |
| B | 0 | 19272 | 2 |
| C | 0 | 15605 | 2 |
| D | 0 | 19670 | 2 |
| Mode SS | |||
|---|---|---|---|
| Quadrant | BADHDUFLAG | Total packets | Discarded packets |
| A | 0 | 130 | 0 |
| B | 0 | 130 | 0 |
| C | 0 | 130 | 0 |
| D | 0 | 130 | 0 |
| Quadrant | Total seconds | Saturated seconds | Saturation percentage |
|---|---|---|---|
| A | 6416 | 41 | 0.639027% |
| B | 6416 | 847 | 13.201372% |
| C | 6416 | 334 | 5.205736% |
| D | 6416 | 329 | 5.127805% |
Noise dominated data is calculated using 1-second bins in cleaned event files. If a bin has >2000 counts, and if more than 50% of those come from <1% of pixels, then it is considered to be noise-dominated and hence unusable.
| Quadrant | # 1 sec bins | Bins with >0 counts | Bins with >2000 counts | High rate bins dominated by noise | Noise dominated (total time) | Noise dominated (detector-on time) | Marked lightcurve |
|---|---|---|---|---|---|---|---|
| A | 7601 | 6417 | 10 | 10 | 0.13% | 0.16% | 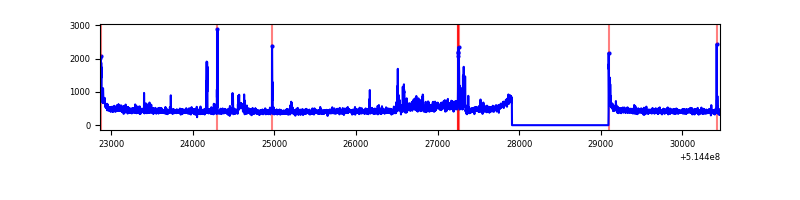 |
| B | 7601 | 6417 | 632 | 632 | 8.31% | 9.85% | 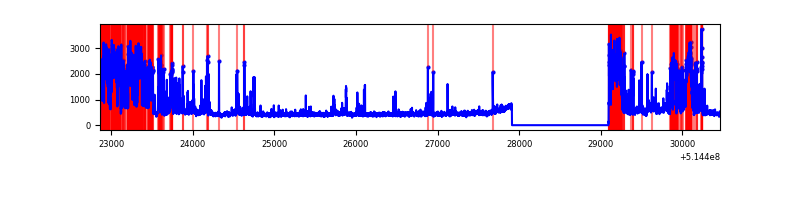 |
| C | 7601 | 6417 | 274 | 274 | 3.60% | 4.27% | 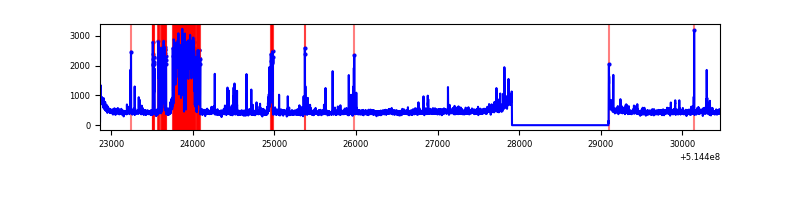 |
| D | 7601 | 6417 | 284 | 284 | 3.74% | 4.43% | 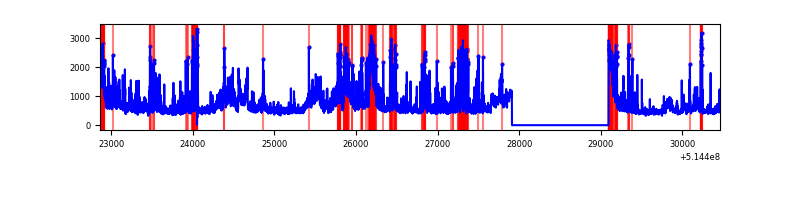 |
Top three noisy pixels from each quadrant. If the there are fewer than three noisy pixels in the level2.evt file, extra rows are filled as -1
| Pixel properties | Quadrant properties | ||||||
|---|---|---|---|---|---|---|---|
| Quadrant | DetID | PixID | Counts | Sigma | Mean | Median | Sigma |
| A | 3 | 14 | 208028 | 1187.72 | 712 | 693 | 174.6 |
| A | 8 | 6 | 36521 | 205.24 | 712 | 693 | 174.6 |
| A | 4 | 3 | 12372 | 66.9 | 712 | 693 | 174.6 |
| B | 10 | 16 | 2020489 | 14605.01 | 649 | 626 | 138.3 |
| B | 10 | 247 | 199890 | 1440.82 | 649 | 626 | 138.3 |
| B | 0 | 63 | 56936 | 407.16 | 649 | 626 | 138.3 |
| C | 15 | 198 | 669719 | 3678.72 | 676 | 670 | 181.9 |
| C | 12 | 252 | 109825 | 600.18 | 676 | 670 | 181.9 |
| C | 2 | 12 | 80172 | 437.14 | 676 | 670 | 181.9 |
| D | 15 | 142 | 1090985 | 5756.6 | 671 | 639 | 189.4 |
| D | 12 | 33 | 542779 | 2862.29 | 671 | 639 | 189.4 |
| D | 2 | 120 | 224879 | 1183.9 | 671 | 639 | 189.4 |
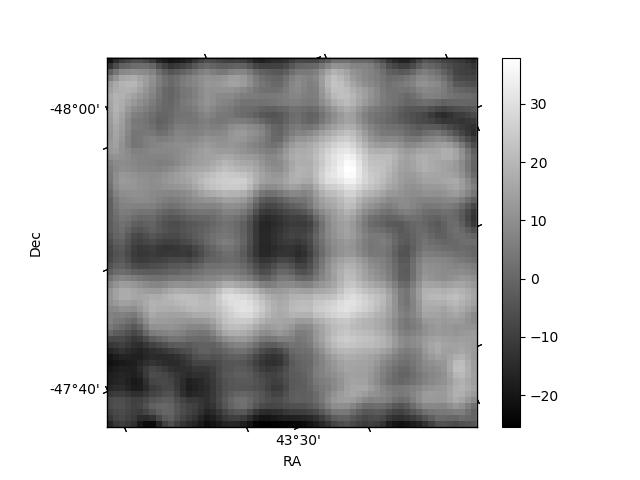
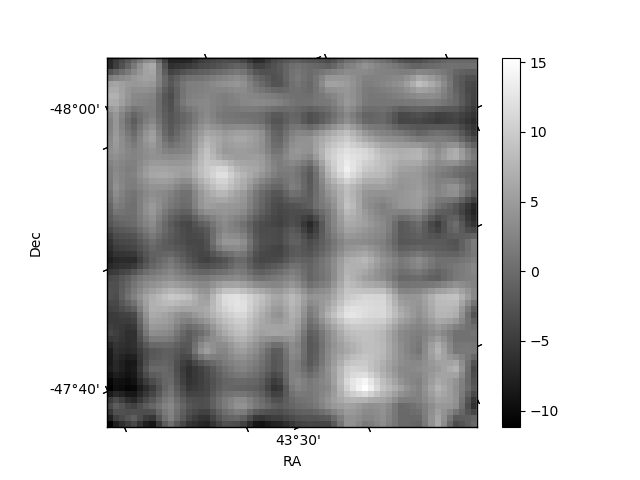
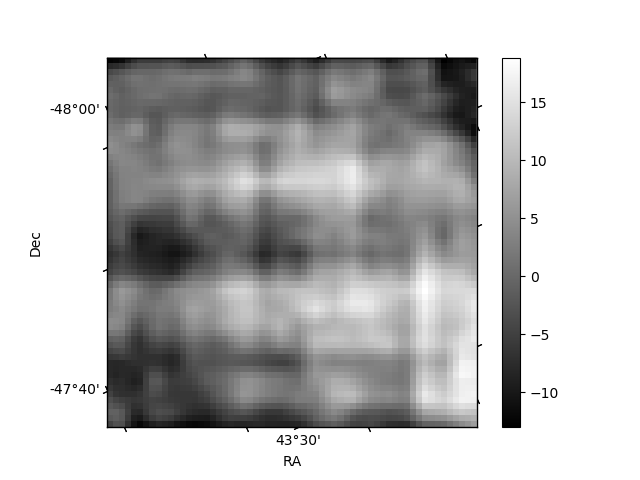
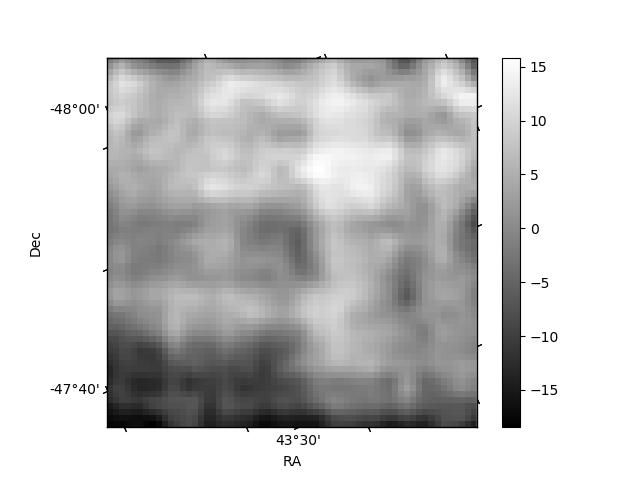
Histogram calculated using DETX and DETY for each event in the final _common_clean file
| Quadrant A | 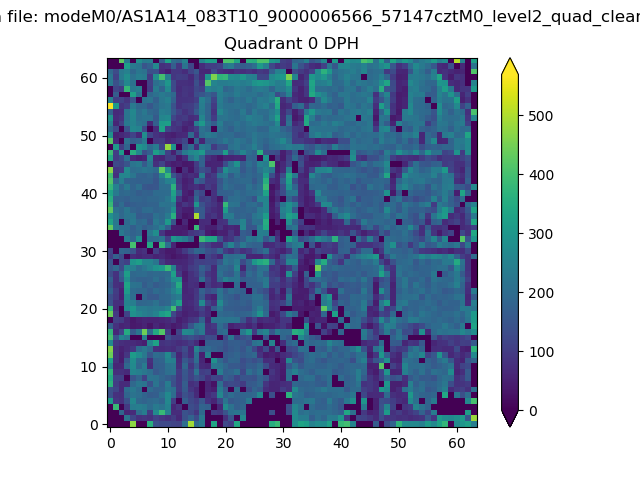 |
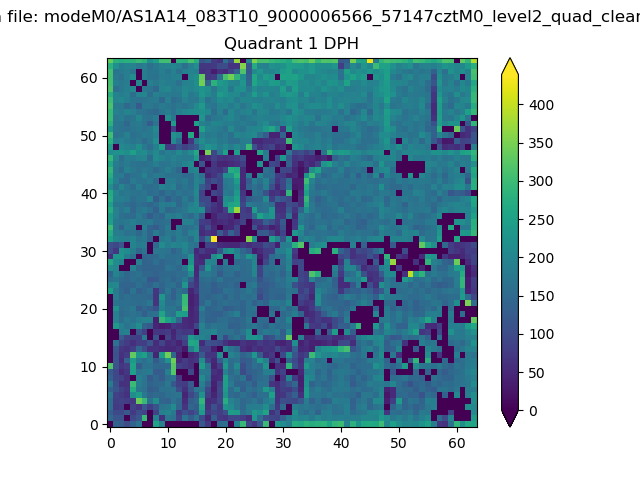 |
Quadrant B |
|---|---|---|---|
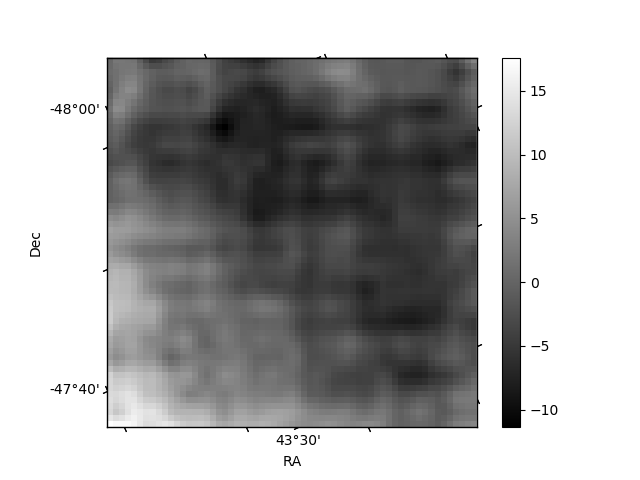
| Quadrant D | 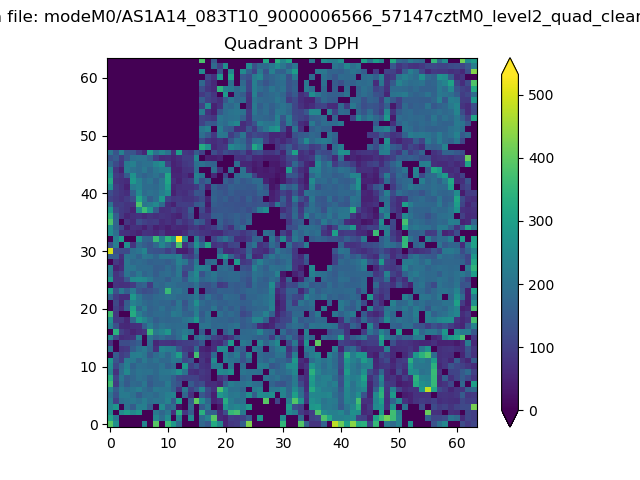 |
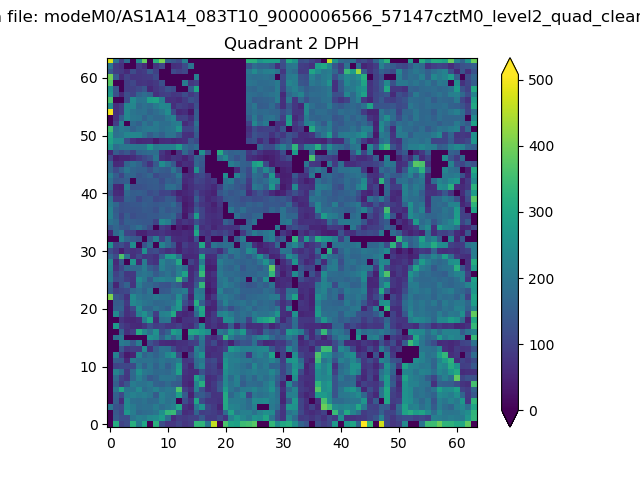 |
Quadrant C |
| Plot type | Count rate plots | Images |
|---|---|---|
| Comparison with Poisson distribution Blue bars denote a histogram of data divided into 1 sec bins. Red curve is a Poisson curve with rate = median count rate of data. |
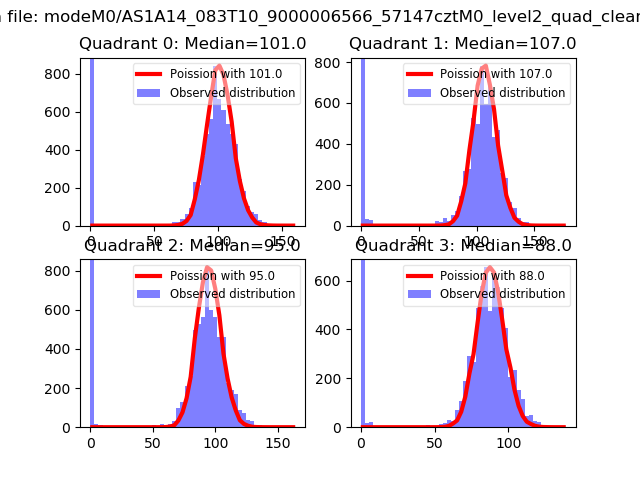 |
 |
| Quadrant-wise count rates Data is divided into 100 sec bins |
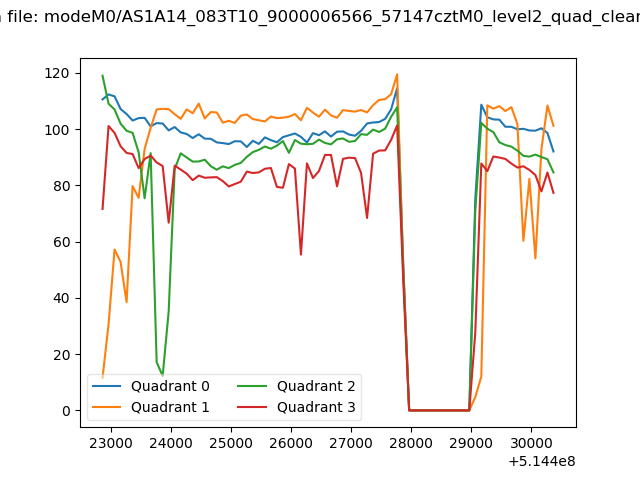 |
|
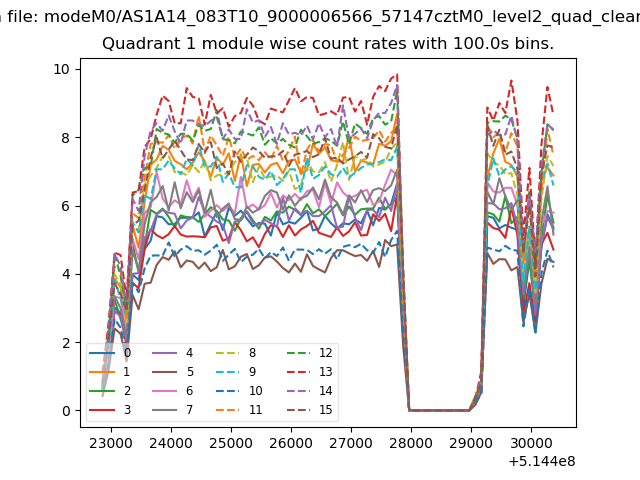
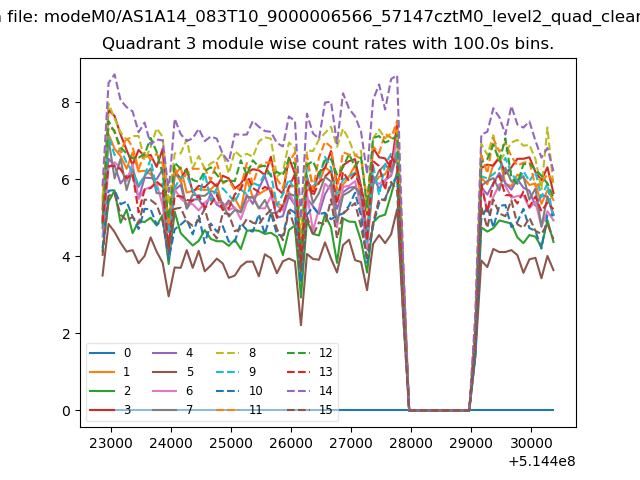
| Module-wise count rates for Quadrant A Data is divided into 100 sec bins |
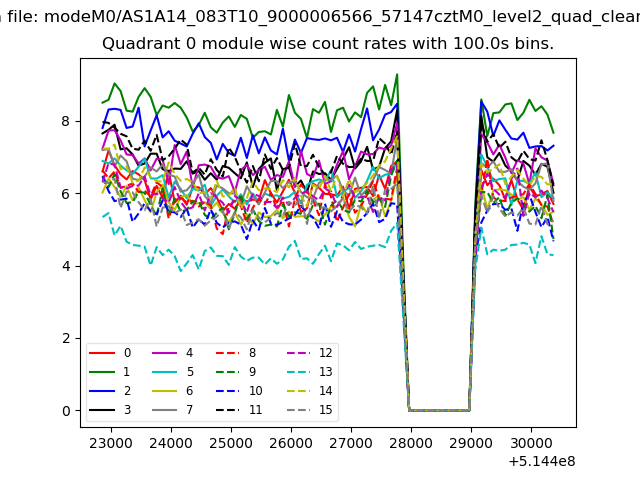 |
 |
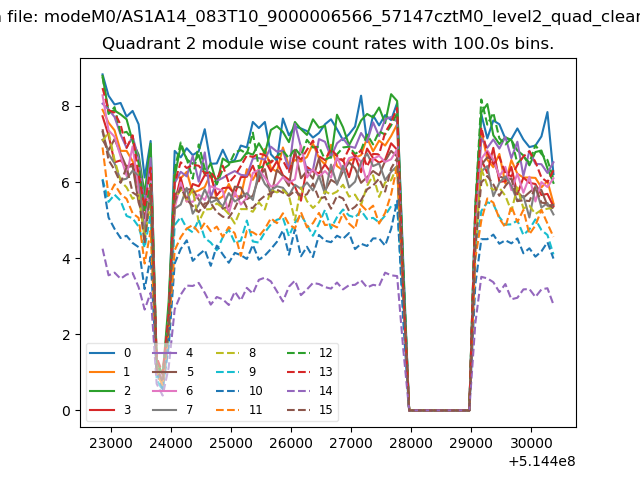
| Module-wise count rates for Quadrant B Data is divided into 100 sec bins |
 |
 |
| Module-wise count rates for Quadrant C Data is divided into 100 sec bins |
 |
 |
| Module-wise count rates for Quadrant D Data is divided into 100 sec bins |
 |
 |
| Parameter | Plot |
|---|---|
| CZT HV Monitor | 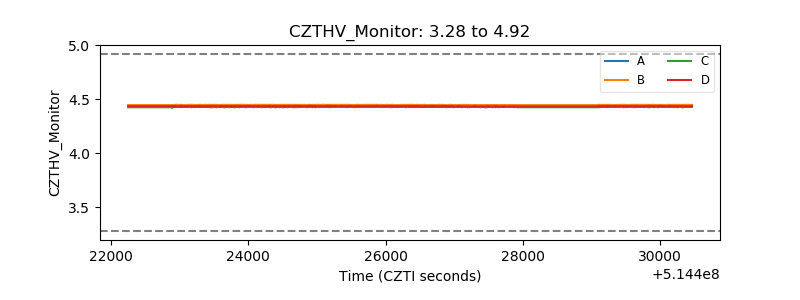 |
| D_VDD | 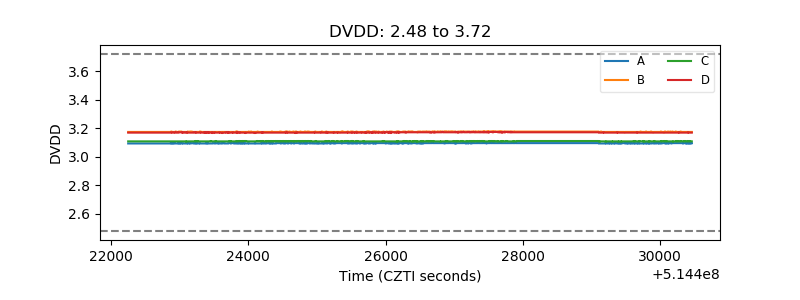 |
| Temperature 1 | 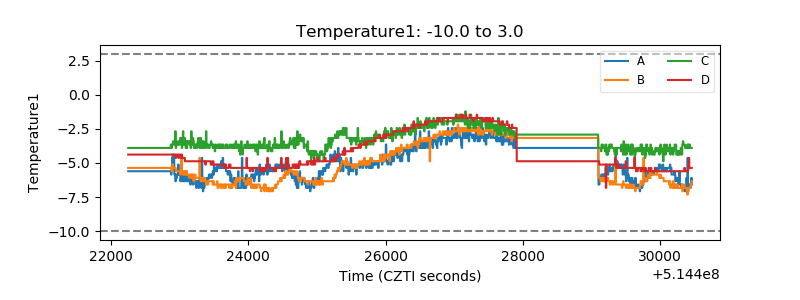 |
| Veto HV Monitor | 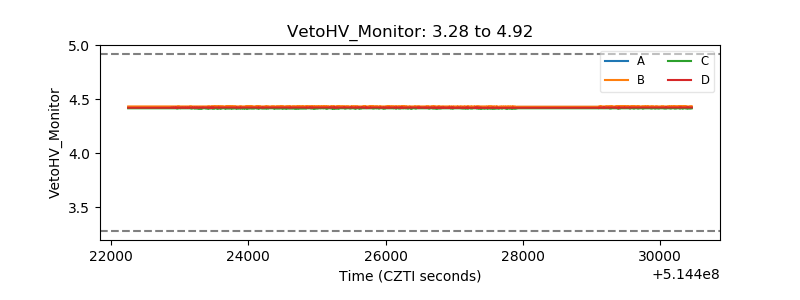 |
| Veto LLD | 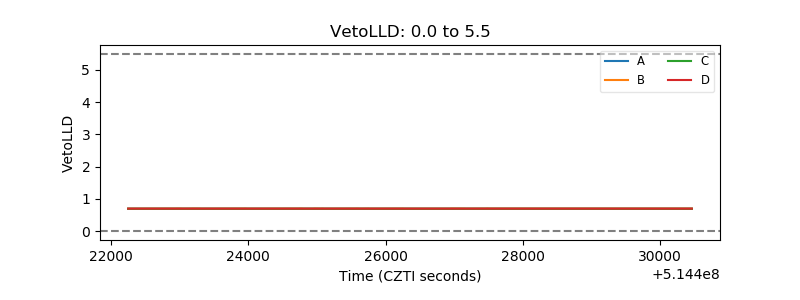 |
| Alpha Counter | 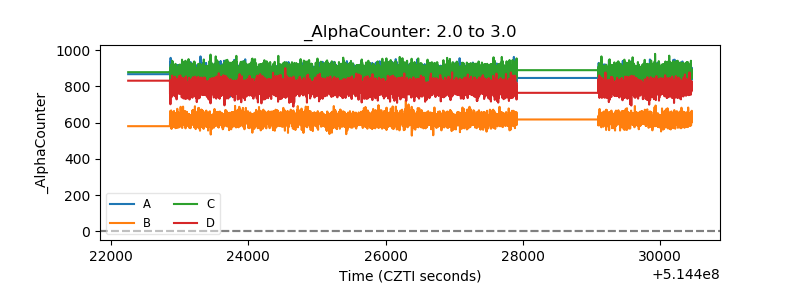 |
| _CPM_Rate | 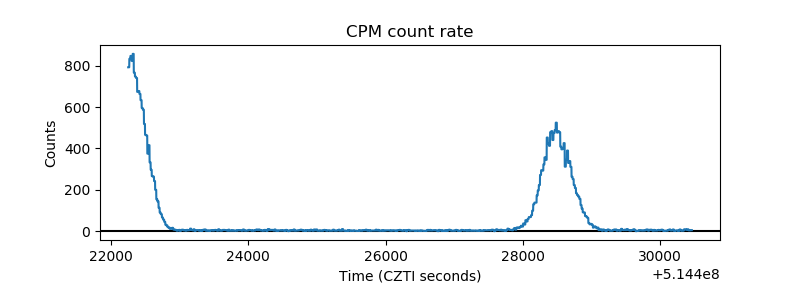 |
| CZT Counter | 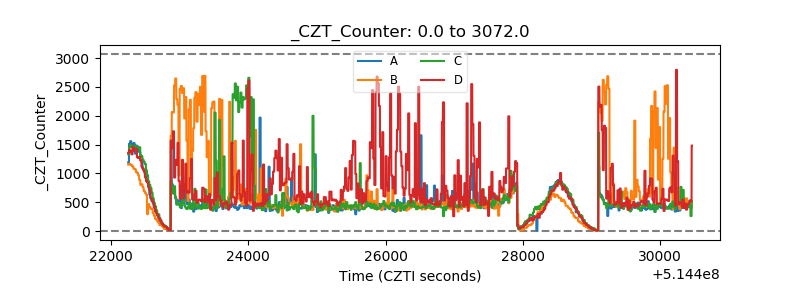 |
| +2.5 Volts monitor | 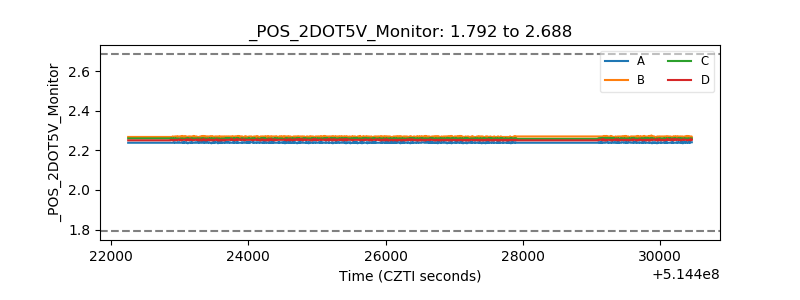 |
| +5 Volts monitor | 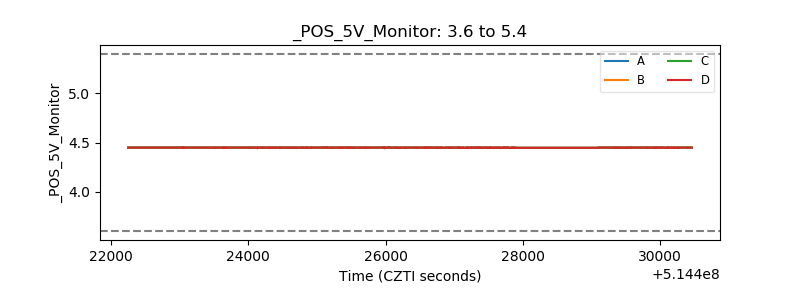 |
| _ROLL_ROT | 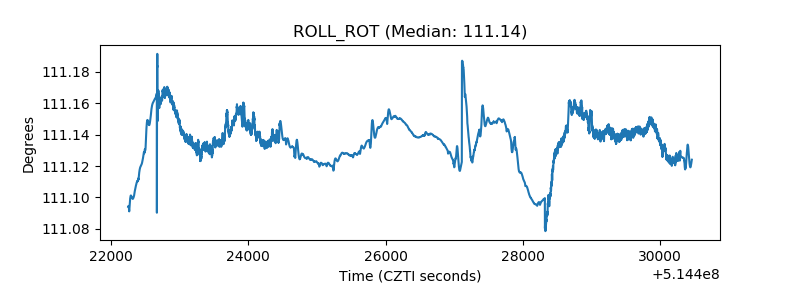 |
| _Roll_DEC | 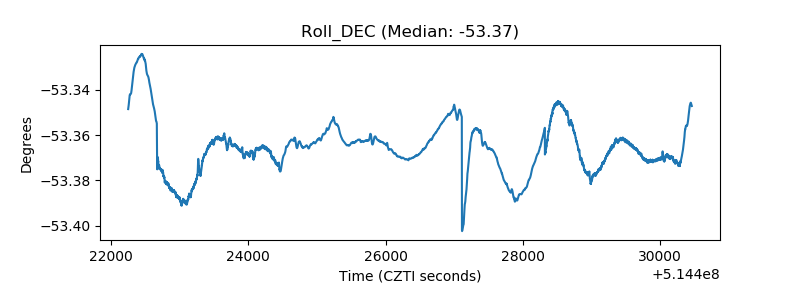 |
| _Roll_RA | 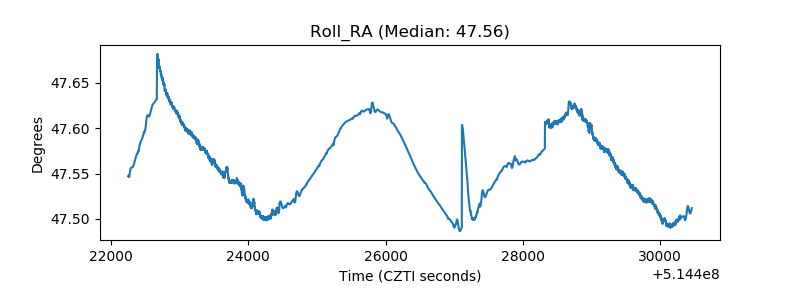 |
| Veto Counter | 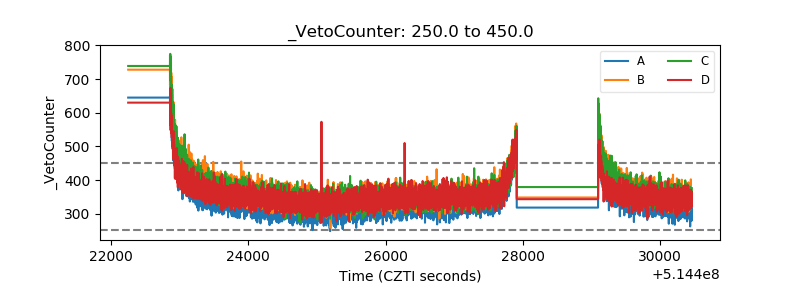 |