| Param | Original file | Final file |
|---|---|---|
| Filename | modeM0/AS1A14_083T10_9000006566_57148cztM0_level2.fits | modeM0/AS1A14_083T10_9000006566_57148cztM0_level2_quad_clean.evt |
| Size (bytes) | 541,031,040 | 90,357,120 |
| Size | 516.0 MB | 86.2 MB |
| Events in quadrant A | 2,888,085 | 651,938 |
| Events in quadrant B | 4,609,445 | 638,313 |
| Events in quadrant C | 7,576,445 | 413,253 |
| Events in quadrant D | 4,433,515 | 567,143 |
| Mode M9 | |||
|---|---|---|---|
| Quadrant | BADHDUFLAG | Total packets | Discarded packets |
| A | 0 | 16 | 0 |
| B | 0 | 17 | 0 |
| C | 0 | 17 | 0 |
| D | 0 | 17 | 0 |
| Mode M0 | |||
|---|---|---|---|
| Quadrant | BADHDUFLAG | Total packets | Discarded packets |
| A | 0 | 13671 | 3 |
| B | 0 | 18371 | 2 |
| C | 0 | 27132 | 2 |
| D | 0 | 17555 | 2 |
| Mode SS | |||
|---|---|---|---|
| Quadrant | BADHDUFLAG | Total packets | Discarded packets |
| A | 0 | 136 | 0 |
| B | 0 | 136 | 0 |
| C | 0 | 136 | 0 |
| D | 0 | 136 | 0 |
| Quadrant | Total seconds | Saturated seconds | Saturation percentage |
|---|---|---|---|
| A | 6673 | 57 | 0.854189% |
| B | 6673 | 704 | 10.549978% |
| C | 6673 | 2384 | 35.726060% |
| D | 6673 | 227 | 3.401768% |
Noise dominated data is calculated using 1-second bins in cleaned event files. If a bin has >2000 counts, and if more than 50% of those come from <1% of pixels, then it is considered to be noise-dominated and hence unusable.
| Quadrant | # 1 sec bins | Bins with >0 counts | Bins with >2000 counts | High rate bins dominated by noise | Noise dominated (total time) | Noise dominated (detector-on time) | Marked lightcurve |
|---|---|---|---|---|---|---|---|
| A | 7668 | 6674 | 3 | 3 | 0.04% | 0.04% | 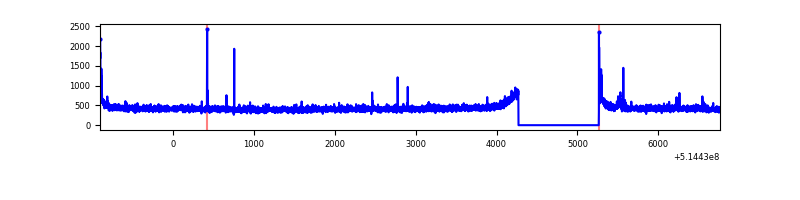 |
| B | 7668 | 6674 | 476 | 476 | 6.21% | 7.13% | 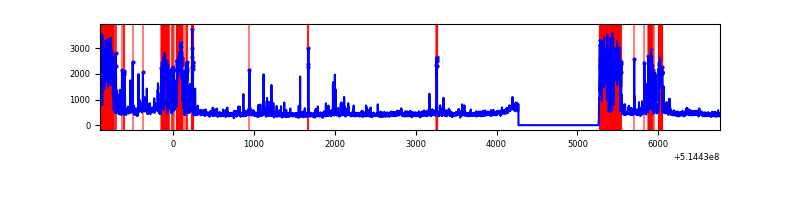 |
| C | 7668 | 6674 | 1494 | 1494 | 19.48% | 22.39% | 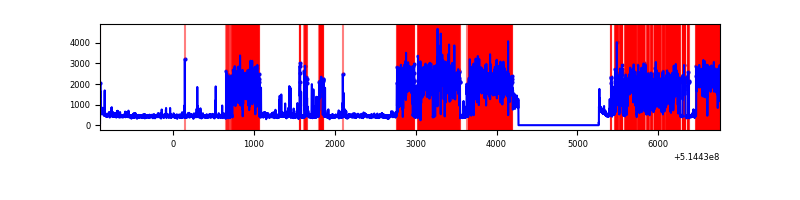 |
| D | 7668 | 6674 | 188 | 188 | 2.45% | 2.82% | 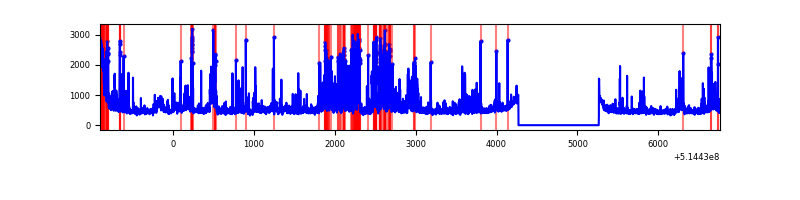 |
Top three noisy pixels from each quadrant. If the there are fewer than three noisy pixels in the level2.evt file, extra rows are filled as -1
| Pixel properties | Quadrant properties | ||||||
|---|---|---|---|---|---|---|---|
| Quadrant | DetID | PixID | Counts | Sigma | Mean | Median | Sigma |
| A | 3 | 14 | 18362 | 99.43 | 731 | 713 | 177.5 |
| A | 8 | 6 | 9789 | 51.13 | 731 | 713 | 177.5 |
| A | 13 | 254 | 9469 | 49.33 | 731 | 713 | 177.5 |
| B | 10 | 16 | 1590187 | 10928.82 | 680 | 655 | 145.4 |
| B | 10 | 247 | 193528 | 1326.1 | 680 | 655 | 145.4 |
| B | 0 | 63 | 54070 | 367.25 | 680 | 655 | 145.4 |
| C | 15 | 198 | 4762295 | 30042.3 | 583 | 576 | 158.5 |
| C | 14 | 254 | 210859 | 1326.7 | 583 | 576 | 158.5 |
| C | 12 | 252 | 109936 | 689.96 | 583 | 576 | 158.5 |
| D | 12 | 33 | 838825 | 4178.17 | 701 | 665 | 200.6 |
| D | 15 | 142 | 256153 | 1273.59 | 701 | 665 | 200.6 |
| D | 14 | 49 | 133651 | 662.93 | 701 | 665 | 200.6 |
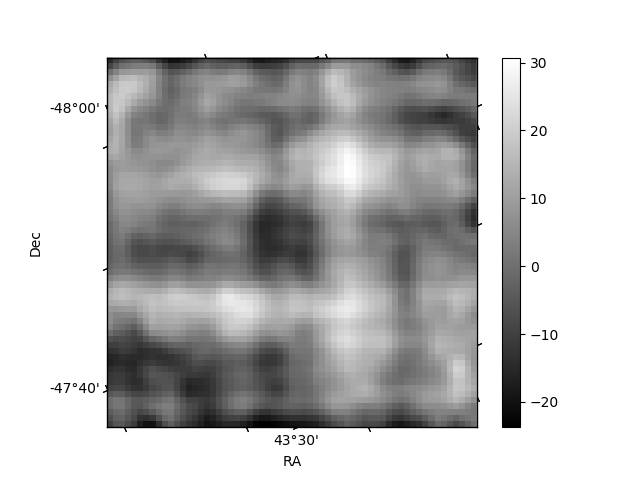
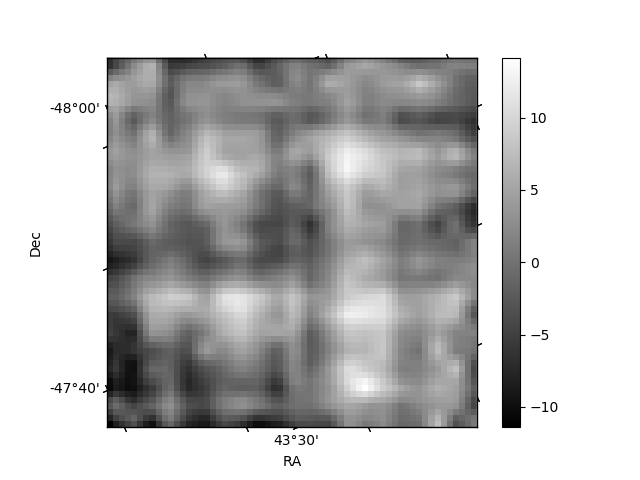
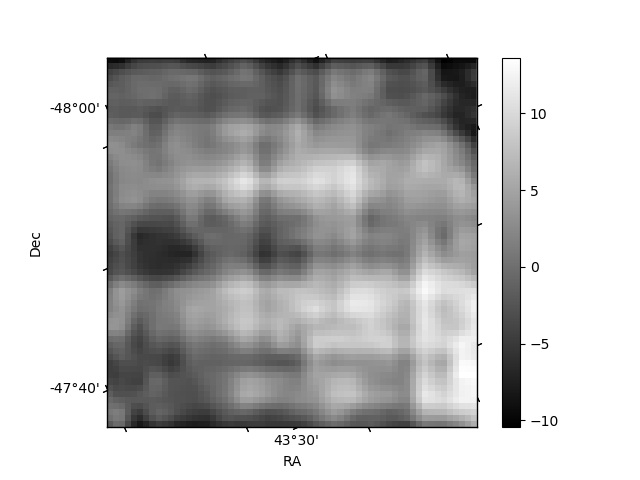
Histogram calculated using DETX and DETY for each event in the final _common_clean file
| Quadrant A | 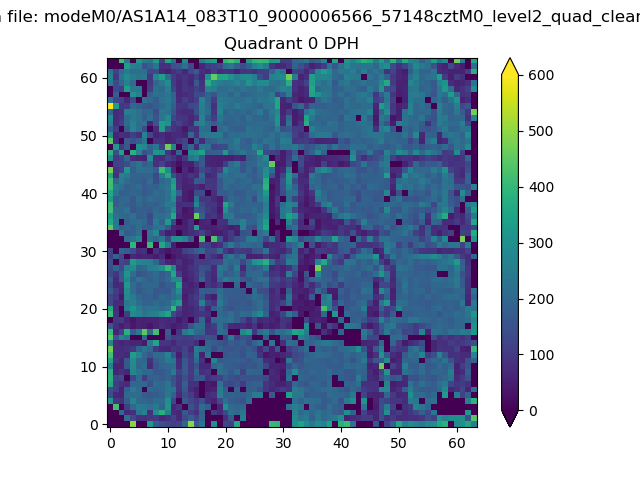 |
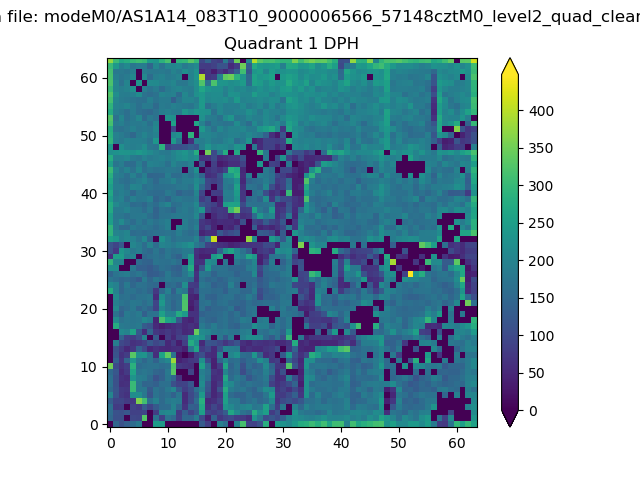 |
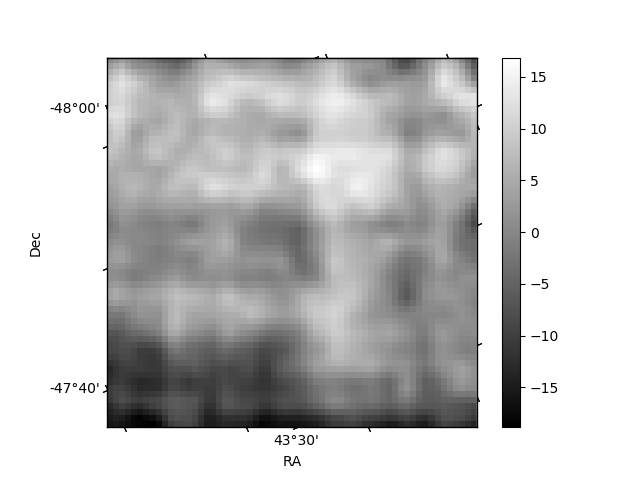
Quadrant B |
|---|---|---|---|
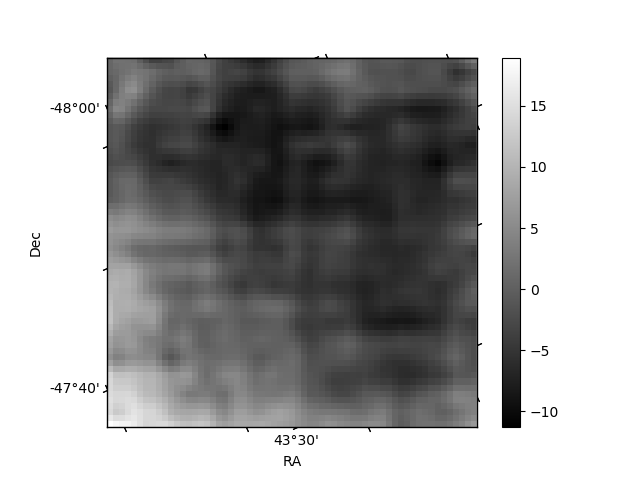
| Quadrant D | 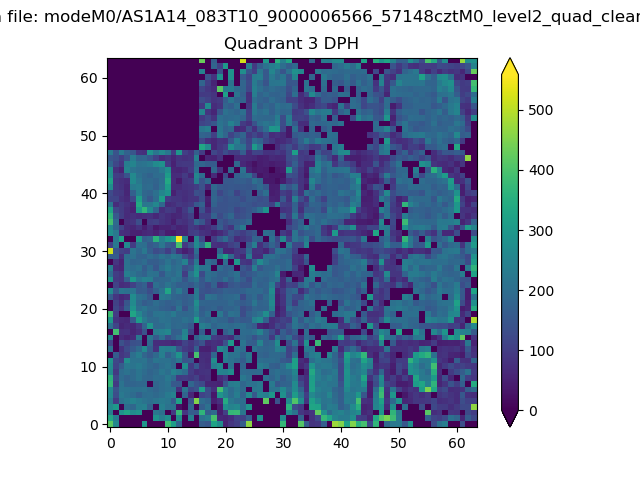 |
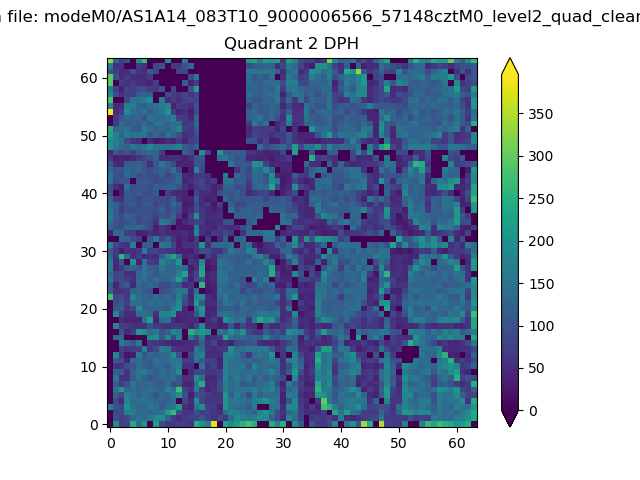 |
Quadrant C |
| Plot type | Count rate plots | Images |
|---|---|---|
| Comparison with Poisson distribution Blue bars denote a histogram of data divided into 1 sec bins. Red curve is a Poisson curve with rate = median count rate of data. |
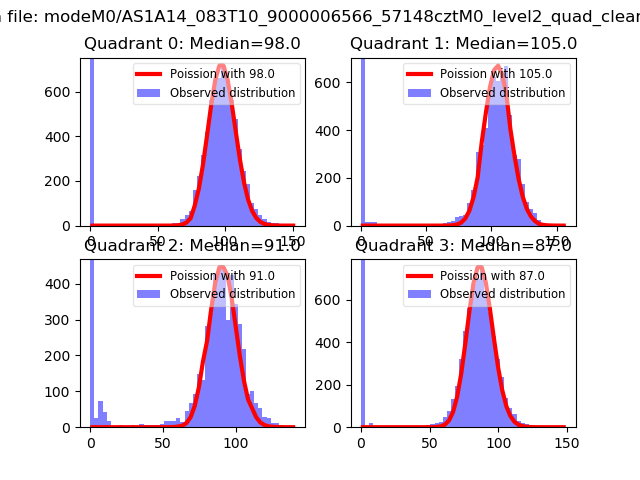 |
 |
| Quadrant-wise count rates Data is divided into 100 sec bins |
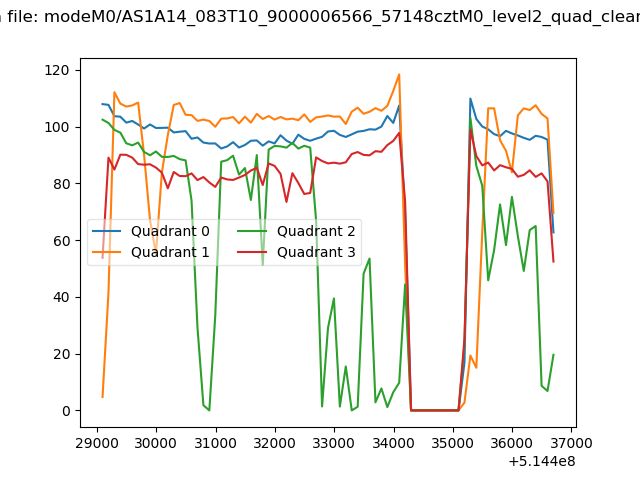 |
|
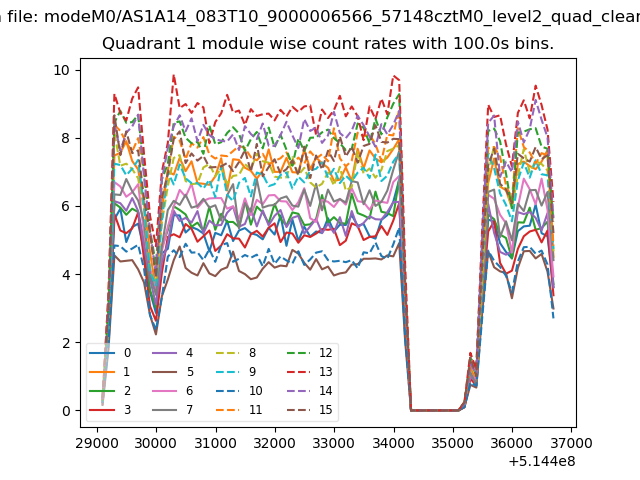
| Module-wise count rates for Quadrant A Data is divided into 100 sec bins |
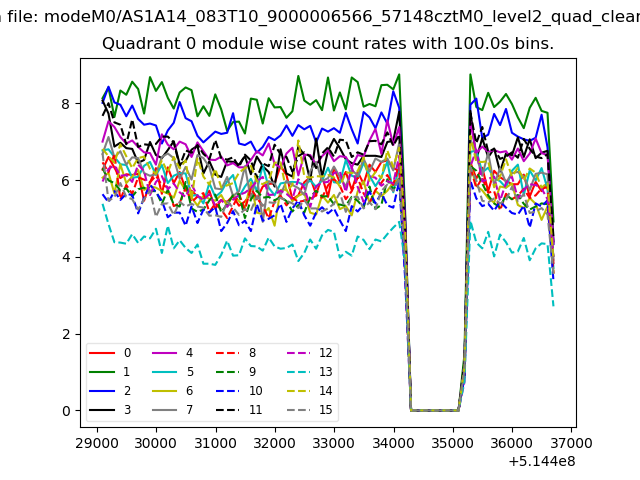 |
 |
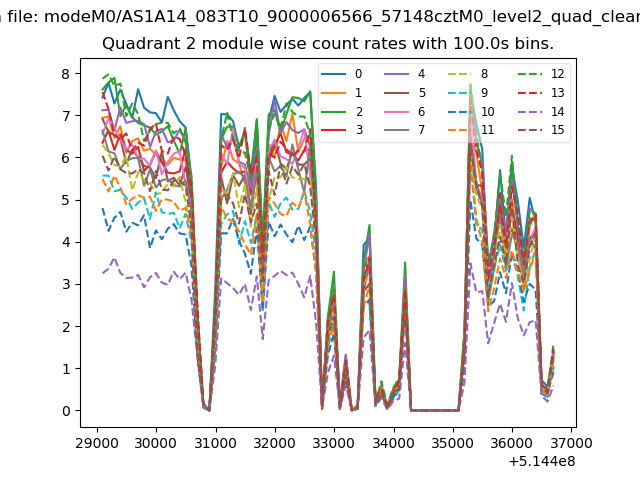
| Module-wise count rates for Quadrant B Data is divided into 100 sec bins |
 |
 |
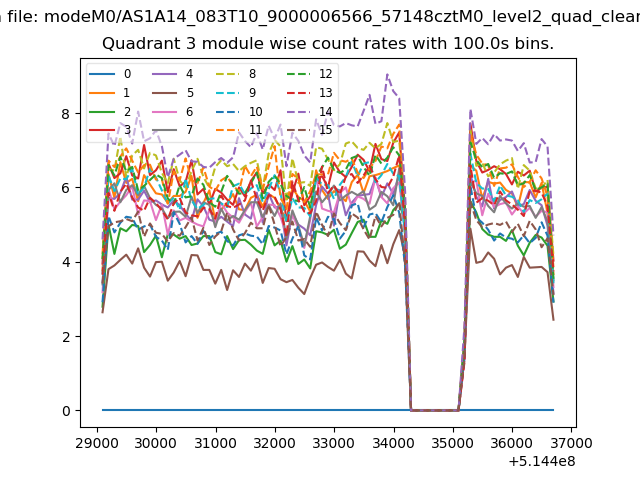
| Module-wise count rates for Quadrant C Data is divided into 100 sec bins |
 |
 |
| Module-wise count rates for Quadrant D Data is divided into 100 sec bins |
 |
 |
| Parameter | Plot |
|---|---|
| CZT HV Monitor | 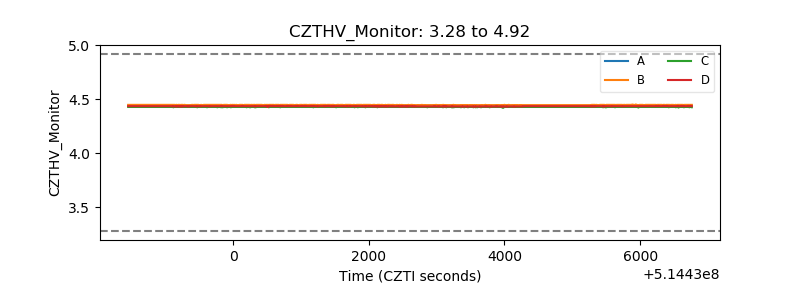 |
| D_VDD | 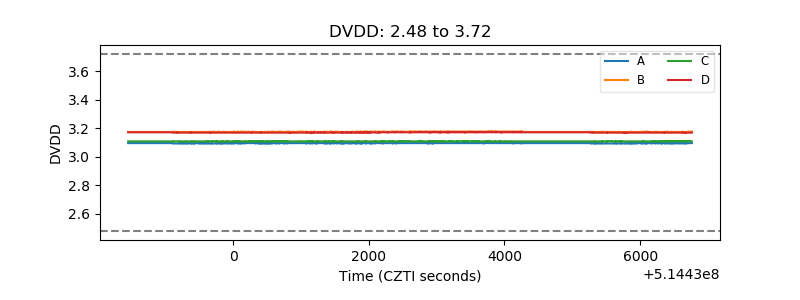 |
| Temperature 1 | 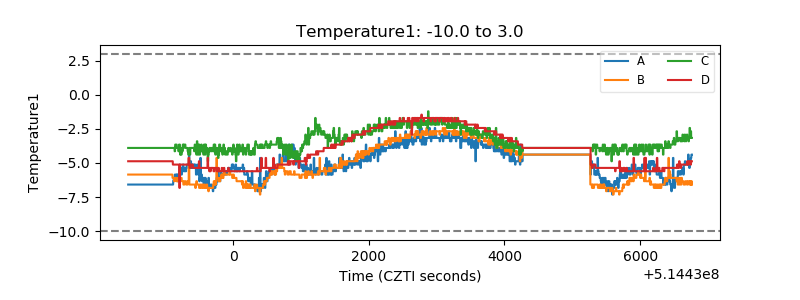 |
| Veto HV Monitor | 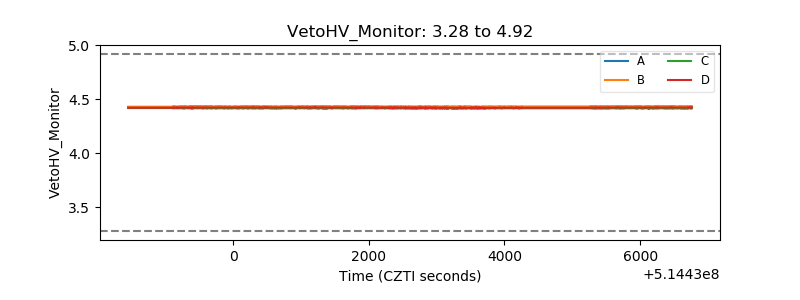 |
| Veto LLD | 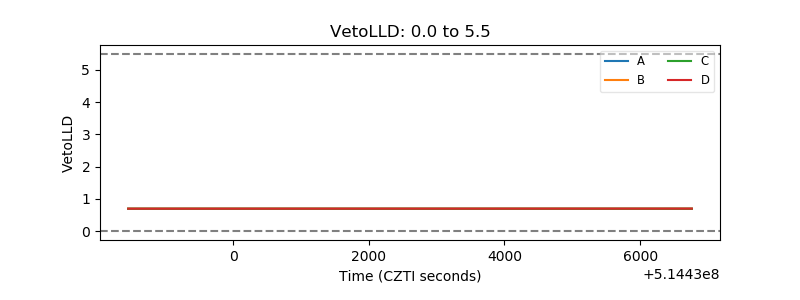 |
| Alpha Counter | 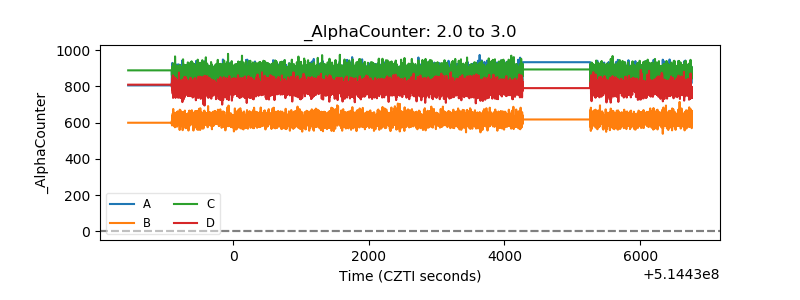 |
| _CPM_Rate | 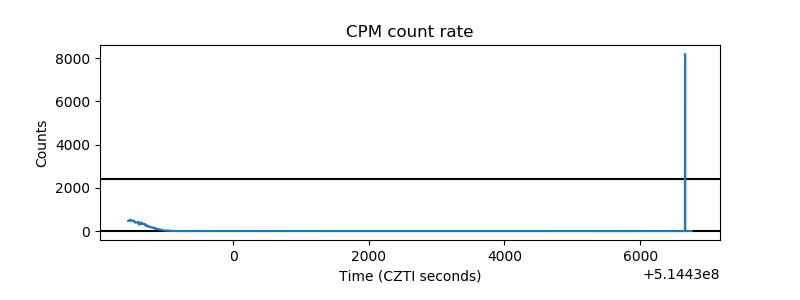 |
| CZT Counter | 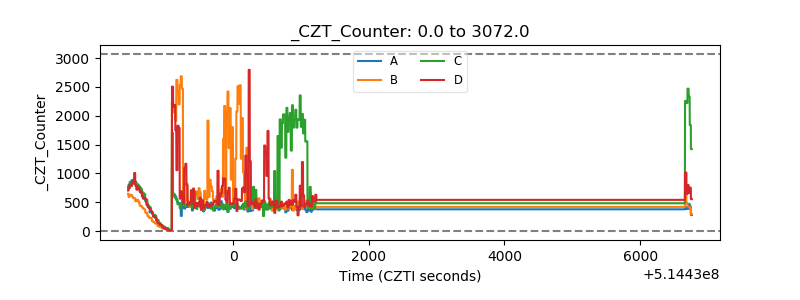 |
| +2.5 Volts monitor | 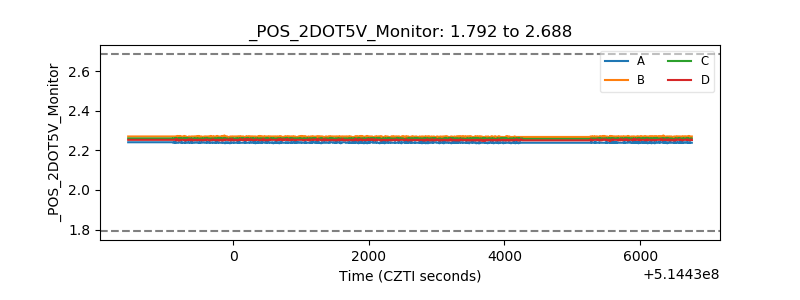 |
| +5 Volts monitor | 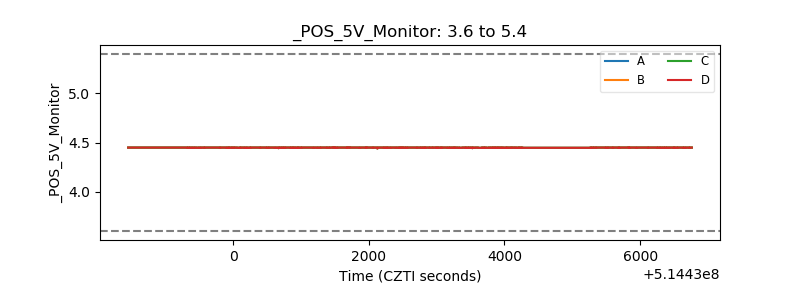 |
| _ROLL_ROT | 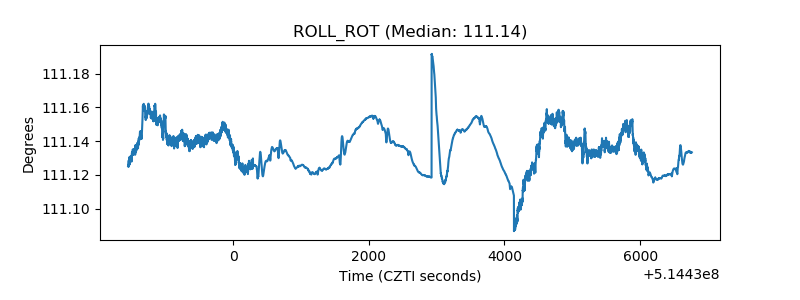 |
| _Roll_DEC | 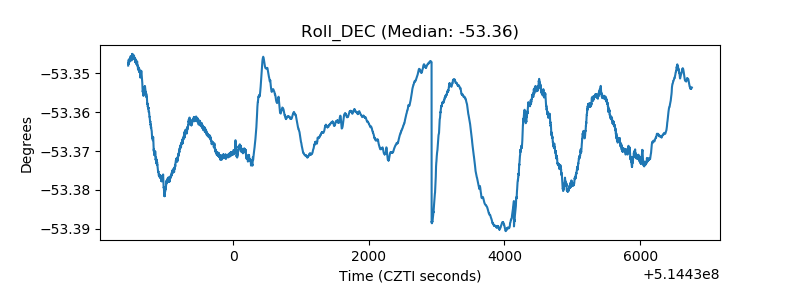 |
| _Roll_RA | 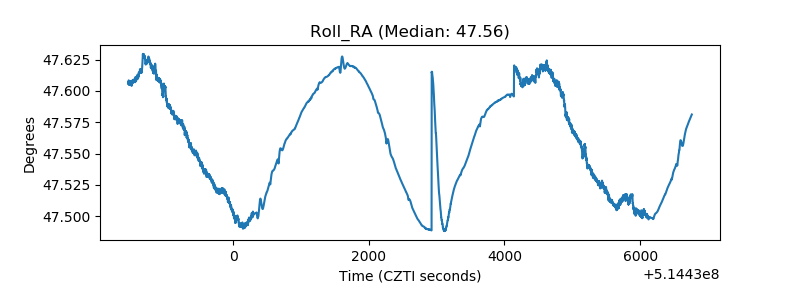 |
| Veto Counter | 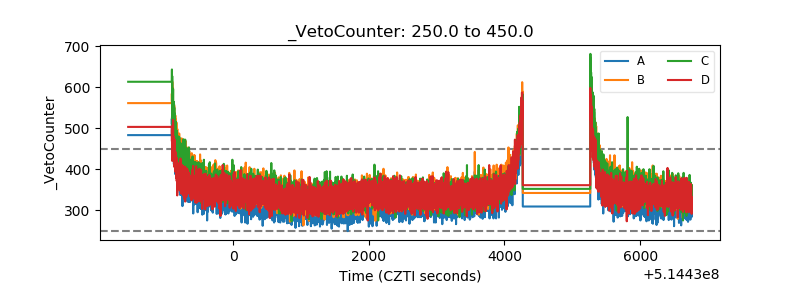 |