| Param | Original file | Final file |
|---|---|---|
| Filename | modeM0/AS1A14_083T10_9000006566_57149cztM0_level2.fits | modeM0/AS1A14_083T10_9000006566_57149cztM0_level2_quad_clean.evt |
| Size (bytes) | 709,168,320 | 90,895,680 |
| Size | 676.3 MB | 86.7 MB |
| Events in quadrant A | 3,069,904 | 681,371 |
| Events in quadrant B | 4,371,724 | 688,303 |
| Events in quadrant C | 12,955,734 | 296,899 |
| Events in quadrant D | 5,303,429 | 592,378 |
| Mode M9 | |||
|---|---|---|---|
| Quadrant | BADHDUFLAG | Total packets | Discarded packets |
| A | 0 | 14 | 0 |
| B | 0 | 15 | 0 |
| C | 0 | 15 | 0 |
| D | 0 | 15 | 0 |
| Mode M0 | |||
|---|---|---|---|
| Quadrant | BADHDUFLAG | Total packets | Discarded packets |
| A | 0 | 14562 | 2 |
| B | 0 | 17851 | 2 |
| C | 0 | 43378 | 2 |
| D | 0 | 20495 | 2 |
| Mode SS | |||
|---|---|---|---|
| Quadrant | BADHDUFLAG | Total packets | Discarded packets |
| A | 0 | 144 | 0 |
| B | 0 | 144 | 0 |
| C | 0 | 144 | 0 |
| D | 0 | 144 | 0 |
| Quadrant | Total seconds | Saturated seconds | Saturation percentage |
|---|---|---|---|
| A | 7080 | 101 | 1.426554% |
| B | 7080 | 501 | 7.076271% |
| C | 7080 | 4325 | 61.087571% |
| D | 7080 | 421 | 5.946328% |
Noise dominated data is calculated using 1-second bins in cleaned event files. If a bin has >2000 counts, and if more than 50% of those come from <1% of pixels, then it is considered to be noise-dominated and hence unusable.
| Quadrant | # 1 sec bins | Bins with >0 counts | Bins with >2000 counts | High rate bins dominated by noise | Noise dominated (total time) | Noise dominated (detector-on time) | Marked lightcurve |
|---|---|---|---|---|---|---|---|
| A | 7730 | 7082 | 2 | 2 | 0.03% | 0.03% | 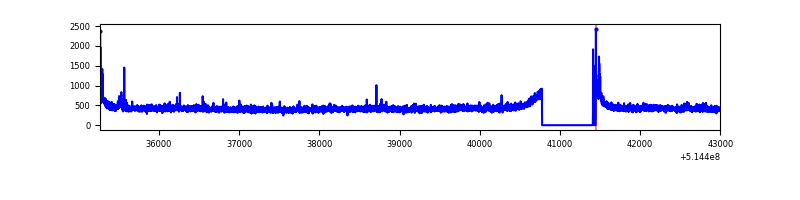 |
| B | 7730 | 7082 | 262 | 262 | 3.39% | 3.70% | 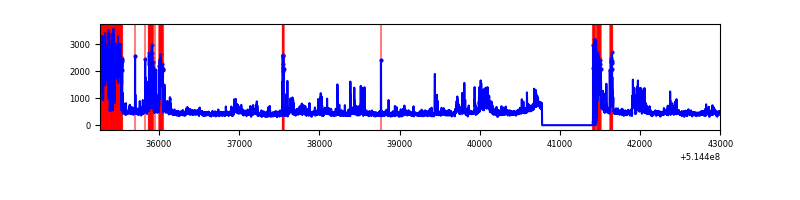 |
| C | 7730 | 7082 | 3467 | 3467 | 44.85% | 48.96% | 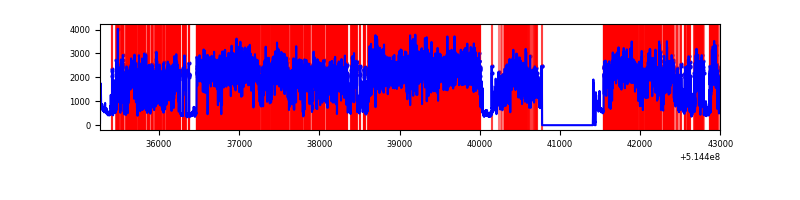 |
| D | 7730 | 7082 | 299 | 299 | 3.87% | 4.22% | 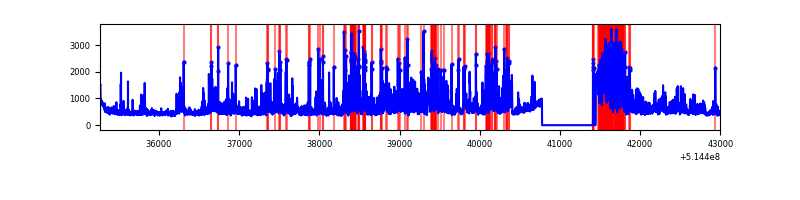 |
Top three noisy pixels from each quadrant. If the there are fewer than three noisy pixels in the level2.evt file, extra rows are filled as -1
| Pixel properties | Quadrant properties | ||||||
|---|---|---|---|---|---|---|---|
| Quadrant | DetID | PixID | Counts | Sigma | Mean | Median | Sigma |
| A | 4 | 207 | 25900 | 133.47 | 775 | 756 | 188.4 |
| A | 3 | 14 | 15305 | 77.23 | 775 | 756 | 188.4 |
| A | 13 | 254 | 10787 | 53.25 | 775 | 756 | 188.4 |
| B | 10 | 16 | 1201274 | 7629.2 | 737 | 708 | 157.4 |
| B | 0 | 213 | 58952 | 370.12 | 737 | 708 | 157.4 |
| B | 10 | 247 | 49188 | 308.07 | 737 | 708 | 157.4 |
| C | 15 | 198 | 10311933 | 67648.6 | 562 | 556 | 152.4 |
| C | 9 | 38 | 170483 | 1114.82 | 562 | 556 | 152.4 |
| C | 12 | 252 | 59485 | 386.61 | 562 | 556 | 152.4 |
| D | 12 | 33 | 1638386 | 7828.76 | 740 | 708 | 209.2 |
| D | 15 | 142 | 201328 | 959.04 | 740 | 708 | 209.2 |
| D | 2 | 120 | 197316 | 939.87 | 740 | 708 | 209.2 |
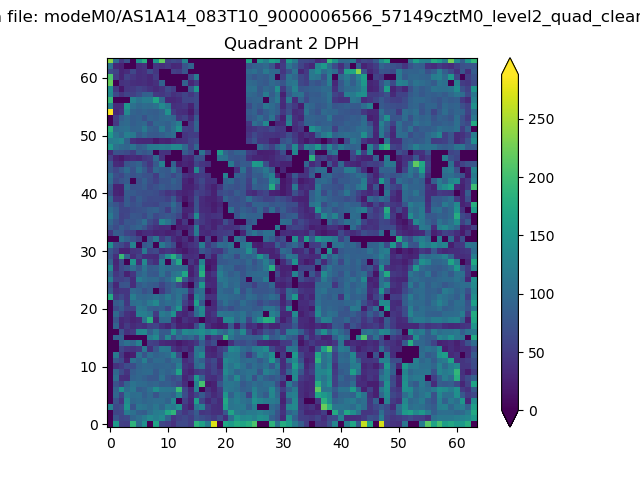
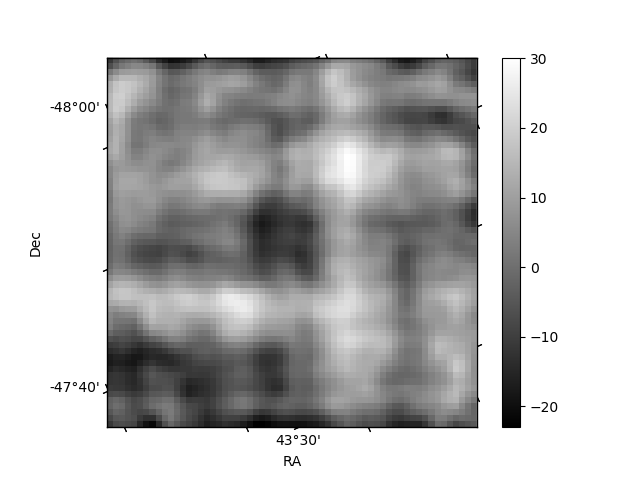
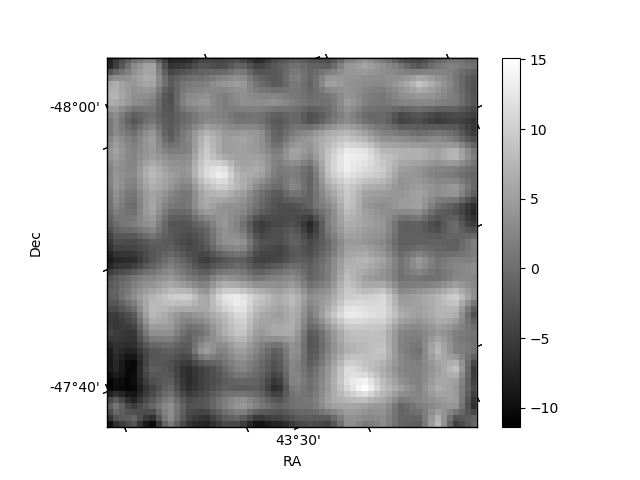
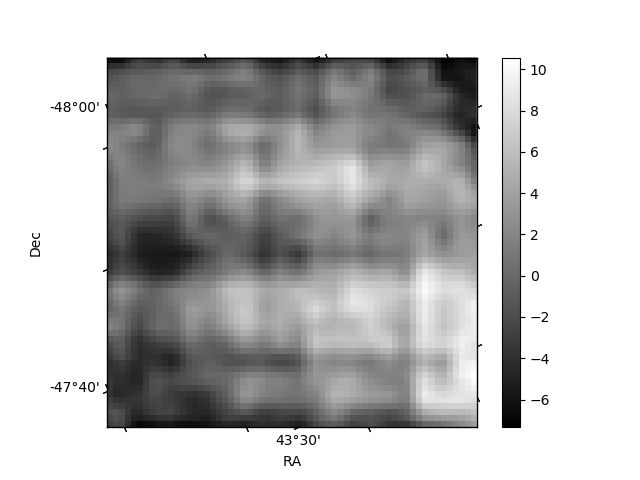
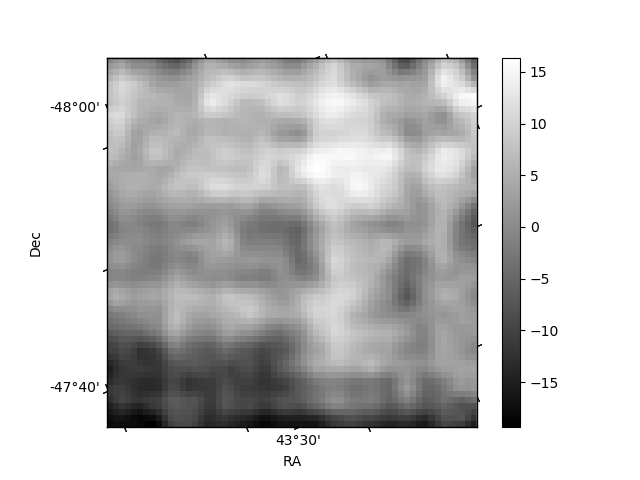
Histogram calculated using DETX and DETY for each event in the final _common_clean file
| Quadrant A | 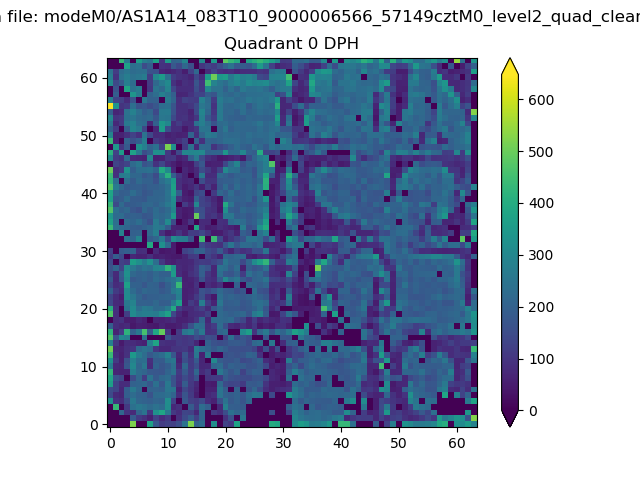 |
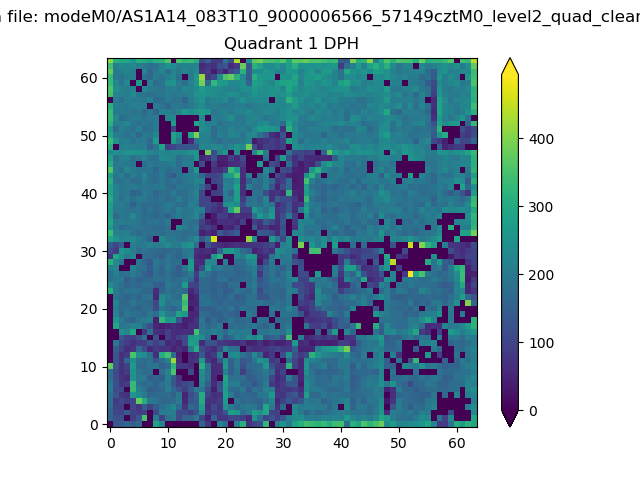 |
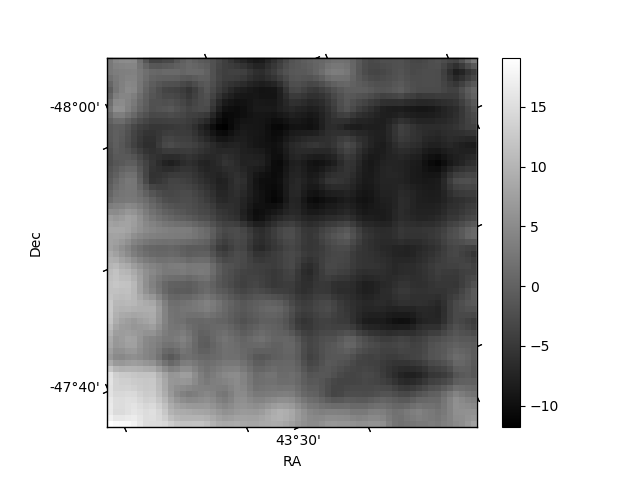
Quadrant B |
|---|---|---|---|
| Quadrant D | 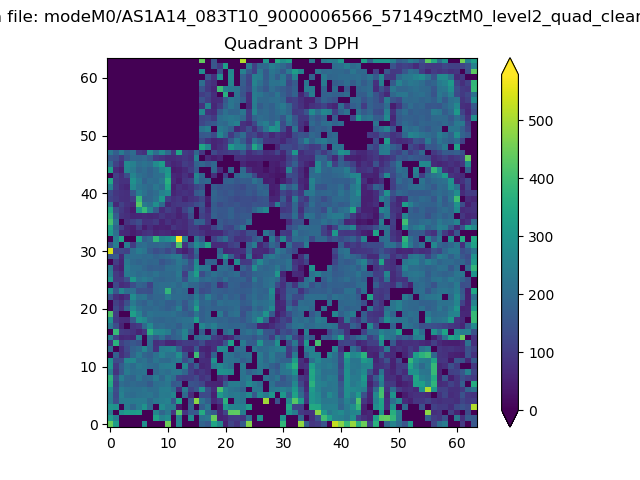 |
 |
Quadrant C |
| Plot type | Count rate plots | Images |
|---|---|---|
| Comparison with Poisson distribution Blue bars denote a histogram of data divided into 1 sec bins. Red curve is a Poisson curve with rate = median count rate of data. |
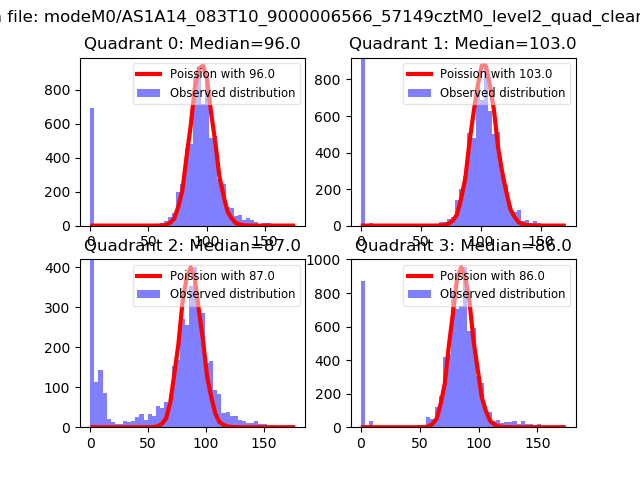 |
 |
| Quadrant-wise count rates Data is divided into 100 sec bins |
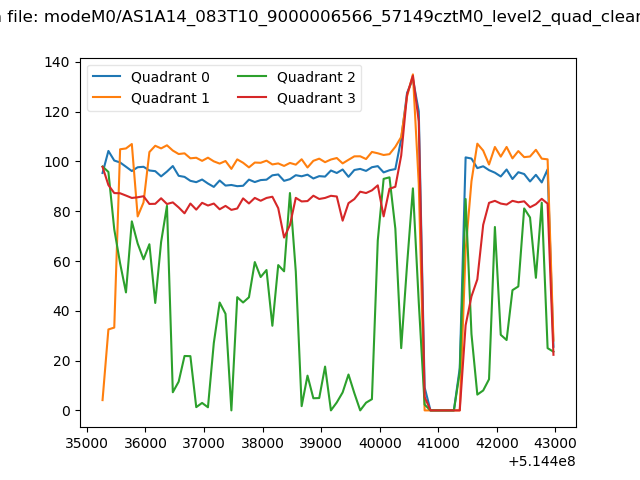 |
|
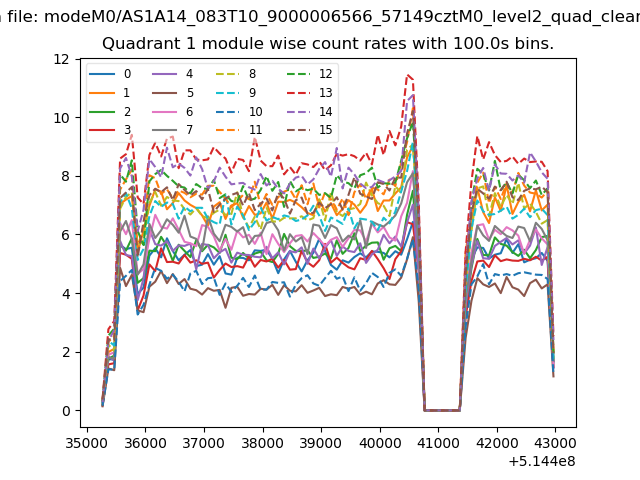
| Module-wise count rates for Quadrant A Data is divided into 100 sec bins |
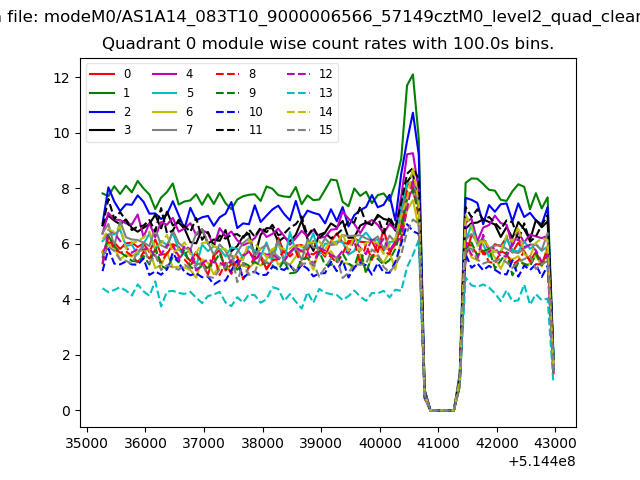 |
 |
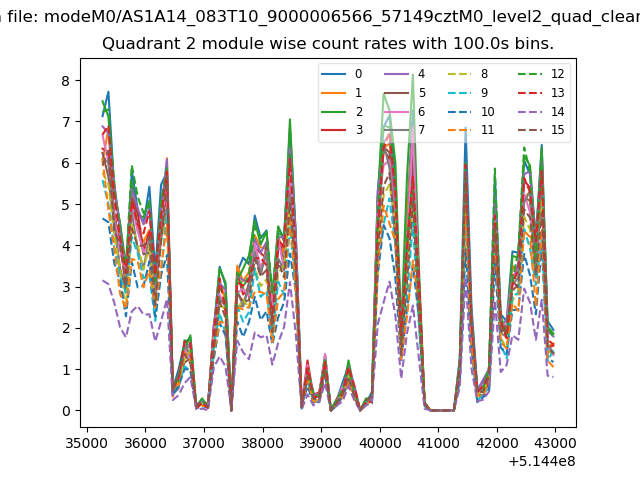
| Module-wise count rates for Quadrant B Data is divided into 100 sec bins |
 |
 |
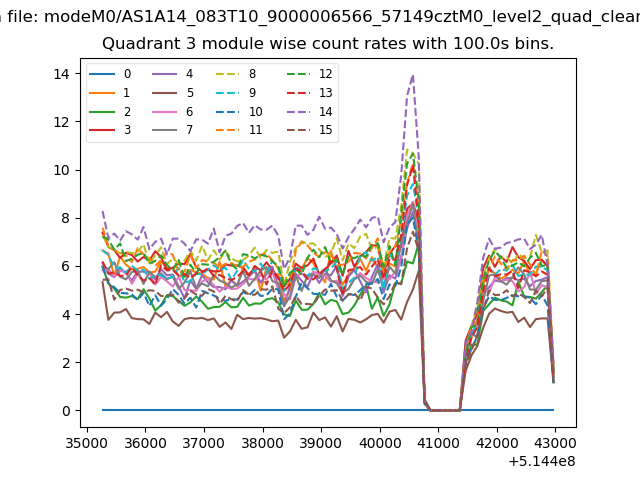
| Module-wise count rates for Quadrant C Data is divided into 100 sec bins |
 |
 |
| Module-wise count rates for Quadrant D Data is divided into 100 sec bins |
 |
 |
| Parameter | Plot |
|---|---|
| CZT HV Monitor | 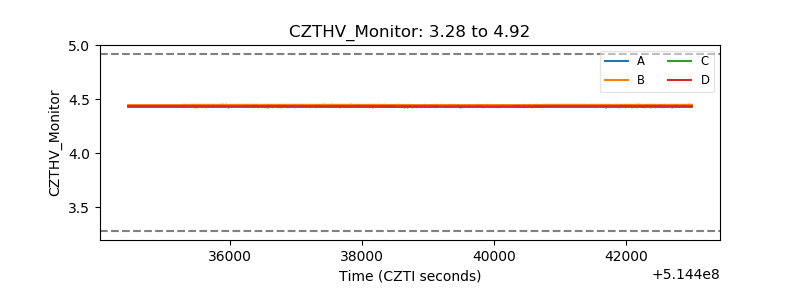 |
| D_VDD | 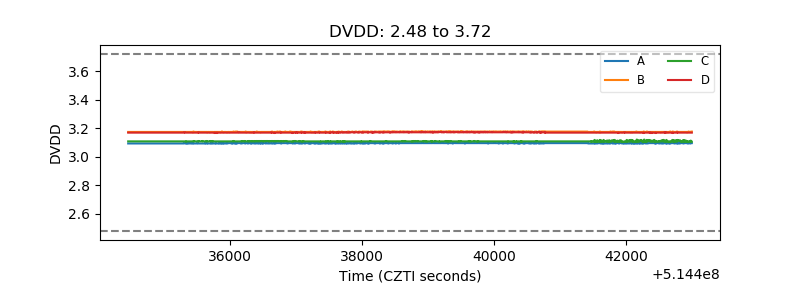 |
| Temperature 1 | 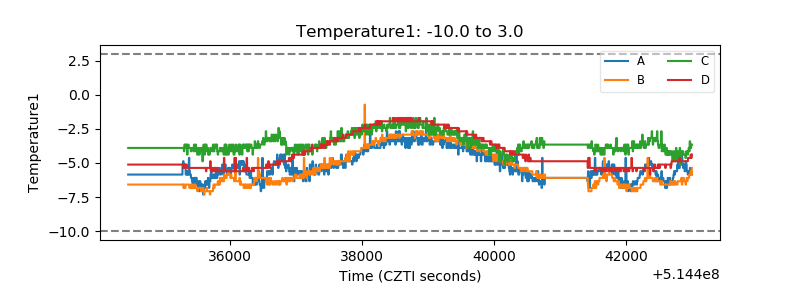 |
| Veto HV Monitor | 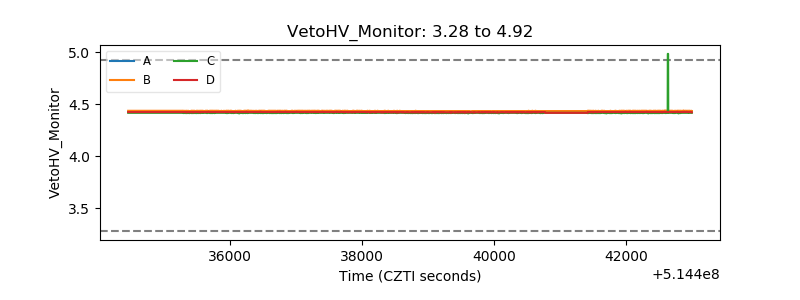 |
| Veto LLD | 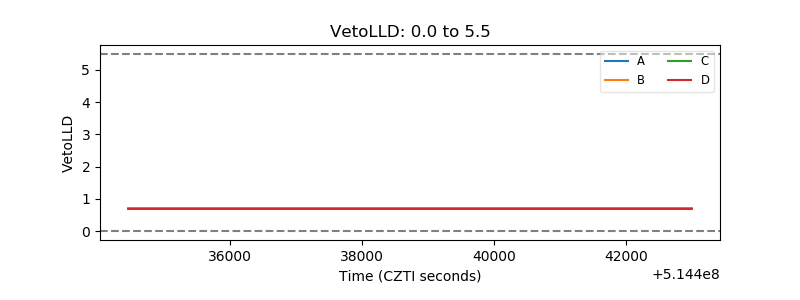 |
| Alpha Counter | 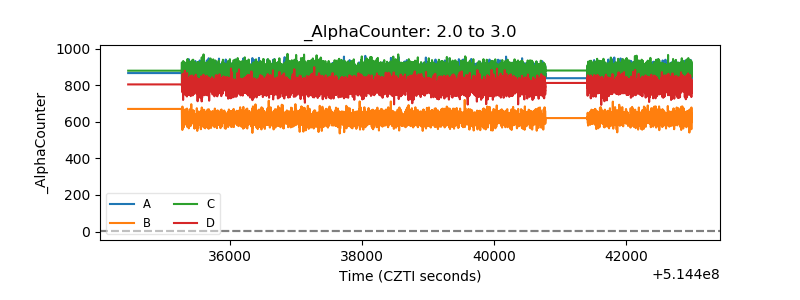 |
| _CPM_Rate | 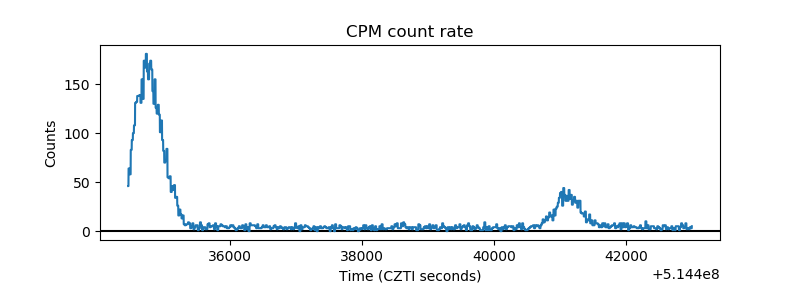 |
| CZT Counter | 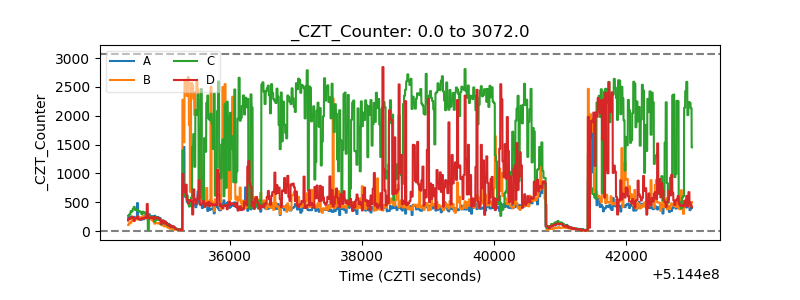 |
| +2.5 Volts monitor |  |
| +5 Volts monitor |  |
| _ROLL_ROT | 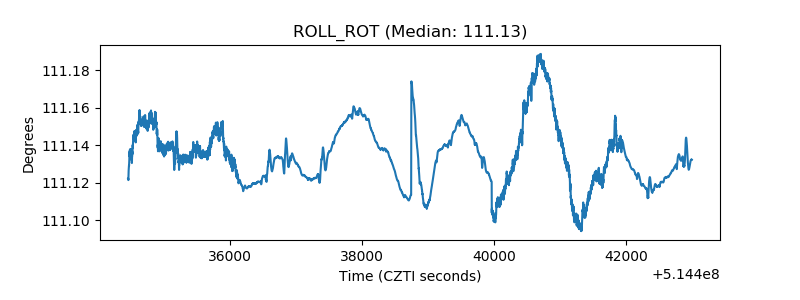 |
| _Roll_DEC | 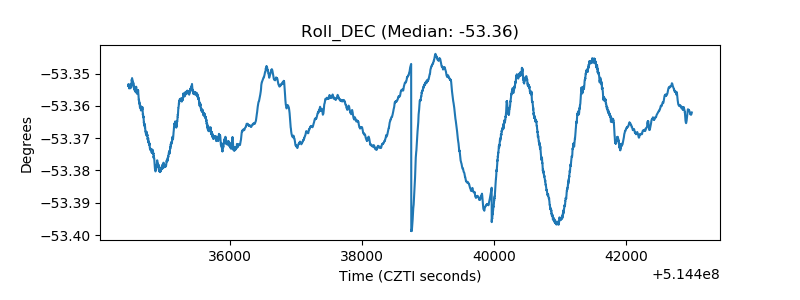 |
| _Roll_RA | 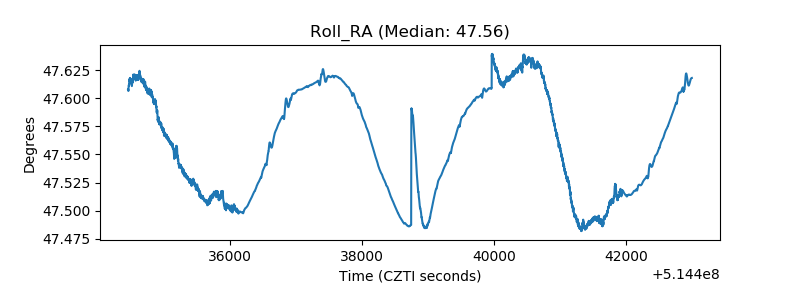 |
| Veto Counter | 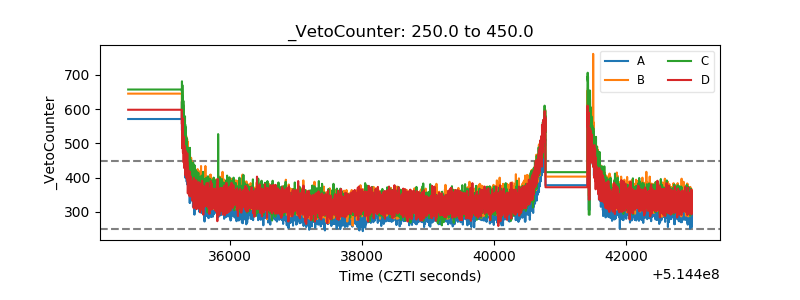 |