| Param | Original file | Final file |
|---|---|---|
| Filename | modeM0/AS1A14_083T10_9000006566_57150cztM0_level2.fits | modeM0/AS1A14_083T10_9000006566_57150cztM0_level2_quad_clean.evt |
| Size (bytes) | 869,785,920 | 92,952,000 |
| Size | 829.5 MB | 88.6 MB |
| Events in quadrant A | 3,270,657 | 725,888 |
| Events in quadrant B | 3,664,807 | 776,818 |
| Events in quadrant C | 14,817,527 | 277,756 |
| Events in quadrant D | 9,855,218 | 505,633 |
| Mode M0 | |||
|---|---|---|---|
| Quadrant | BADHDUFLAG | Total packets | Discarded packets |
| A | 0 | 15570 | 0 |
| B | 0 | 16420 | 0 |
| C | 0 | 49190 | 0 |
| D | 0 | 34497 | 0 |
| Mode SS | |||
|---|---|---|---|
| Quadrant | BADHDUFLAG | Total packets | Discarded packets |
| A | 0 | 152 | 0 |
| B | 0 | 152 | 0 |
| C | 0 | 152 | 0 |
| D | 0 | 152 | 0 |
| Quadrant | Total seconds | Saturated seconds | Saturation percentage |
|---|---|---|---|
| A | 7588 | 77 | 1.014760% |
| B | 7589 | 187 | 2.464093% |
| C | 7589 | 4894 | 64.488075% |
| D | 7589 | 2055 | 27.078666% |
Noise dominated data is calculated using 1-second bins in cleaned event files. If a bin has >2000 counts, and if more than 50% of those come from <1% of pixels, then it is considered to be noise-dominated and hence unusable.
| Quadrant | # 1 sec bins | Bins with >0 counts | Bins with >2000 counts | High rate bins dominated by noise | Noise dominated (total time) | Noise dominated (detector-on time) | Marked lightcurve |
|---|---|---|---|---|---|---|---|
| A | 7588 | 7588 | 0 | 0 | 0.00% | 0.00% | 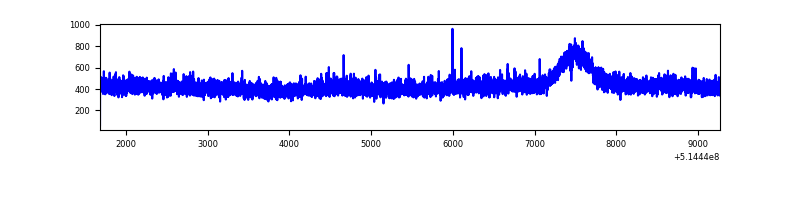 |
| B | 7589 | 7589 | 13 | 13 | 0.17% | 0.17% | 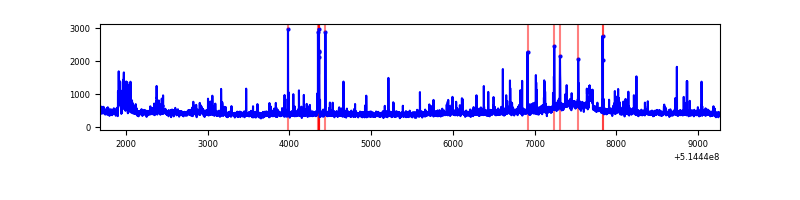 |
| C | 7589 | 7589 | 4114 | 4114 | 54.21% | 54.21% | 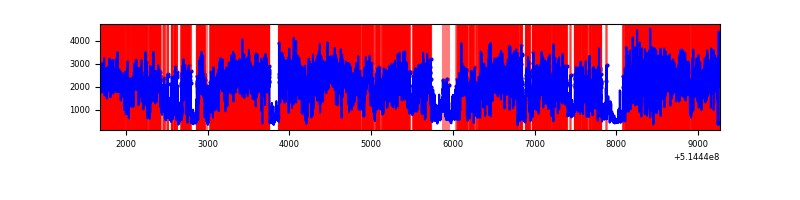 |
| D | 7589 | 7589 | 1866 | 1866 | 24.59% | 24.59% | 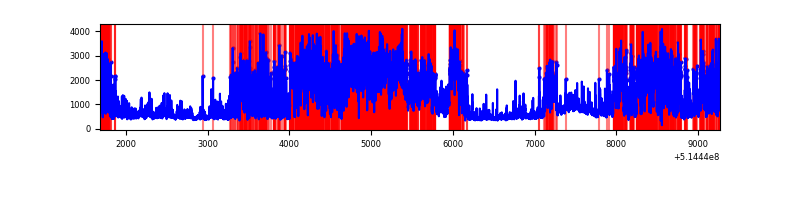 |
Top three noisy pixels from each quadrant. If the there are fewer than three noisy pixels in the level2.evt file, extra rows are filled as -1
| Pixel properties | Quadrant properties | ||||||
|---|---|---|---|---|---|---|---|
| Quadrant | DetID | PixID | Counts | Sigma | Mean | Median | Sigma |
| A | 8 | 6 | 19708 | 92.02 | 837 | 815 | 205.3 |
| A | 13 | 254 | 12006 | 54.51 | 837 | 815 | 205.3 |
| A | 3 | 137 | 10362 | 46.5 | 837 | 815 | 205.3 |
| B | 10 | 16 | 116554 | 659.95 | 823 | 792 | 175.4 |
| B | 10 | 247 | 100945 | 570.97 | 823 | 792 | 175.4 |
| B | 4 | 201 | 28938 | 160.46 | 823 | 792 | 175.4 |
| C | 15 | 198 | 11836432 | 78691.78 | 555 | 549 | 150.4 |
| C | 9 | 38 | 559998 | 3719.54 | 555 | 549 | 150.4 |
| C | 13 | 3 | 83736 | 553.08 | 555 | 549 | 150.4 |
| D | 12 | 33 | 5800690 | 28286.78 | 727 | 694 | 205.0 |
| D | 2 | 249 | 390975 | 1903.41 | 727 | 694 | 205.0 |
| D | 8 | 240 | 197066 | 957.71 | 727 | 694 | 205.0 |
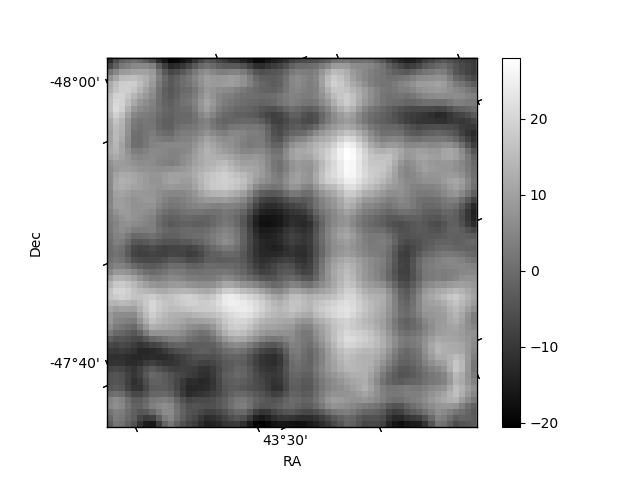
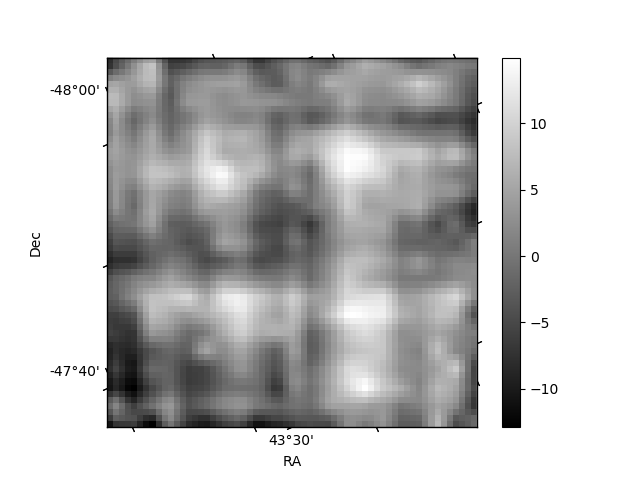
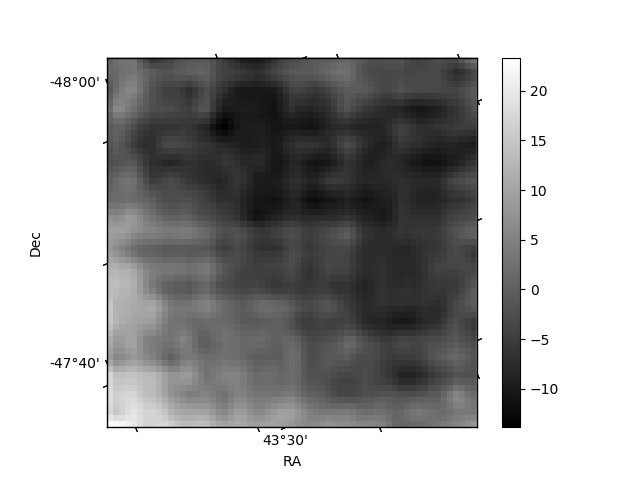
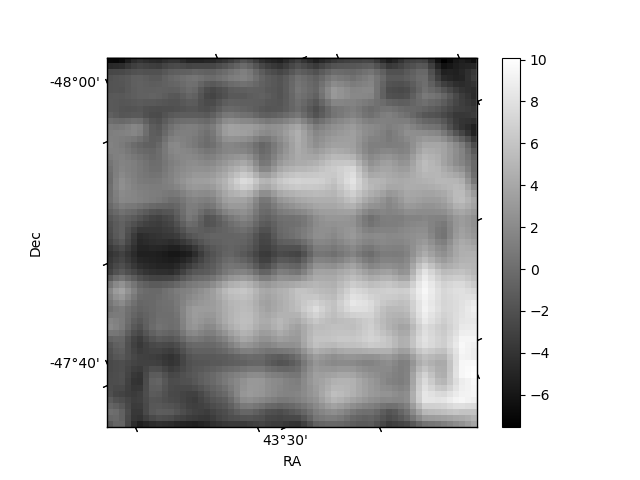
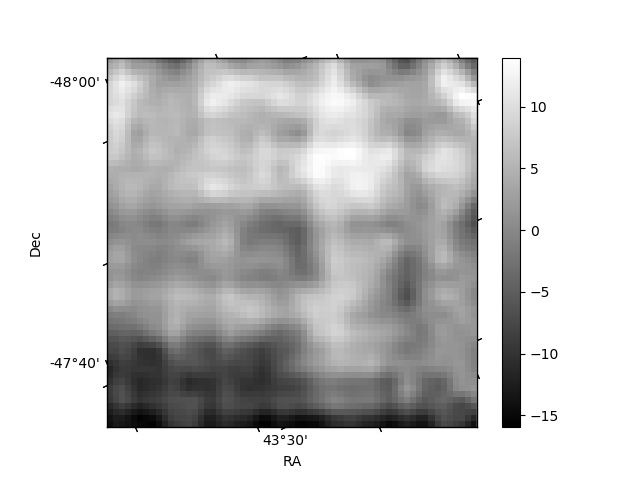
Histogram calculated using DETX and DETY for each event in the final _common_clean file
| Quadrant A | 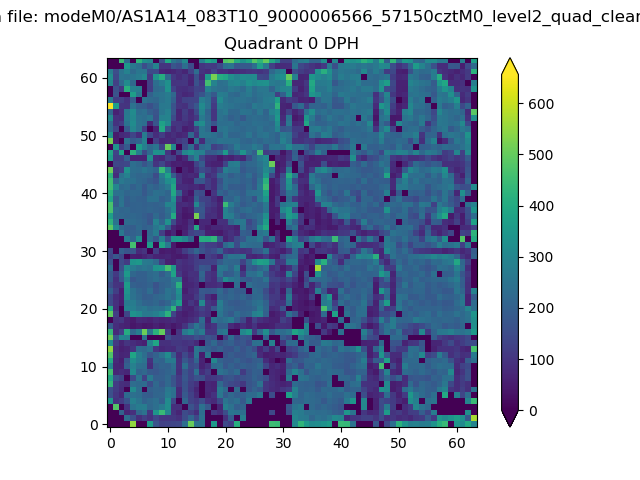 |
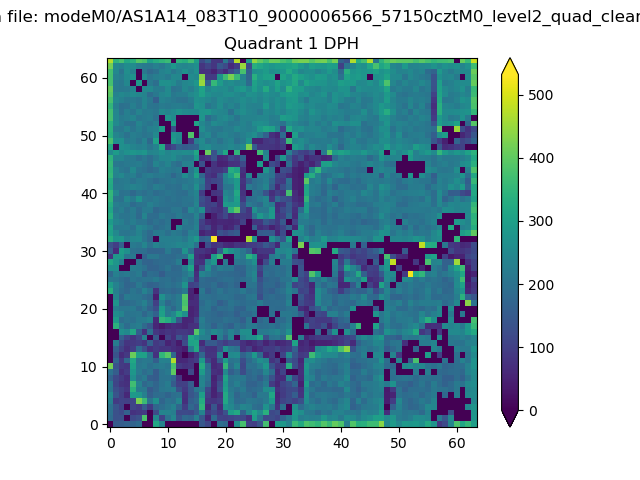 |
Quadrant B |
|---|---|---|---|
| Quadrant D | 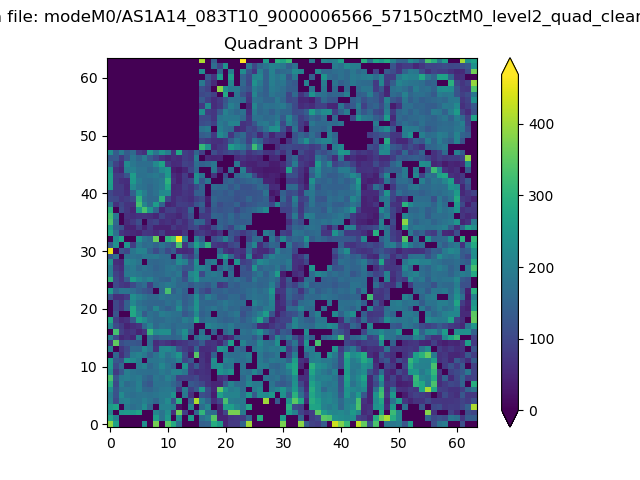 |
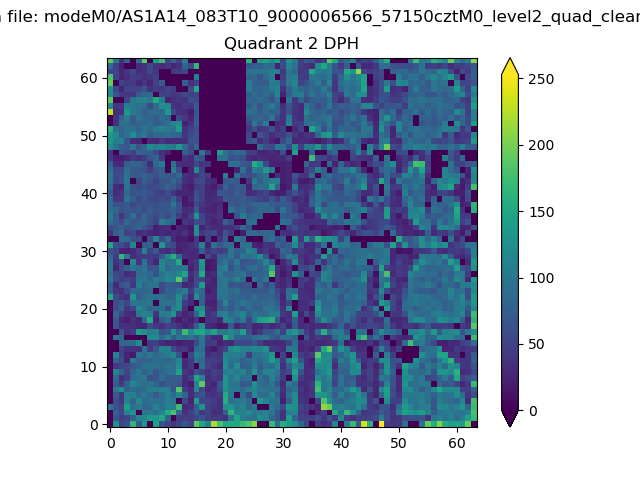 |
Quadrant C |
| Plot type | Count rate plots | Images |
|---|---|---|
| Comparison with Poisson distribution Blue bars denote a histogram of data divided into 1 sec bins. Red curve is a Poisson curve with rate = median count rate of data. |
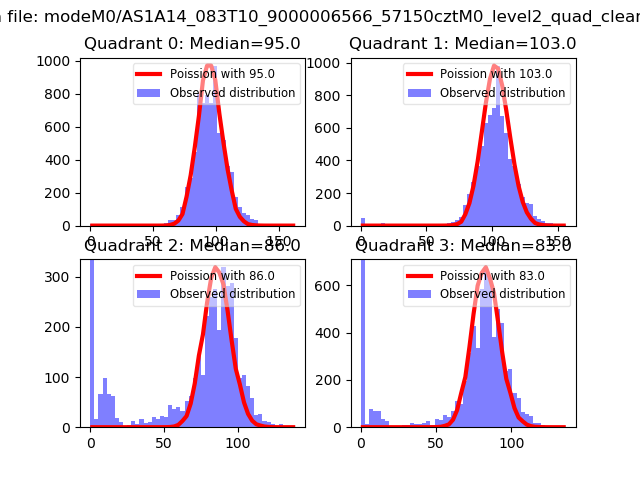 |
 |
| Quadrant-wise count rates Data is divided into 100 sec bins |
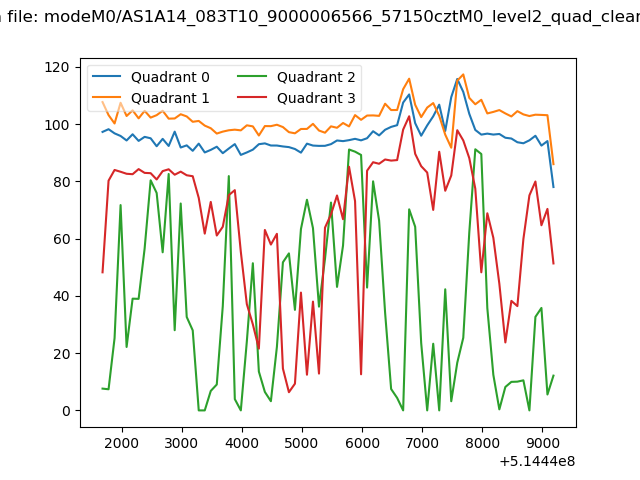 |
|
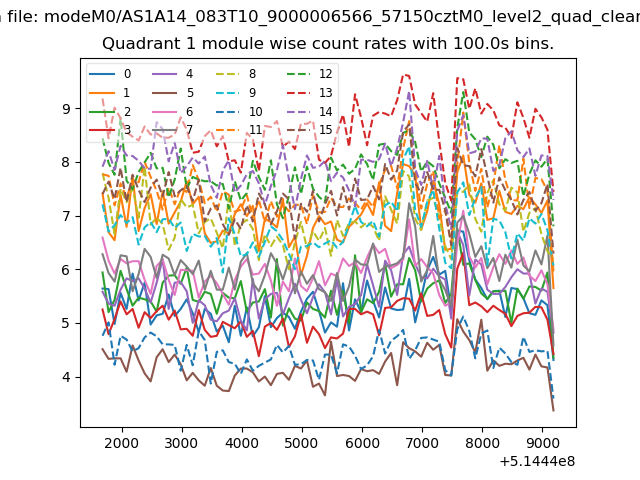
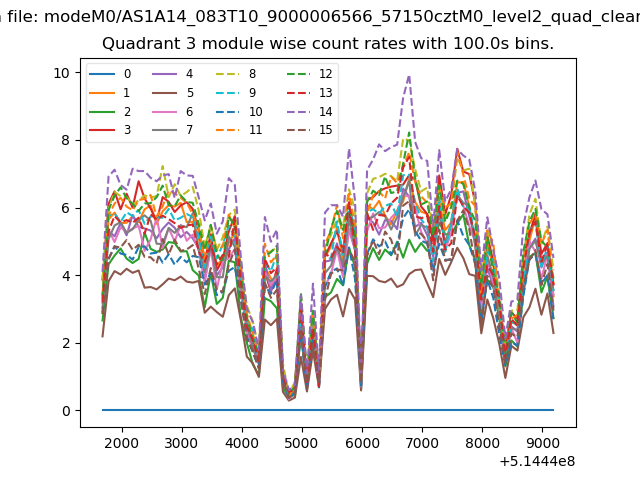
| Module-wise count rates for Quadrant A Data is divided into 100 sec bins |
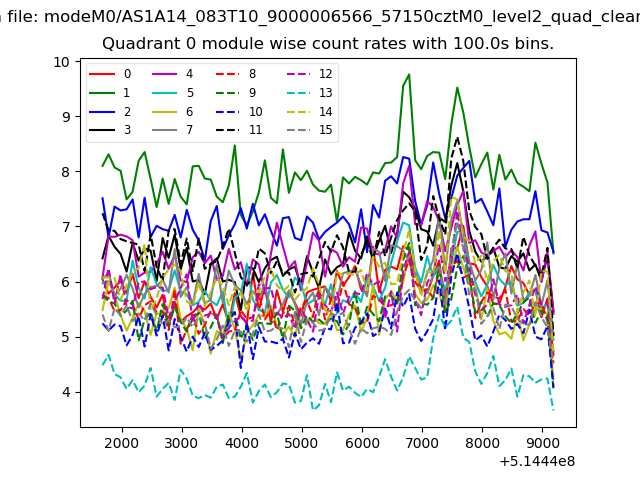 |
 |
| Module-wise count rates for Quadrant B Data is divided into 100 sec bins |
 |
 |
| Module-wise count rates for Quadrant C Data is divided into 100 sec bins |
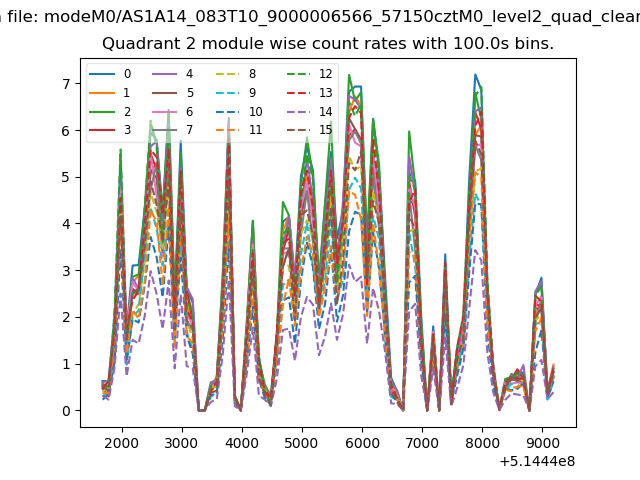 |
 |
| Module-wise count rates for Quadrant D Data is divided into 100 sec bins |
 |
 |
| Parameter | Plot |
|---|---|
| CZT HV Monitor | 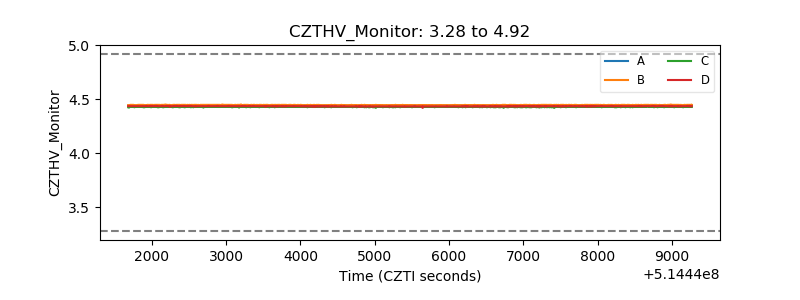 |
| D_VDD | 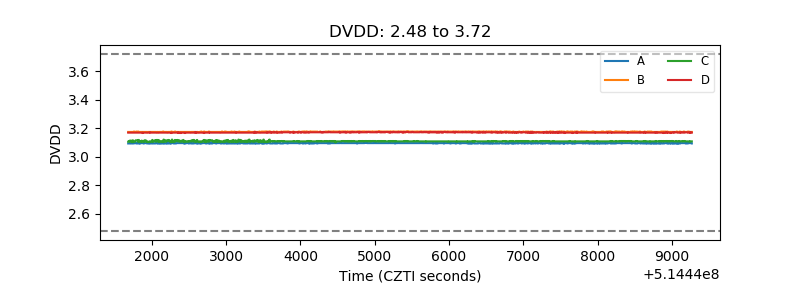 |
| Temperature 1 | 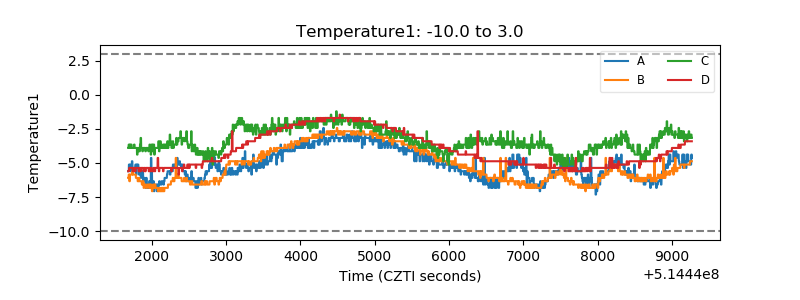 |
| Veto HV Monitor | 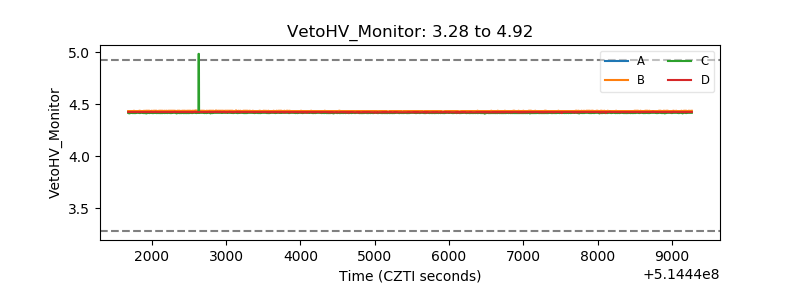 |
| Veto LLD | 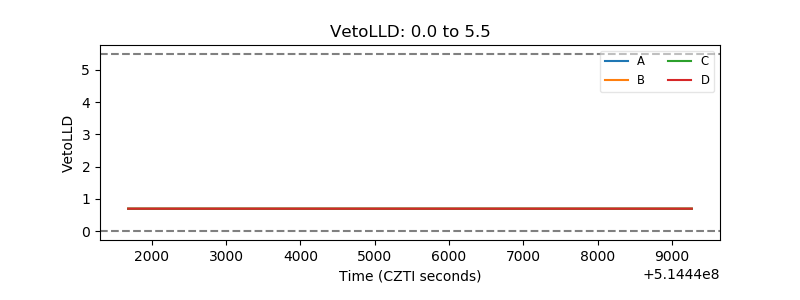 |
| Alpha Counter | 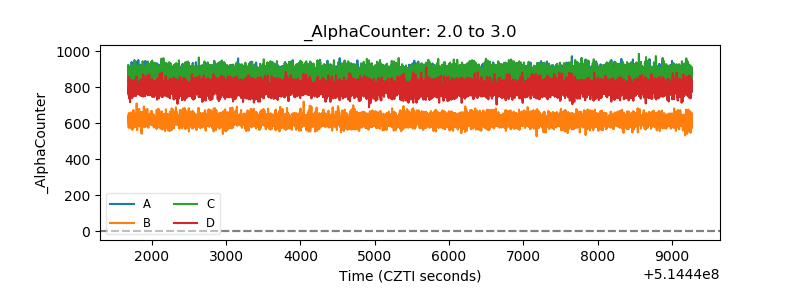 |
| _CPM_Rate | 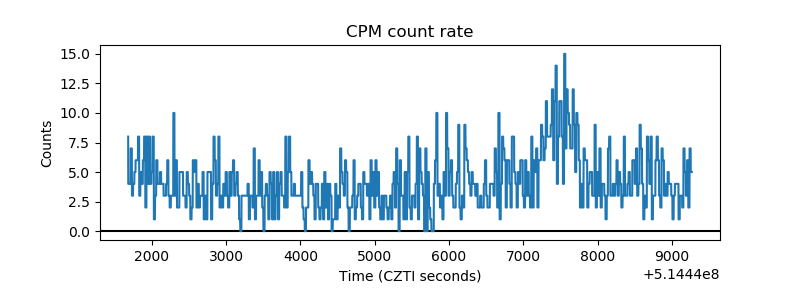 |
| CZT Counter | 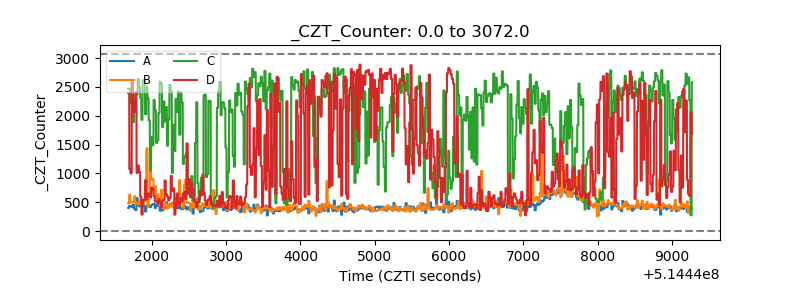 |
| +2.5 Volts monitor |  |
| +5 Volts monitor |  |
| _ROLL_ROT | 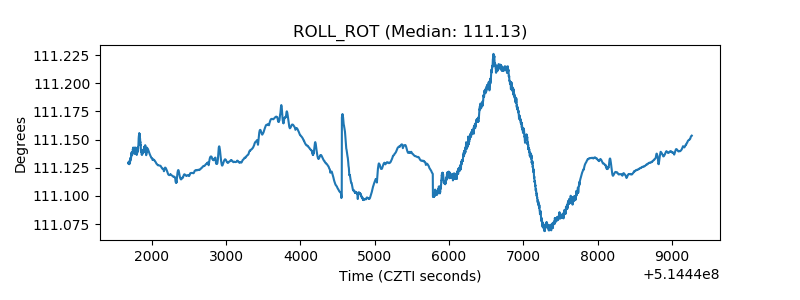 |
| _Roll_DEC | 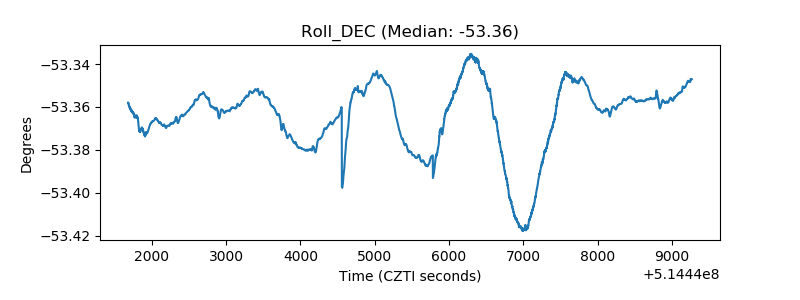 |
| _Roll_RA | 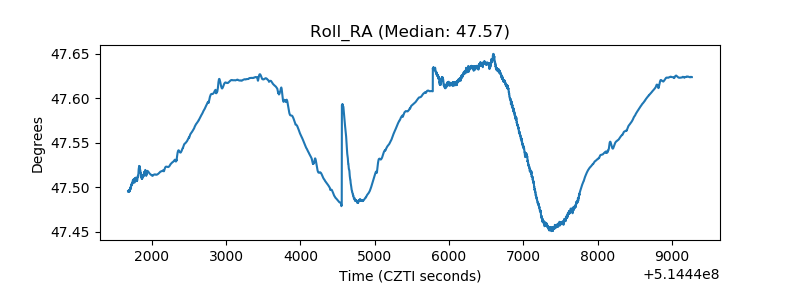 |
| Veto Counter | 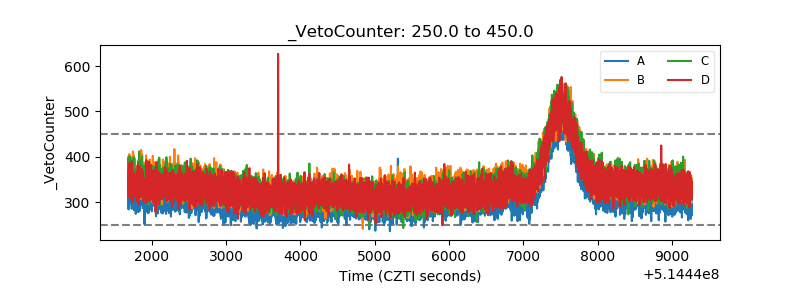 |