| Param | Original file | Final file |
|---|---|---|
| Filename | modeM0/AS1A14_070T08_9000006568_57160cztM0_level2.fits | modeM0/AS1A14_070T08_9000006568_57160cztM0_level2_quad_clean.evt |
| Size (bytes) | 533,387,520 | 88,614,720 |
| Size | 508.7 MB | 84.5 MB |
| Events in quadrant A | 2,737,246 | 633,937 |
| Events in quadrant B | 3,776,625 | 651,491 |
| Events in quadrant C | 8,450,997 | 418,548 |
| Events in quadrant D | 4,286,692 | 536,886 |
| Mode M9 | |||
|---|---|---|---|
| Quadrant | BADHDUFLAG | Total packets | Discarded packets |
| A | 0 | 14 | 0 |
| B | 0 | 15 | 0 |
| C | 0 | 15 | 0 |
| D | 0 | 15 | 0 |
| Mode SS | |||
|---|---|---|---|
| Quadrant | BADHDUFLAG | Total packets | Discarded packets |
| A | 0 | 130 | 0 |
| B | 0 | 130 | 0 |
| C | 0 | 130 | 0 |
| D | 0 | 130 | 0 |
| Mode M0 | |||
|---|---|---|---|
| Quadrant | BADHDUFLAG | Total packets | Discarded packets |
| A | 0 | 12908 | 2 |
| B | 0 | 15725 | 2 |
| C | 0 | 29522 | 2 |
| D | 0 | 17188 | 2 |
| Quadrant | Total seconds | Saturated seconds | Saturation percentage |
|---|---|---|---|
| A | 6335 | 22 | 0.347277% |
| B | 6335 | 313 | 4.940805% |
| C | 6335 | 2074 | 32.738753% |
| D | 6335 | 312 | 4.925020% |
Noise dominated data is calculated using 1-second bins in cleaned event files. If a bin has >2000 counts, and if more than 50% of those come from <1% of pixels, then it is considered to be noise-dominated and hence unusable.
| Quadrant | # 1 sec bins | Bins with >0 counts | Bins with >2000 counts | High rate bins dominated by noise | Noise dominated (total time) | Noise dominated (detector-on time) | Marked lightcurve |
|---|---|---|---|---|---|---|---|
| A | 7535 | 6336 | 1 | 1 | 0.01% | 0.02% | 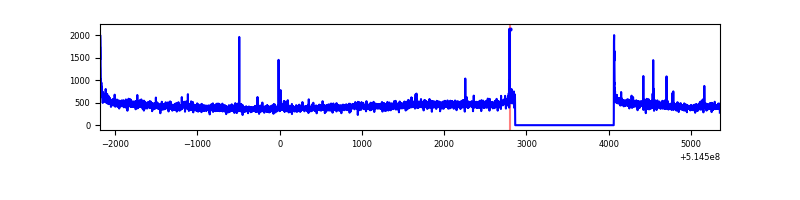 |
| B | 7535 | 6336 | 194 | 194 | 2.57% | 3.06% | 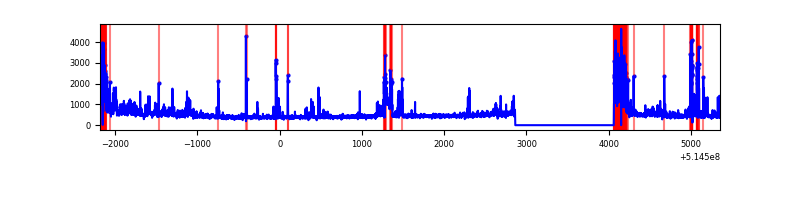 |
| C | 7535 | 6335 | 1788 | 1788 | 23.73% | 28.22% | 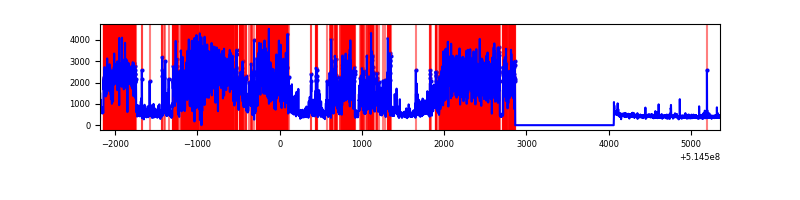 |
| D | 7535 | 6336 | 294 | 294 | 3.90% | 4.64% | 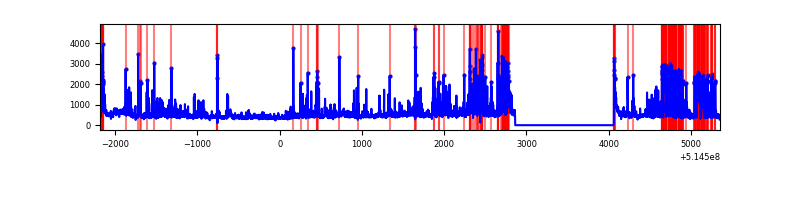 |
Top three noisy pixels from each quadrant. If the there are fewer than three noisy pixels in the level2.evt file, extra rows are filled as -1
| Pixel properties | Quadrant properties | ||||||
|---|---|---|---|---|---|---|---|
| Quadrant | DetID | PixID | Counts | Sigma | Mean | Median | Sigma |
| A | 3 | 14 | 55177 | 323.04 | 680 | 663 | 168.8 |
| A | 10 | 248 | 14129 | 79.8 | 680 | 663 | 168.8 |
| A | 4 | 3 | 10119 | 56.03 | 680 | 663 | 168.8 |
| B | 10 | 16 | 580213 | 4138.08 | 656 | 632 | 140.1 |
| B | 0 | 213 | 184391 | 1312.0 | 656 | 632 | 140.1 |
| B | 4 | 67 | 96521 | 684.63 | 656 | 632 | 140.1 |
| C | 15 | 198 | 5656745 | 36473.31 | 565 | 560 | 155.1 |
| C | 15 | 224 | 290144 | 1867.35 | 565 | 560 | 155.1 |
| C | 13 | 3 | 211413 | 1359.66 | 565 | 560 | 155.1 |
| D | 14 | 49 | 506610 | 2790.47 | 637 | 607 | 181.3 |
| D | 12 | 33 | 434746 | 2394.16 | 637 | 607 | 181.3 |
| D | 2 | 249 | 248972 | 1369.66 | 637 | 607 | 181.3 |
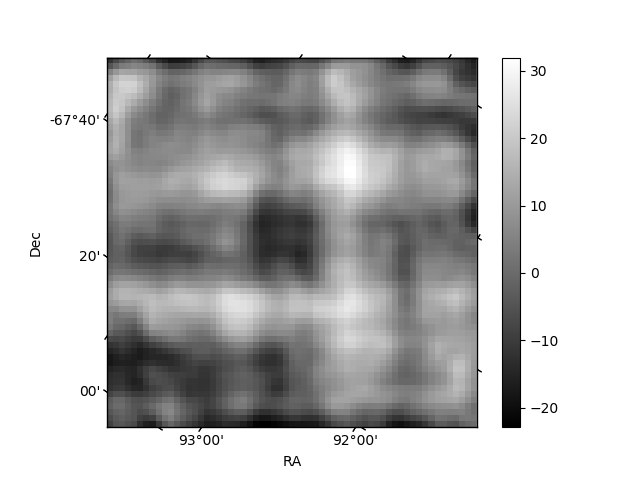
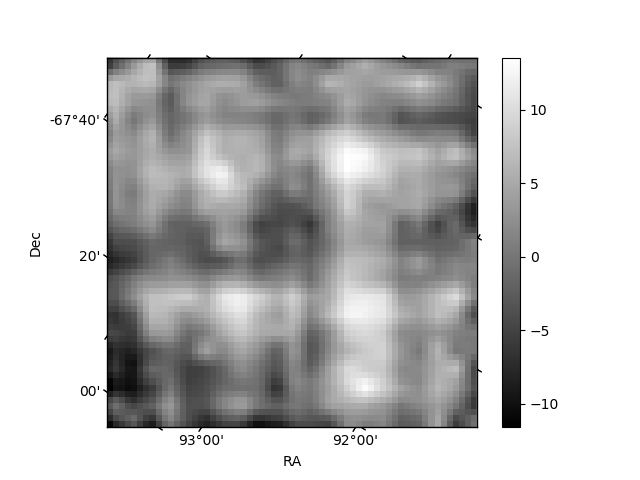
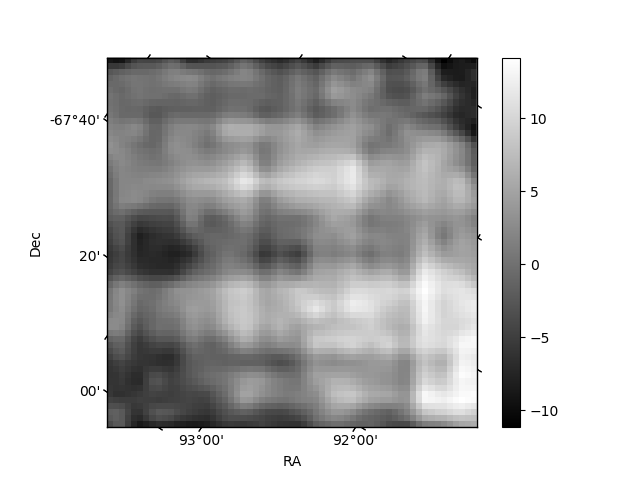
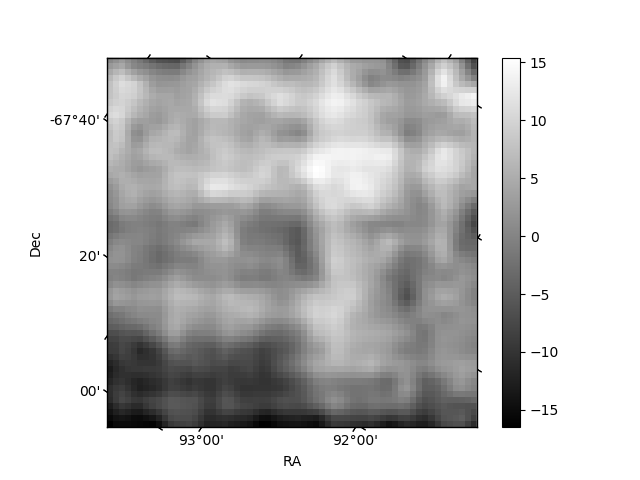
Histogram calculated using DETX and DETY for each event in the final _common_clean file
| Quadrant A | 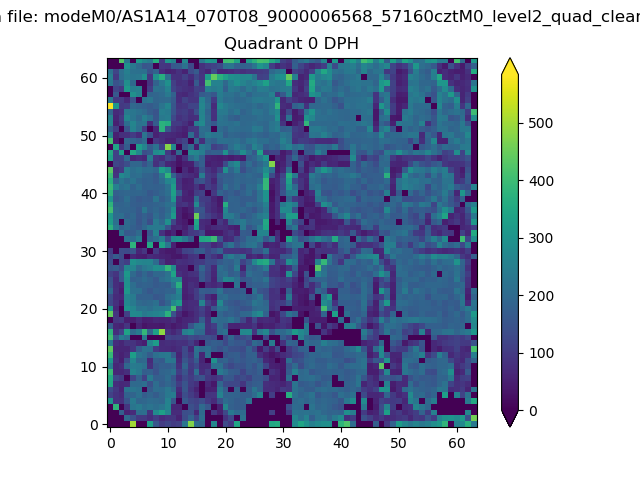 |
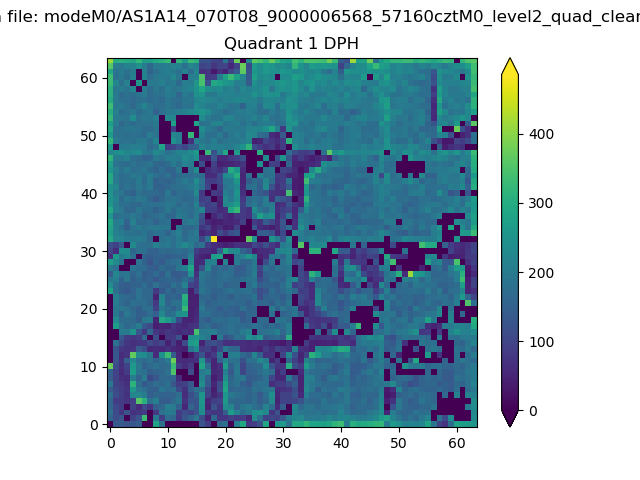 |
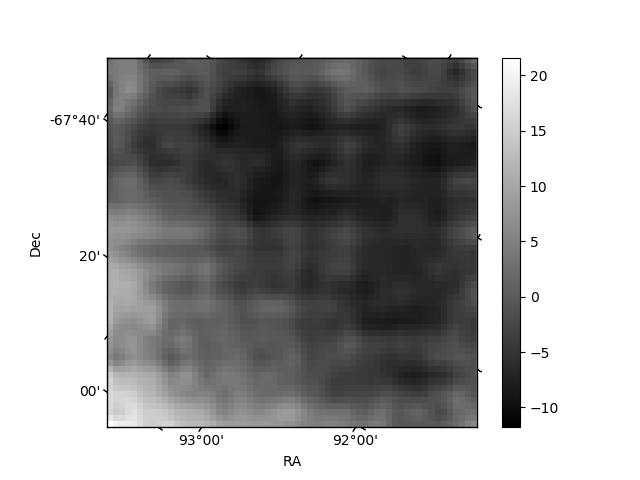
Quadrant B |
|---|---|---|---|
| Quadrant D | 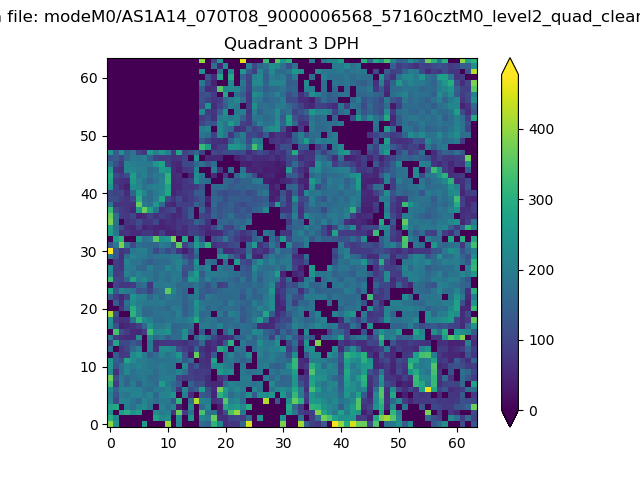 |
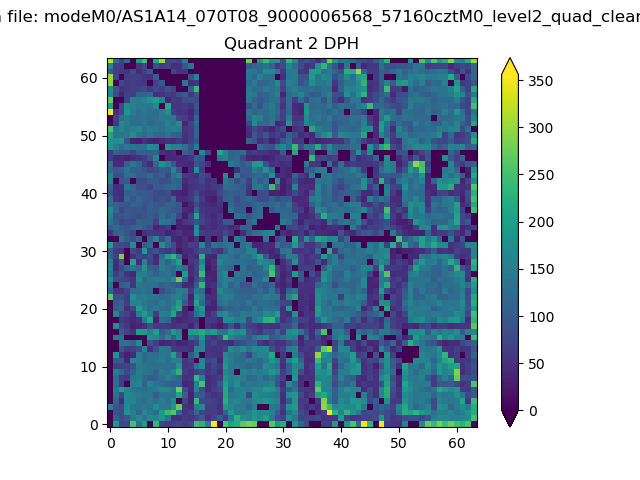 |
Quadrant C |
| Plot type | Count rate plots | Images |
|---|---|---|
| Comparison with Poisson distribution Blue bars denote a histogram of data divided into 1 sec bins. Red curve is a Poisson curve with rate = median count rate of data. |
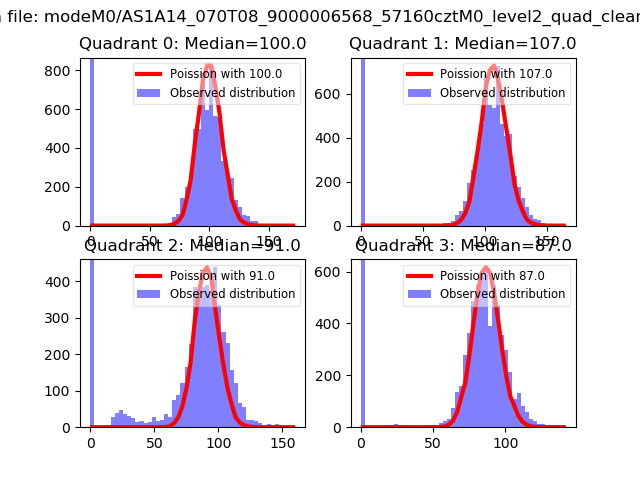 |
 |
| Quadrant-wise count rates Data is divided into 100 sec bins |
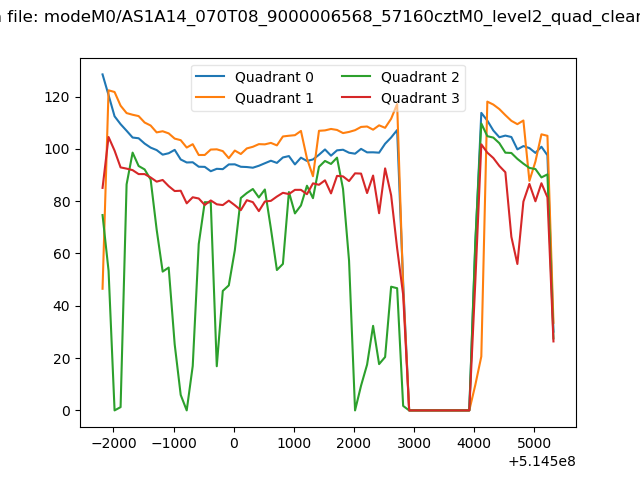 |
|
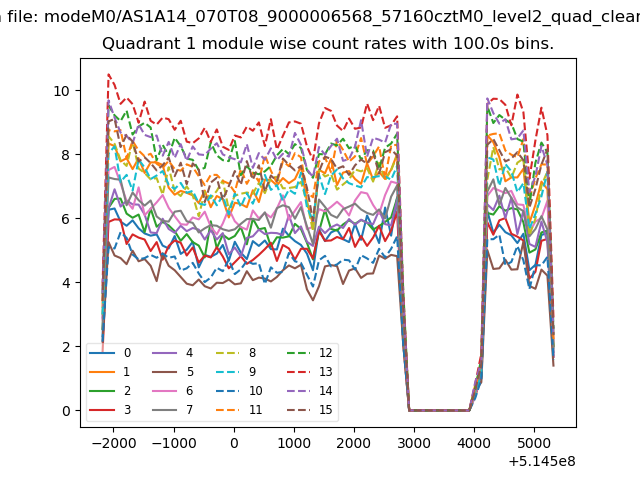
| Module-wise count rates for Quadrant A Data is divided into 100 sec bins |
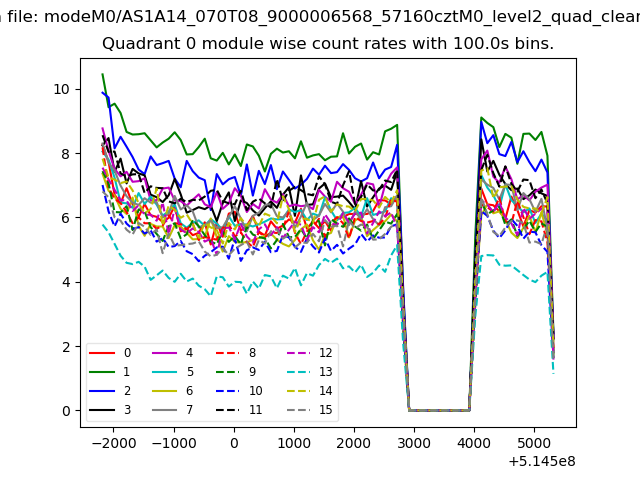 |
 |
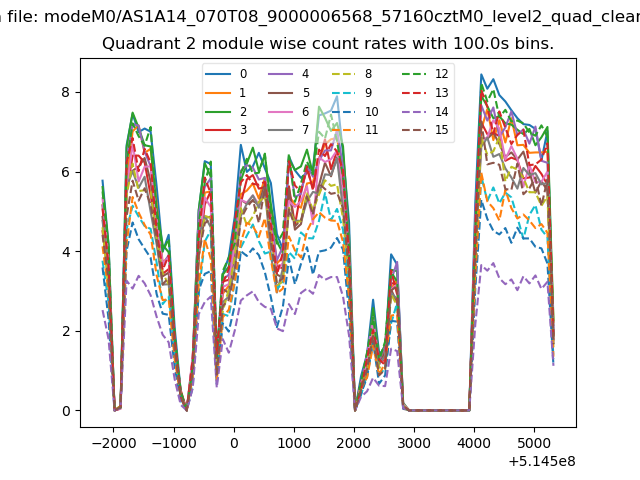
| Module-wise count rates for Quadrant B Data is divided into 100 sec bins |
 |
 |
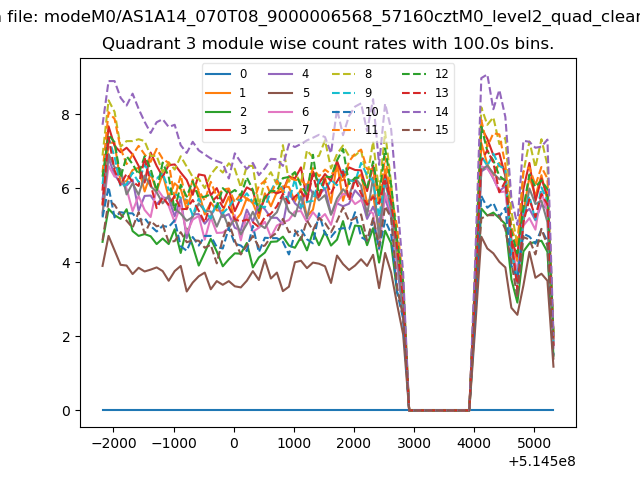
| Module-wise count rates for Quadrant C Data is divided into 100 sec bins |
 |
 |
| Module-wise count rates for Quadrant D Data is divided into 100 sec bins |
 |
 |
| Parameter | Plot |
|---|---|
| CZT HV Monitor | 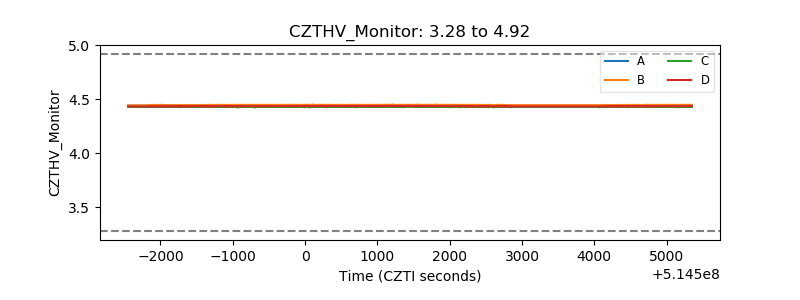 |
| D_VDD | 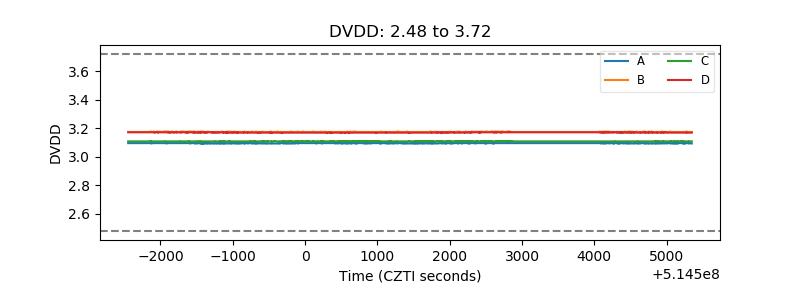 |
| Temperature 1 | 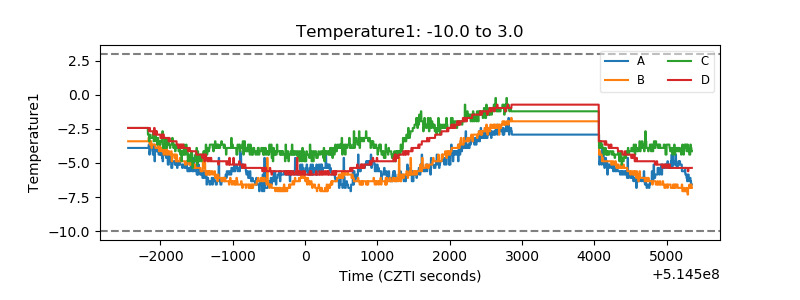 |
| Veto HV Monitor | 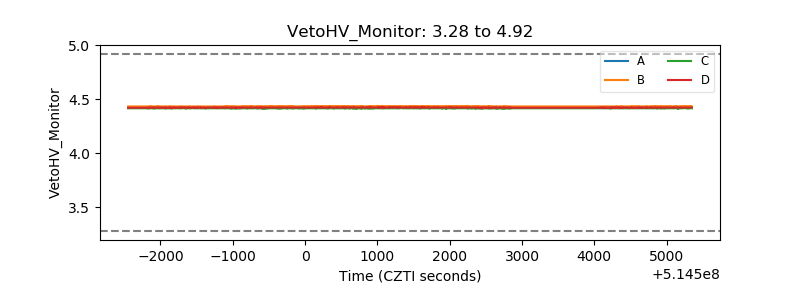 |
| Veto LLD | 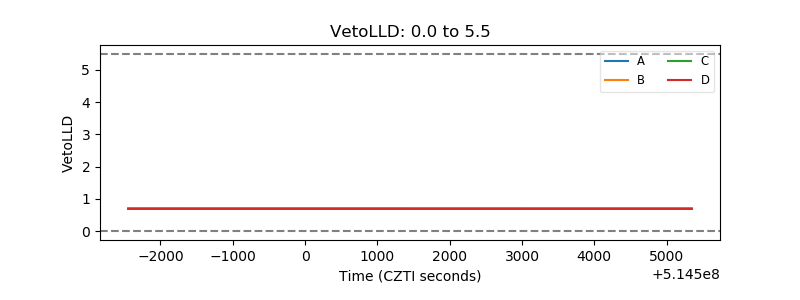 |
| Alpha Counter | 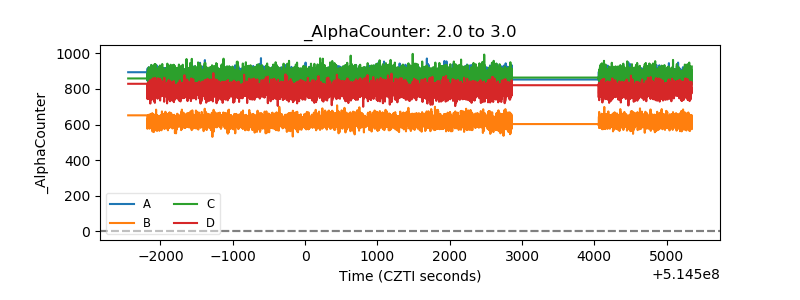 |
| _CPM_Rate | 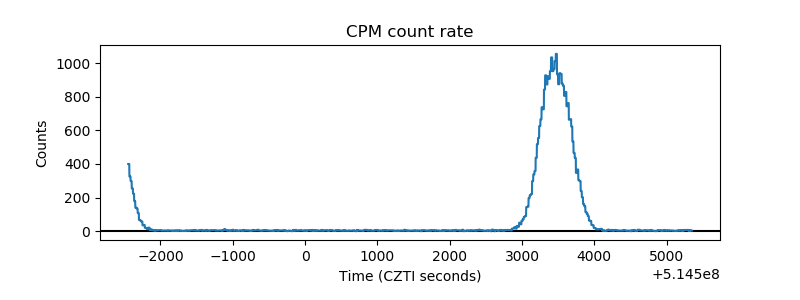 |
| CZT Counter | 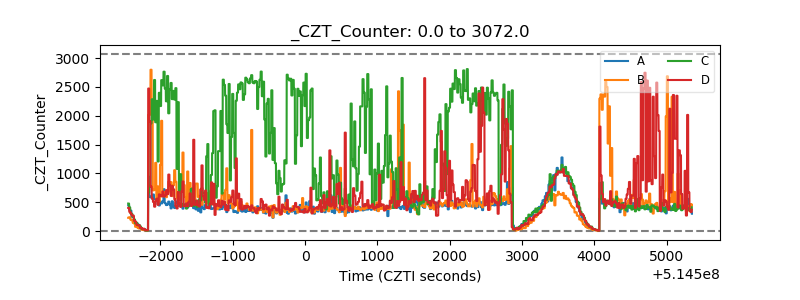 |
| +2.5 Volts monitor |  |
| +5 Volts monitor |  |
| _ROLL_ROT | 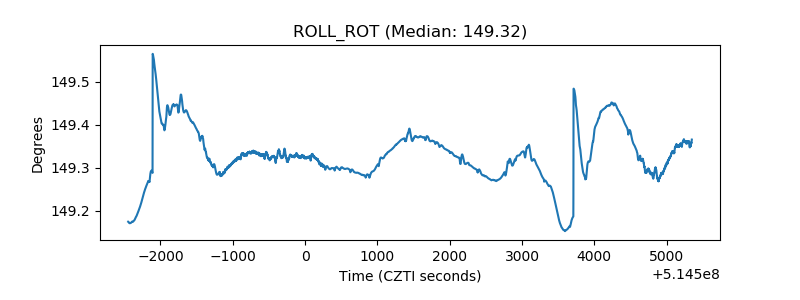 |
| _Roll_DEC | 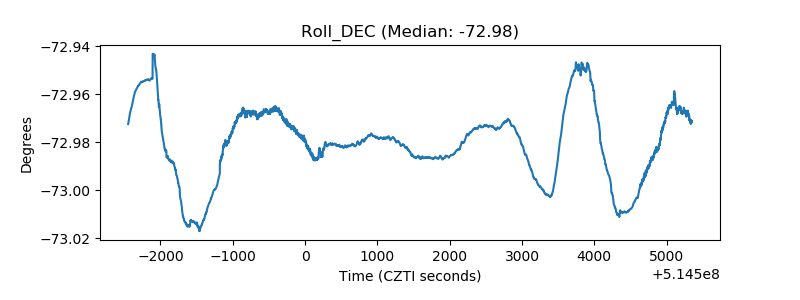 |
| _Roll_RA | 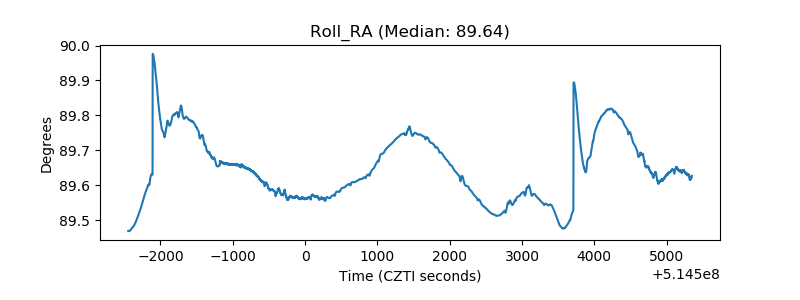 |
| Veto Counter | 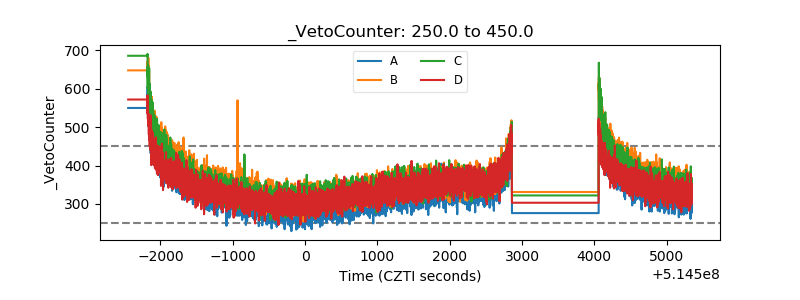 |