| Param | Original file | Final file |
|---|---|---|
| Filename | modeM0/AS1A14_070T08_9000006568_57162cztM0_level2.fits | modeM0/AS1A14_070T08_9000006568_57162cztM0_level2_quad_clean.evt |
| Size (bytes) | 514,609,920 | 97,441,920 |
| Size | 490.8 MB | 92.9 MB |
| Events in quadrant A | 2,976,106 | 666,845 |
| Events in quadrant B | 3,584,897 | 709,403 |
| Events in quadrant C | 5,422,162 | 585,538 |
| Events in quadrant D | 6,536,571 | 513,697 |
| Mode M9 | |||
|---|---|---|---|
| Quadrant | BADHDUFLAG | Total packets | Discarded packets |
| A | 0 | 17 | 0 |
| B | 0 | 18 | 0 |
| C | 0 | 18 | 0 |
| D | 0 | 18 | 0 |
| Mode SS | |||
|---|---|---|---|
| Quadrant | BADHDUFLAG | Total packets | Discarded packets |
| A | 0 | 138 | 0 |
| B | 0 | 138 | 0 |
| C | 0 | 138 | 0 |
| D | 0 | 138 | 0 |
| Mode M0 | |||
|---|---|---|---|
| Quadrant | BADHDUFLAG | Total packets | Discarded packets |
| A | 0 | 14172 | 2 |
| B | 0 | 15488 | 2 |
| C | 0 | 20906 | 2 |
| D | 0 | 24262 | 2 |
| Quadrant | Total seconds | Saturated seconds | Saturation percentage |
|---|---|---|---|
| A | 6816 | 23 | 0.337441% |
| B | 6816 | 180 | 2.640845% |
| C | 6816 | 611 | 8.964202% |
| D | 6816 | 930 | 13.644366% |
Noise dominated data is calculated using 1-second bins in cleaned event files. If a bin has >2000 counts, and if more than 50% of those come from <1% of pixels, then it is considered to be noise-dominated and hence unusable.
| Quadrant | # 1 sec bins | Bins with >0 counts | Bins with >2000 counts | High rate bins dominated by noise | Noise dominated (total time) | Noise dominated (detector-on time) | Marked lightcurve |
|---|---|---|---|---|---|---|---|
| A | 7916 | 6817 | 1 | 1 | 0.01% | 0.01% | 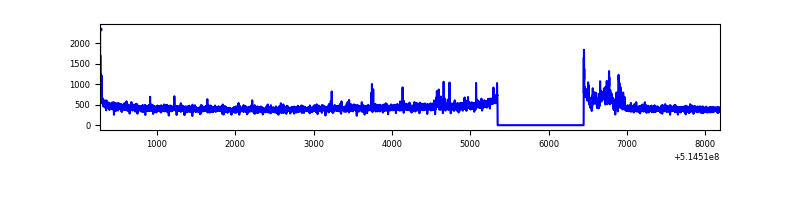 |
| B | 7916 | 6817 | 85 | 85 | 1.07% | 1.25% | 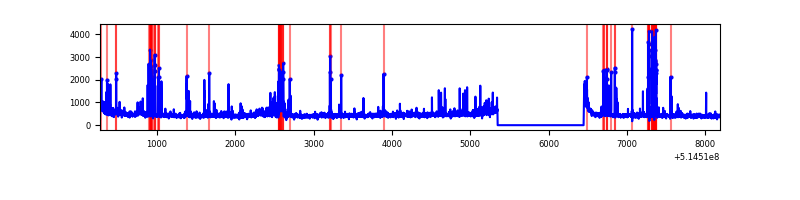 |
| C | 7916 | 6816 | 451 | 451 | 5.70% | 6.62% | 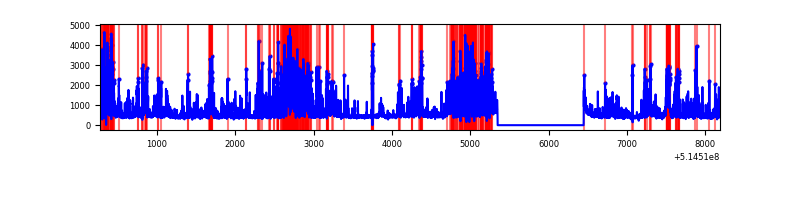 |
| D | 7916 | 6816 | 821 | 821 | 10.37% | 12.05% | 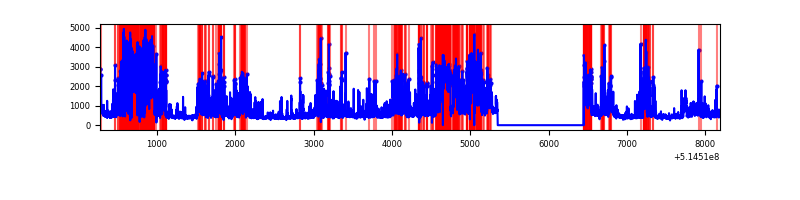 |
Top three noisy pixels from each quadrant. If the there are fewer than three noisy pixels in the level2.evt file, extra rows are filled as -1
| Pixel properties | Quadrant properties | ||||||
|---|---|---|---|---|---|---|---|
| Quadrant | DetID | PixID | Counts | Sigma | Mean | Median | Sigma |
| A | 3 | 14 | 104628 | 582.2 | 723 | 704 | 178.5 |
| A | 10 | 248 | 20782 | 112.48 | 723 | 704 | 178.5 |
| A | 4 | 3 | 20266 | 109.59 | 723 | 704 | 178.5 |
| B | 4 | 67 | 249912 | 1630.95 | 717 | 692 | 152.8 |
| B | 10 | 247 | 175535 | 1144.21 | 717 | 692 | 152.8 |
| B | 1 | 238 | 52875 | 341.5 | 717 | 692 | 152.8 |
| C | 15 | 224 | 2347065 | 12768.4 | 677 | 669 | 183.8 |
| C | 13 | 3 | 139374 | 754.79 | 677 | 669 | 183.8 |
| C | 14 | 246 | 92929 | 502.05 | 677 | 669 | 183.8 |
| D | 12 | 33 | 2875401 | 15582.65 | 654 | 624 | 184.5 |
| D | 7 | 96 | 605317 | 3277.72 | 654 | 624 | 184.5 |
| D | 8 | 240 | 154926 | 836.39 | 654 | 624 | 184.5 |
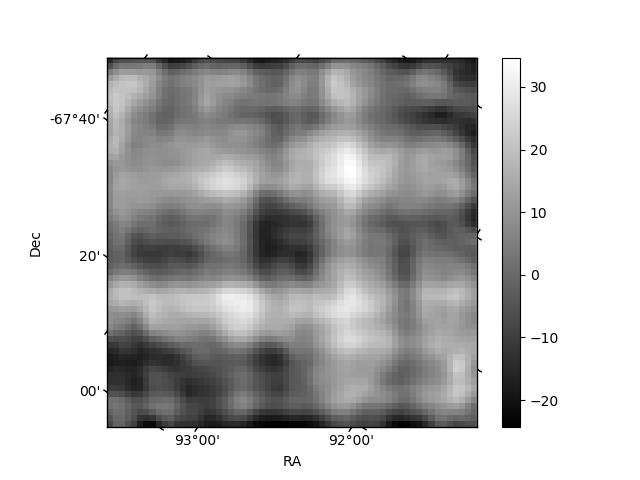
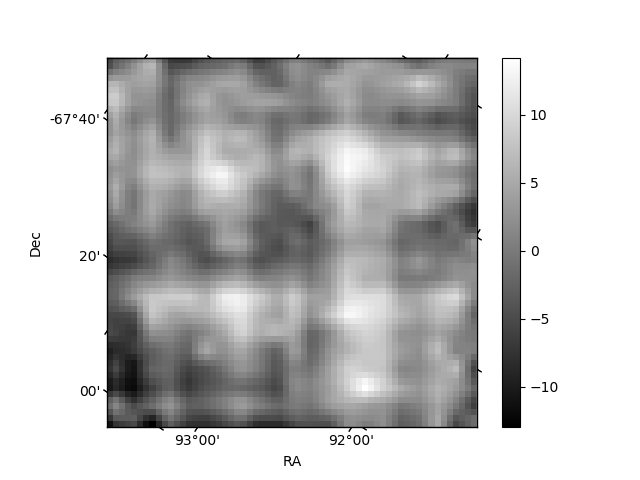
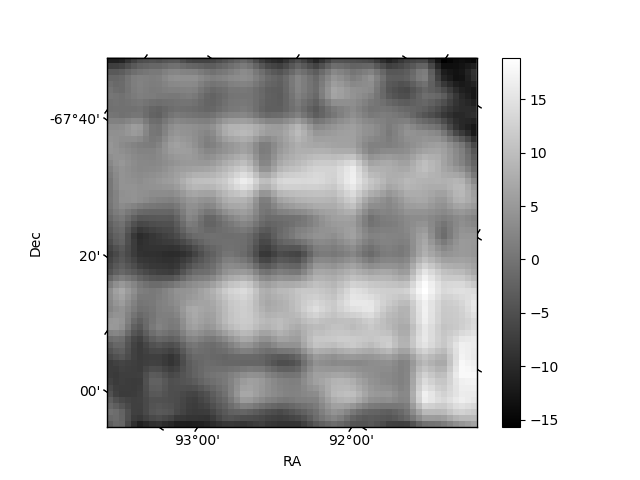
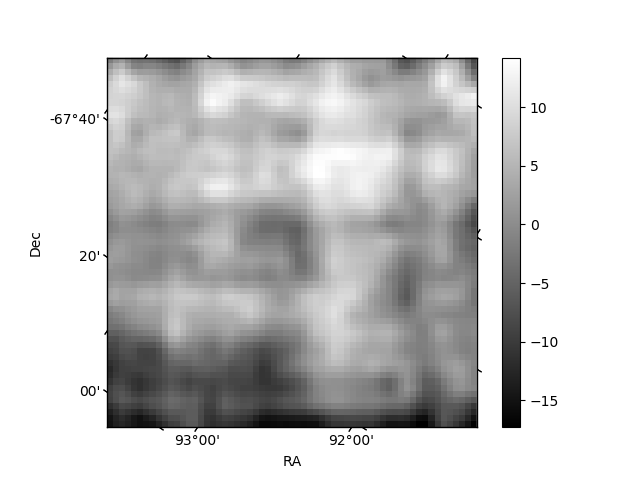
Histogram calculated using DETX and DETY for each event in the final _common_clean file
| Quadrant A | 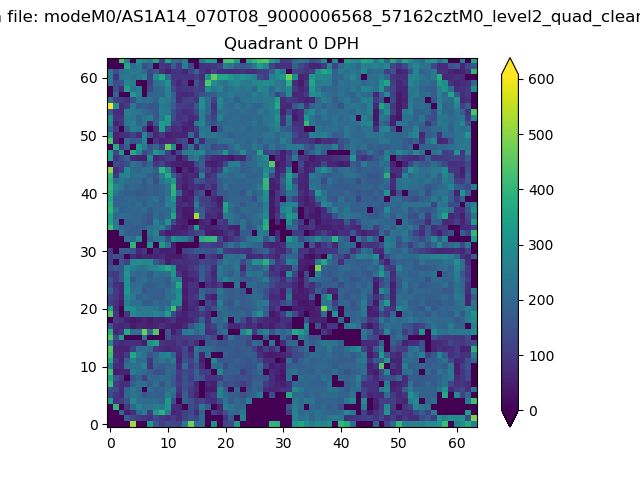 |
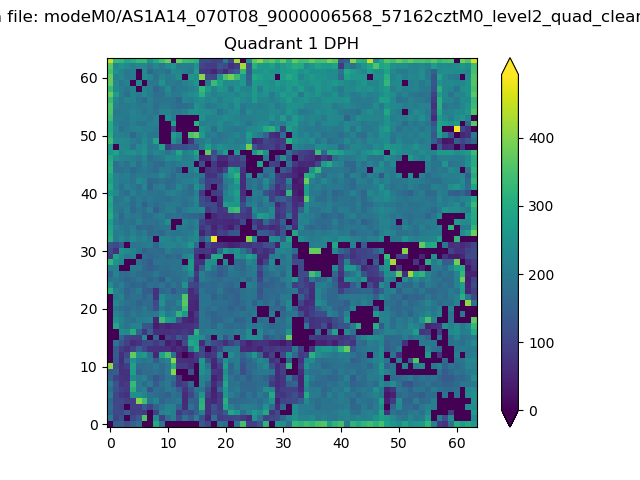 |
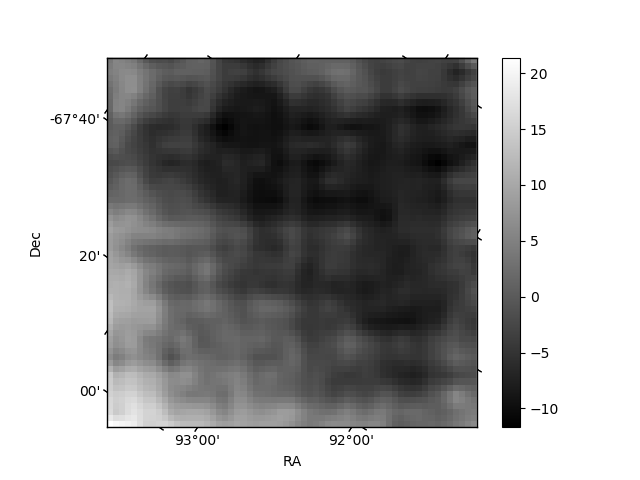
Quadrant B |
|---|---|---|---|
| Quadrant D | 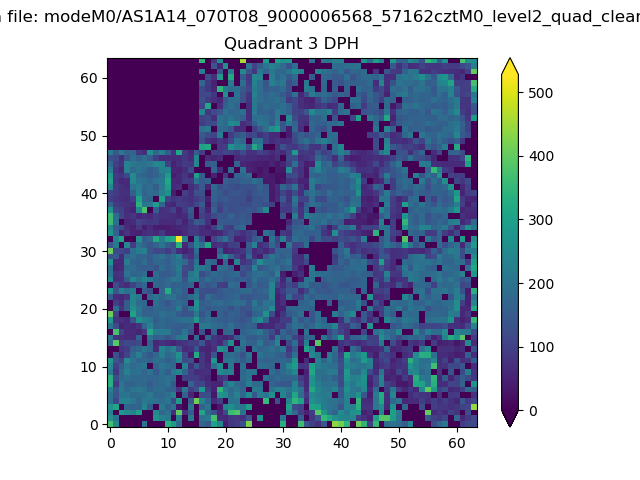 |
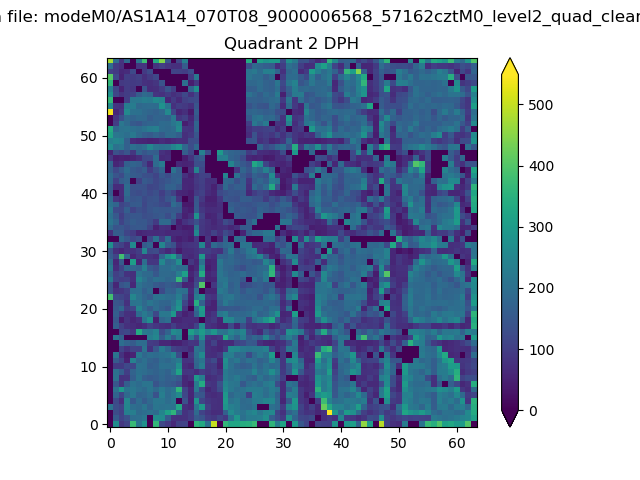 |
Quadrant C |
| Plot type | Count rate plots | Images |
|---|---|---|
| Comparison with Poisson distribution Blue bars denote a histogram of data divided into 1 sec bins. Red curve is a Poisson curve with rate = median count rate of data. |
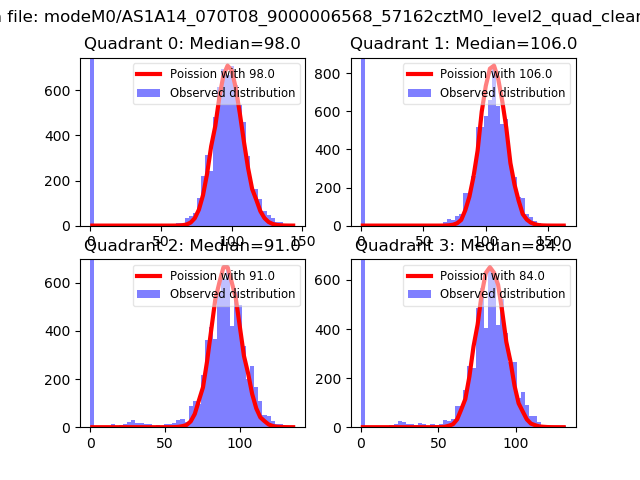 |
 |
| Quadrant-wise count rates Data is divided into 100 sec bins |
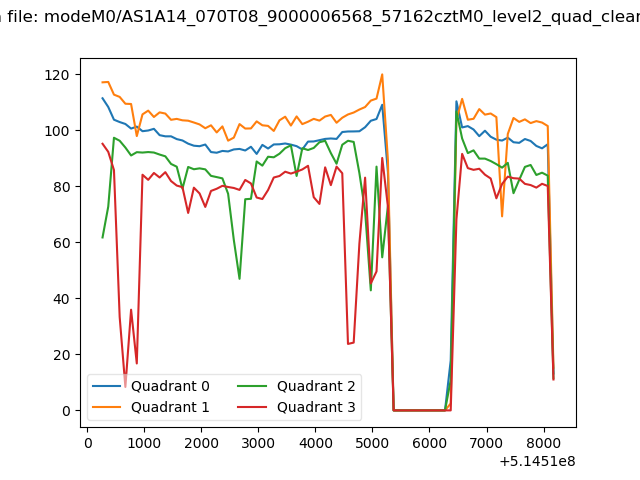 |
|
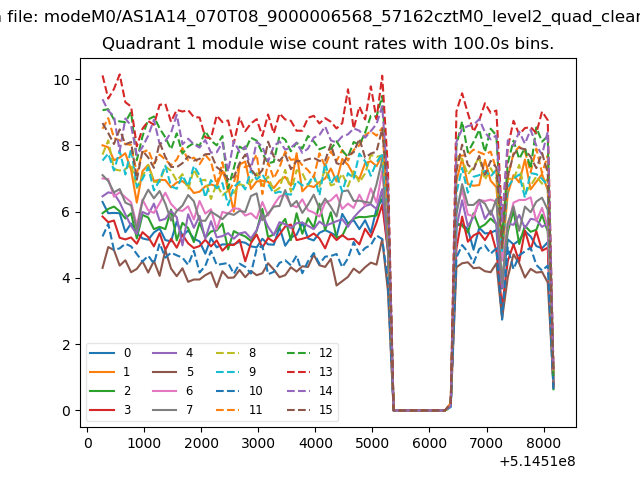
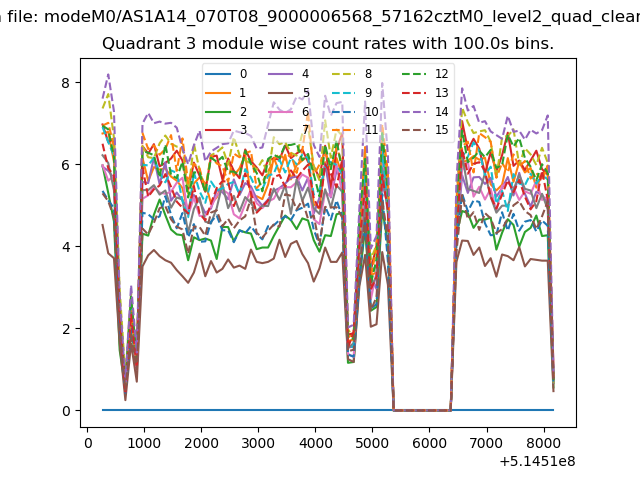
| Module-wise count rates for Quadrant A Data is divided into 100 sec bins |
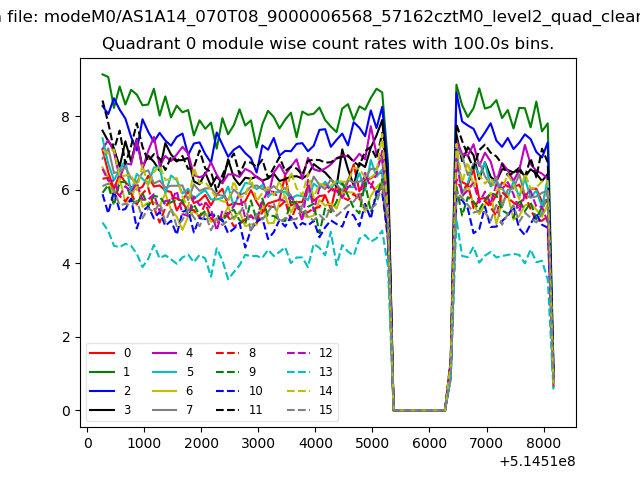 |
 |
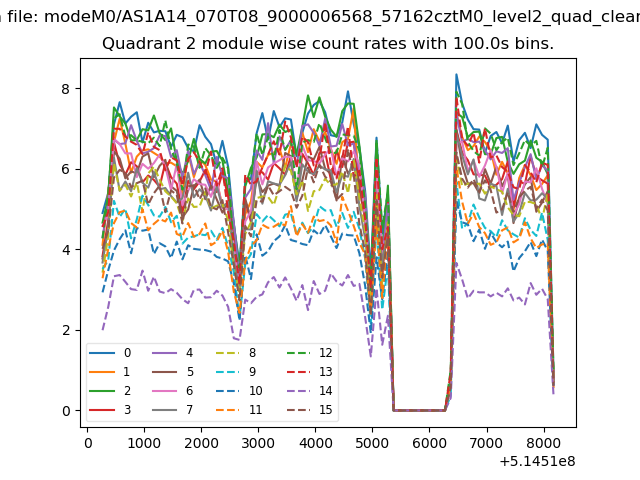
| Module-wise count rates for Quadrant B Data is divided into 100 sec bins |
 |
 |
| Module-wise count rates for Quadrant C Data is divided into 100 sec bins |
 |
 |
| Module-wise count rates for Quadrant D Data is divided into 100 sec bins |
 |
 |
| Parameter | Plot |
|---|---|
| CZT HV Monitor | 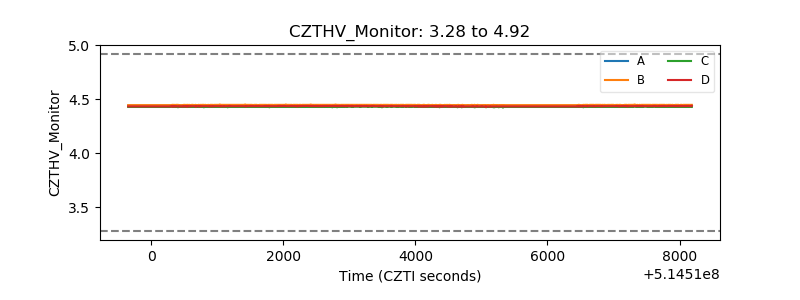 |
| D_VDD | 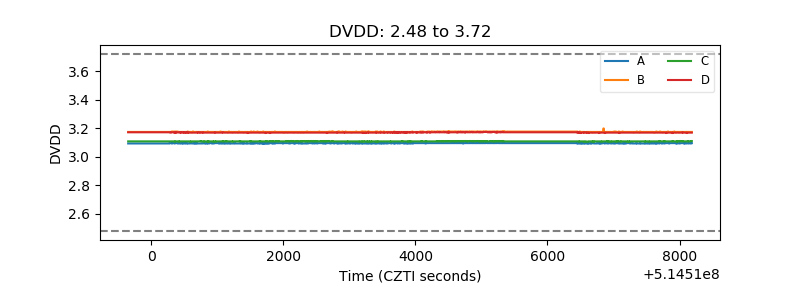 |
| Temperature 1 | 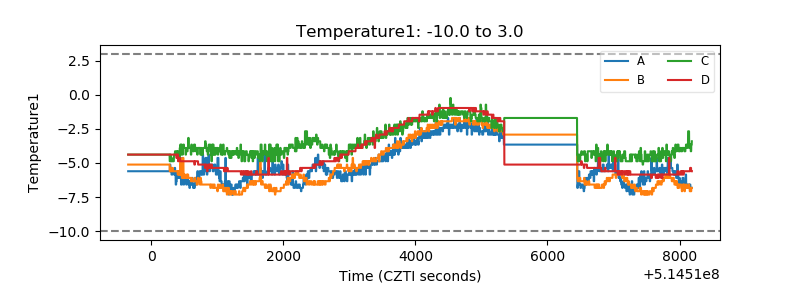 |
| Veto HV Monitor | 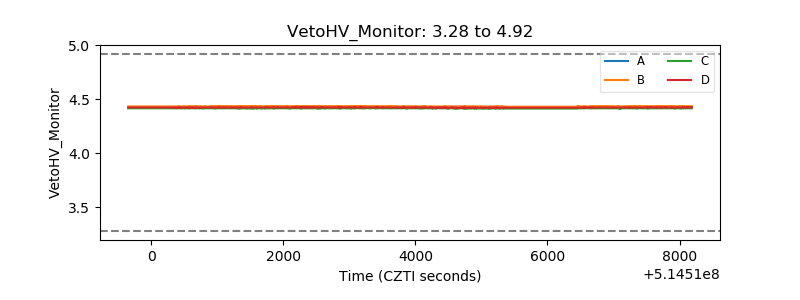 |
| Veto LLD | 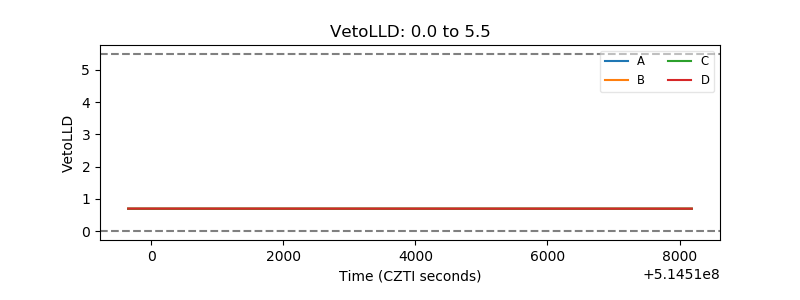 |
| Alpha Counter | 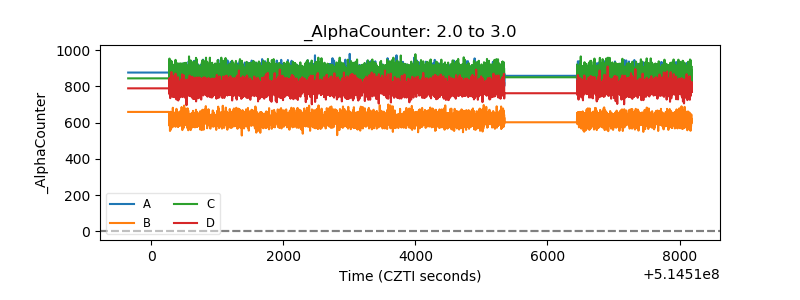 |
| _CPM_Rate | 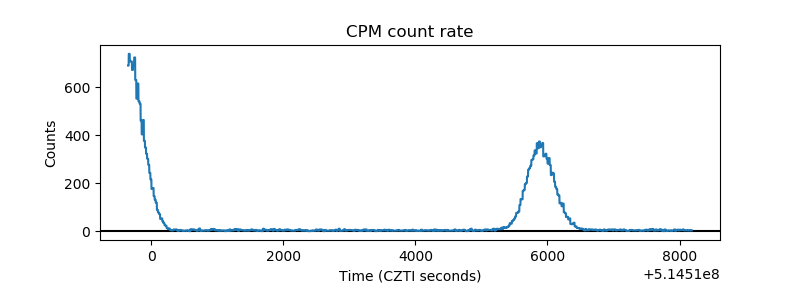 |
| CZT Counter | 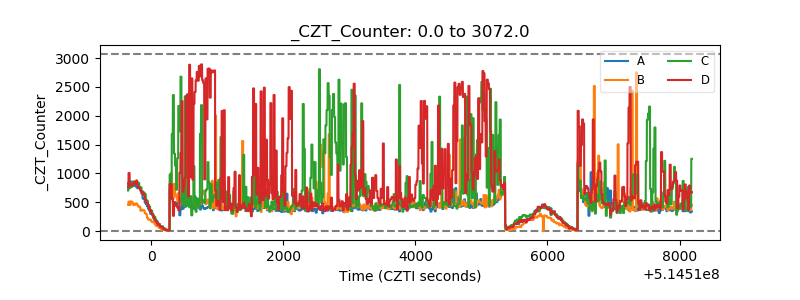 |
| +2.5 Volts monitor | 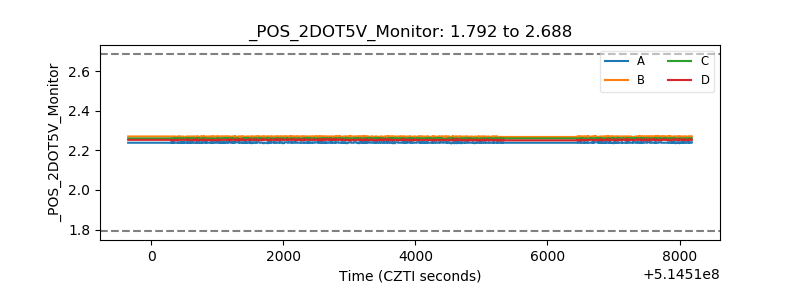 |
| +5 Volts monitor |  |
| _ROLL_ROT | 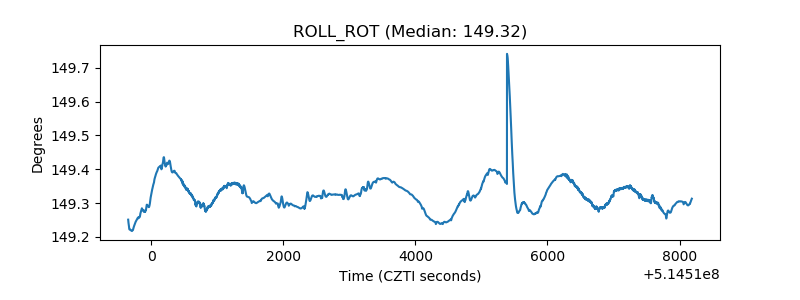 |
| _Roll_DEC | 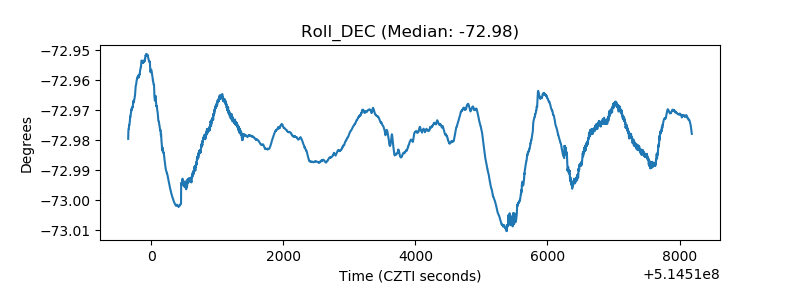 |
| _Roll_RA | 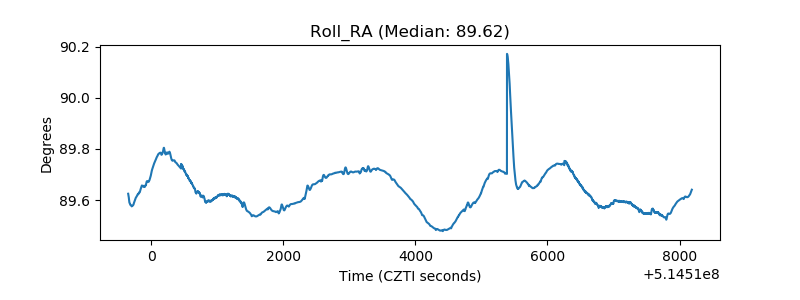 |
| Veto Counter | 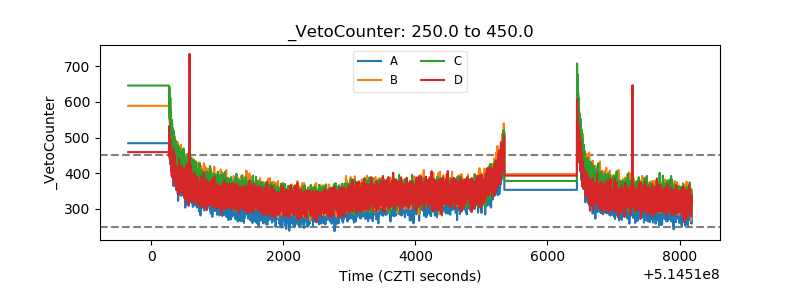 |