| Param | Original file | Final file |
|---|---|---|
| Filename | modeM0/AS1A14_070T08_9000006568_57164cztM0_level2.fits | modeM0/AS1A14_070T08_9000006568_57164cztM0_level2_quad_clean.evt |
| Size (bytes) | 599,270,400 | 99,371,520 |
| Size | 571.5 MB | 94.8 MB |
| Events in quadrant A | 3,236,394 | 693,463 |
| Events in quadrant B | 3,600,418 | 733,584 |
| Events in quadrant C | 7,407,810 | 534,222 |
| Events in quadrant D | 7,363,904 | 533,075 |
| Mode M9 | |||
|---|---|---|---|
| Quadrant | BADHDUFLAG | Total packets | Discarded packets |
| A | 0 | 4 | 0 |
| B | 0 | 5 | 0 |
| C | 0 | 5 | 0 |
| D | 0 | 5 | 0 |
| Mode SS | |||
|---|---|---|---|
| Quadrant | BADHDUFLAG | Total packets | Discarded packets |
| A | 0 | 152 | 0 |
| B | 0 | 152 | 0 |
| C | 0 | 152 | 0 |
| D | 0 | 152 | 0 |
| Mode M0 | |||
|---|---|---|---|
| Quadrant | BADHDUFLAG | Total packets | Discarded packets |
| A | 0 | 15324 | 2 |
| B | 0 | 16168 | 2 |
| C | 0 | 27135 | 2 |
| D | 0 | 27007 | 2 |
| Quadrant | Total seconds | Saturated seconds | Saturation percentage |
|---|---|---|---|
| A | 7388 | 125 | 1.691933% |
| B | 7388 | 267 | 3.613969% |
| C | 7388 | 1677 | 22.698971% |
| D | 7388 | 1250 | 16.919329% |
Noise dominated data is calculated using 1-second bins in cleaned event files. If a bin has >2000 counts, and if more than 50% of those come from <1% of pixels, then it is considered to be noise-dominated and hence unusable.
| Quadrant | # 1 sec bins | Bins with >0 counts | Bins with >2000 counts | High rate bins dominated by noise | Noise dominated (total time) | Noise dominated (detector-on time) | Marked lightcurve |
|---|---|---|---|---|---|---|---|
| A | 7778 | 7390 | 12 | 12 | 0.15% | 0.16% | 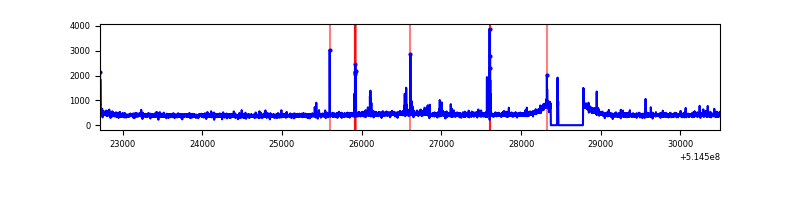 |
| B | 7778 | 7390 | 46 | 46 | 0.59% | 0.62% | 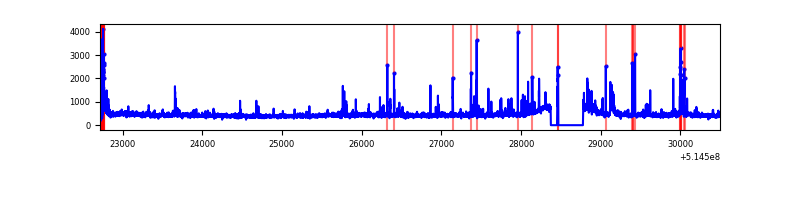 |
| C | 7778 | 7390 | 1104 | 1104 | 14.19% | 14.94% | 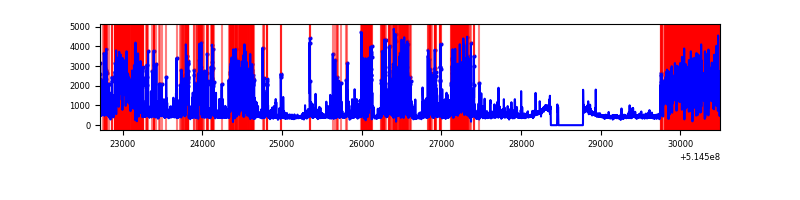 |
| D | 7778 | 7390 | 787 | 787 | 10.12% | 10.65% | 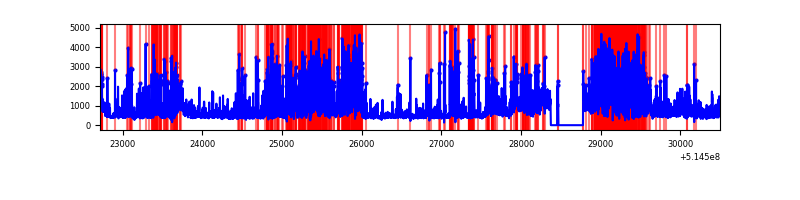 |
Top three noisy pixels from each quadrant. If the there are fewer than three noisy pixels in the level2.evt file, extra rows are filled as -1
| Pixel properties | Quadrant properties | ||||||
|---|---|---|---|---|---|---|---|
| Quadrant | DetID | PixID | Counts | Sigma | Mean | Median | Sigma |
| A | 0 | 12 | 64888 | 328.29 | 791 | 771 | 195.3 |
| A | 8 | 6 | 32868 | 164.34 | 791 | 771 | 195.3 |
| A | 10 | 251 | 24577 | 121.89 | 791 | 771 | 195.3 |
| B | 10 | 16 | 141500 | 840.18 | 781 | 751 | 167.5 |
| B | 0 | 213 | 92974 | 550.51 | 781 | 751 | 167.5 |
| B | 10 | 247 | 37216 | 217.67 | 781 | 751 | 167.5 |
| C | 15 | 224 | 3166178 | 16901.57 | 688 | 680 | 187.3 |
| C | 15 | 198 | 1170978 | 6248.58 | 688 | 680 | 187.3 |
| C | 9 | 38 | 110075 | 584.09 | 688 | 680 | 187.3 |
| D | 12 | 33 | 3443483 | 16997.79 | 715 | 681 | 202.5 |
| D | 2 | 249 | 219193 | 1078.84 | 715 | 681 | 202.5 |
| D | 7 | 96 | 152730 | 750.7 | 715 | 681 | 202.5 |
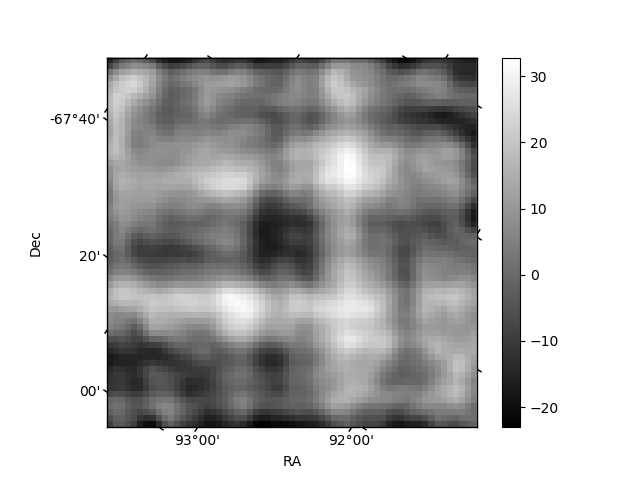
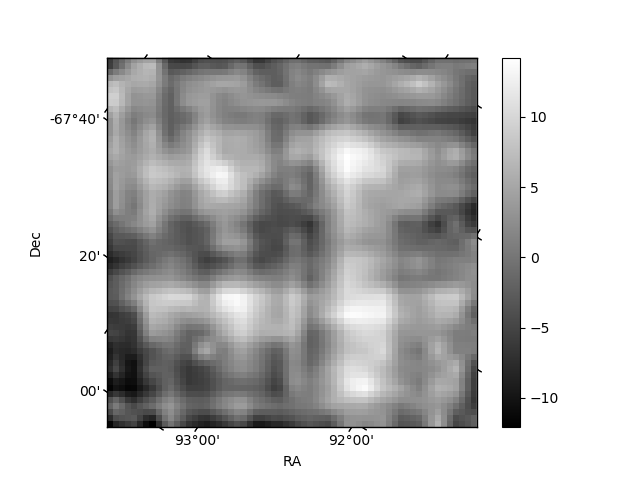
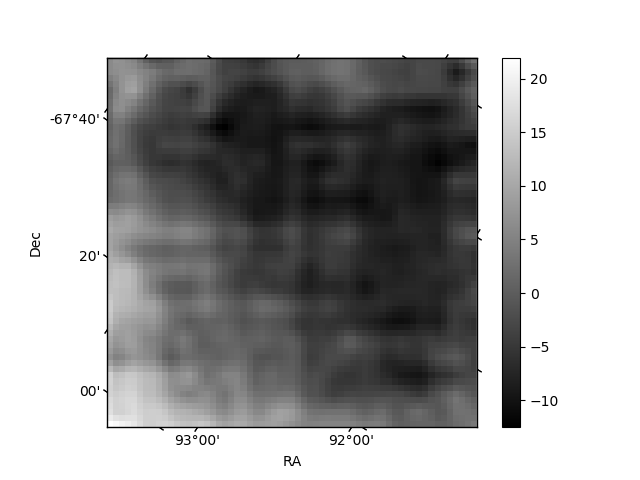
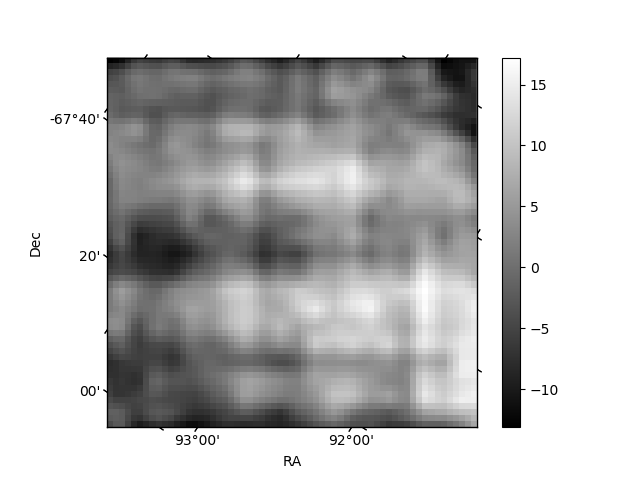
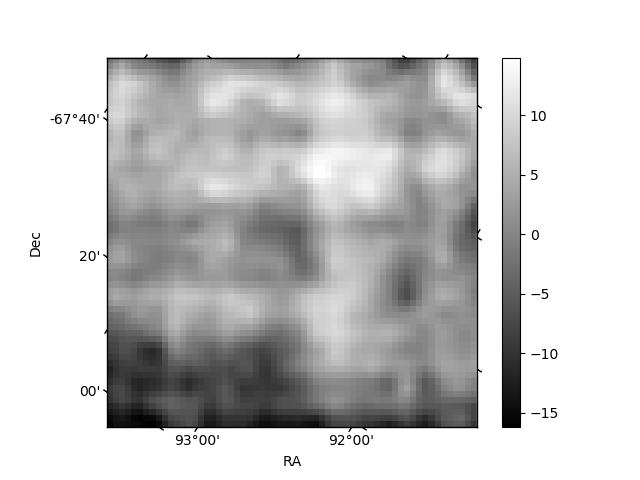
Histogram calculated using DETX and DETY for each event in the final _common_clean file
| Quadrant A | 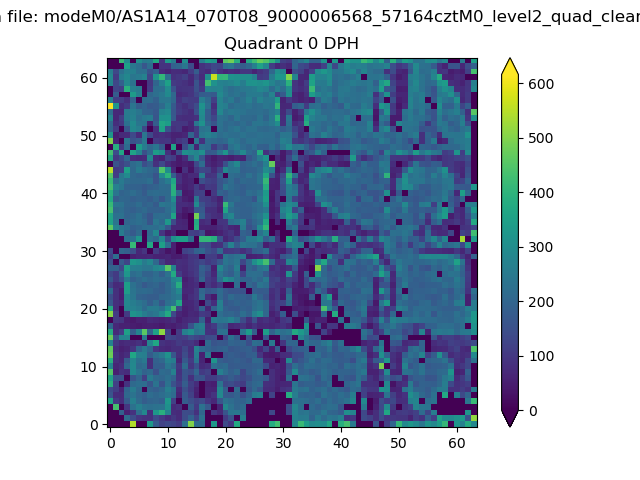 |
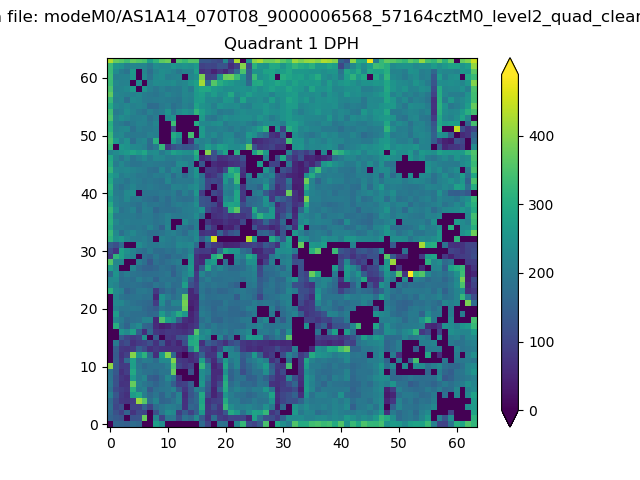 |
Quadrant B |
|---|---|---|---|
| Quadrant D | 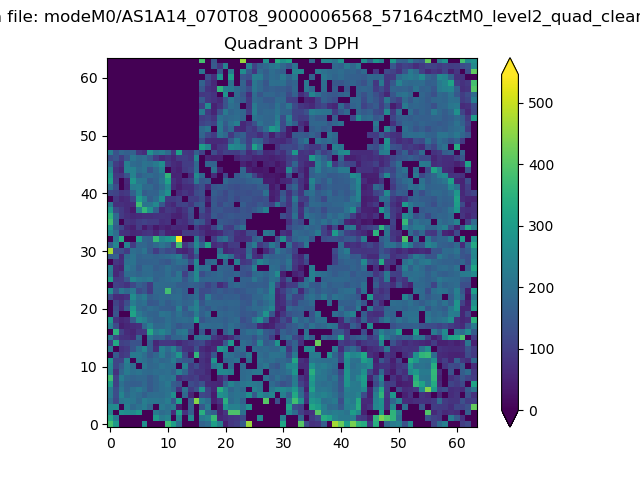 |
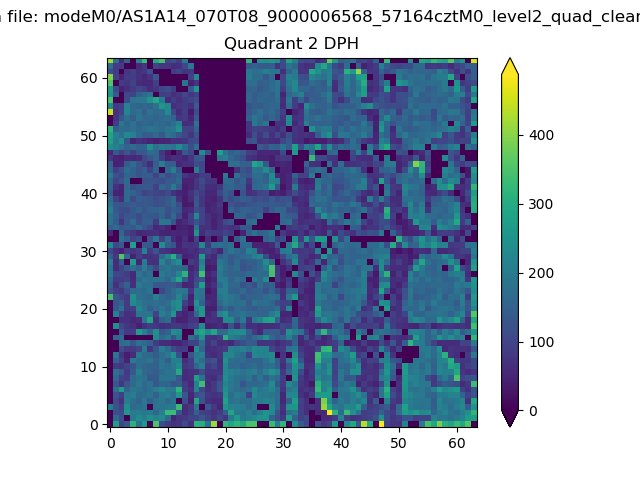 |
Quadrant C |
| Plot type | Count rate plots | Images |
|---|---|---|
| Comparison with Poisson distribution Blue bars denote a histogram of data divided into 1 sec bins. Red curve is a Poisson curve with rate = median count rate of data. |
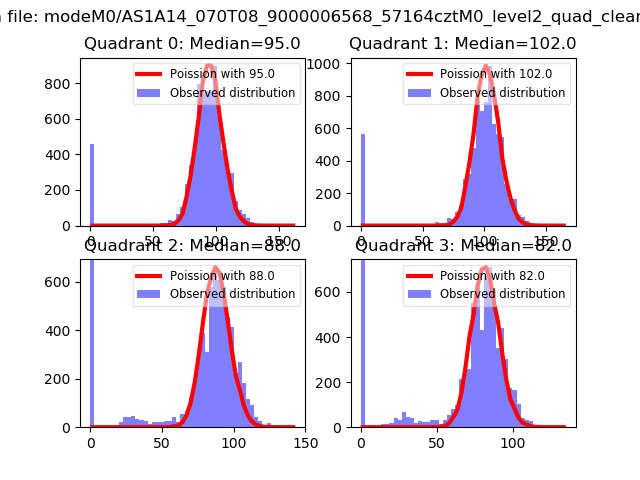 |
 |
| Quadrant-wise count rates Data is divided into 100 sec bins |
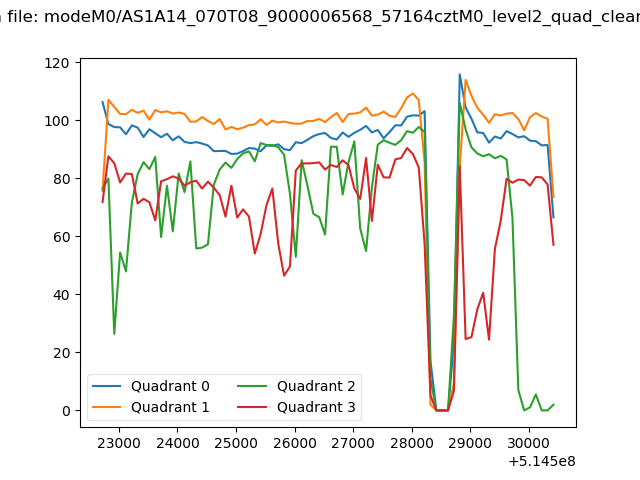 |
|
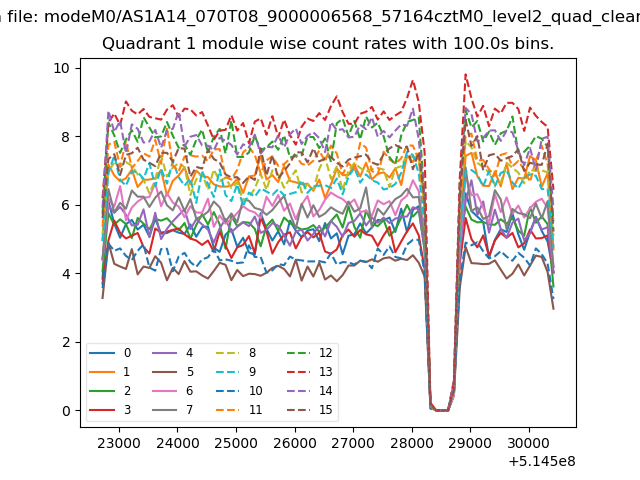
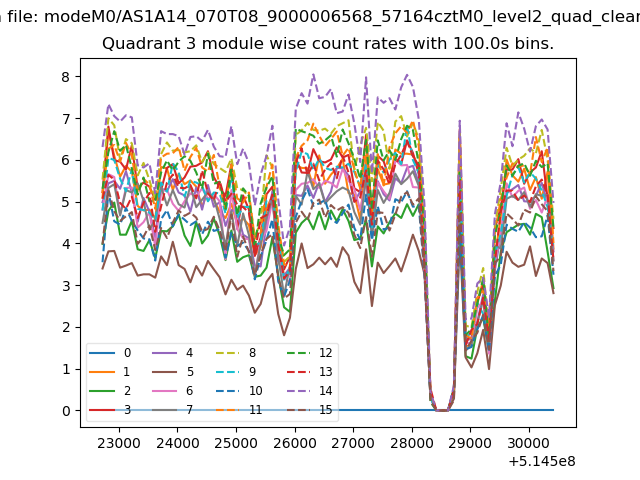
| Module-wise count rates for Quadrant A Data is divided into 100 sec bins |
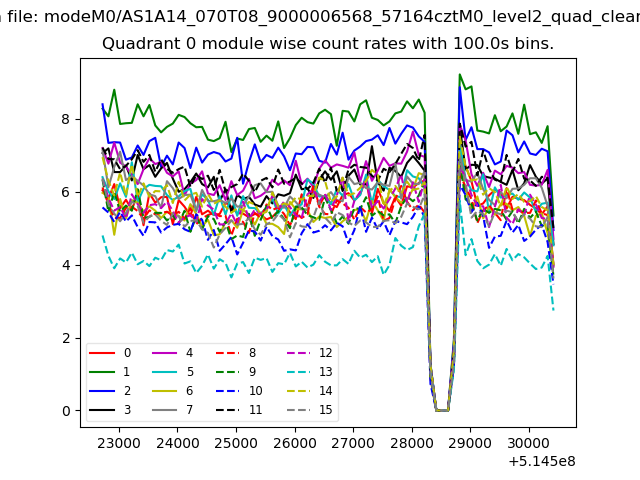 |
 |
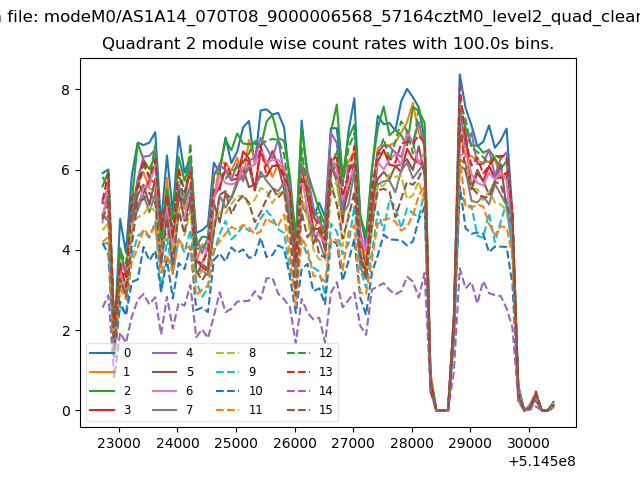
| Module-wise count rates for Quadrant B Data is divided into 100 sec bins |
 |
 |
| Module-wise count rates for Quadrant C Data is divided into 100 sec bins |
 |
 |
| Module-wise count rates for Quadrant D Data is divided into 100 sec bins |
 |
 |
| Parameter | Plot |
|---|---|
| CZT HV Monitor | 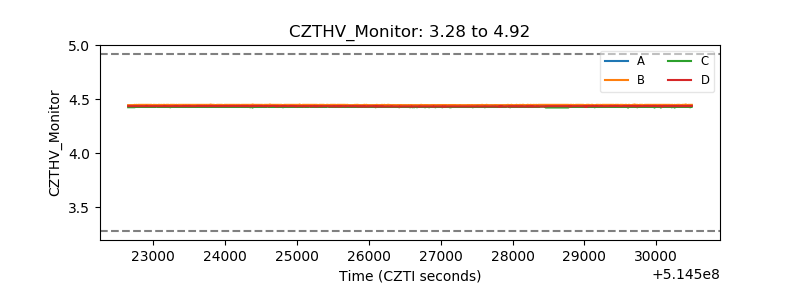 |
| D_VDD | 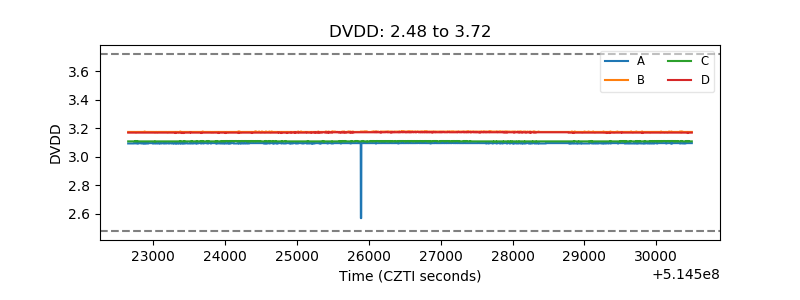 |
| Temperature 1 | 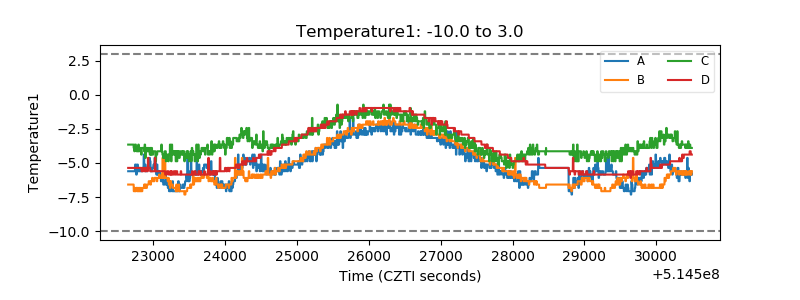 |
| Veto HV Monitor | 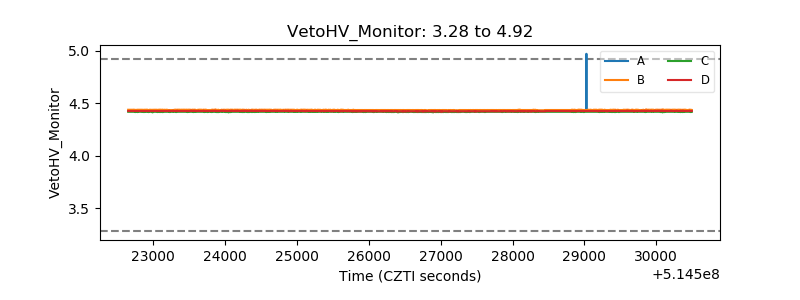 |
| Veto LLD | 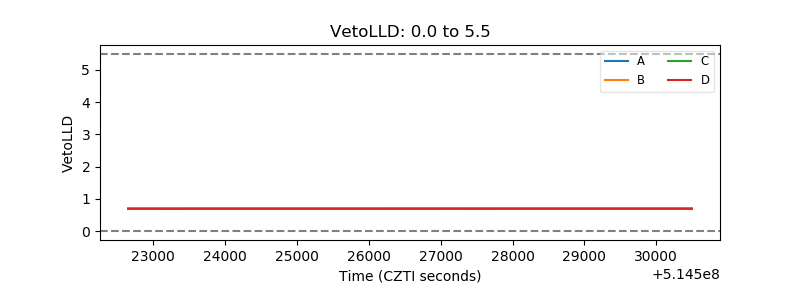 |
| Alpha Counter | 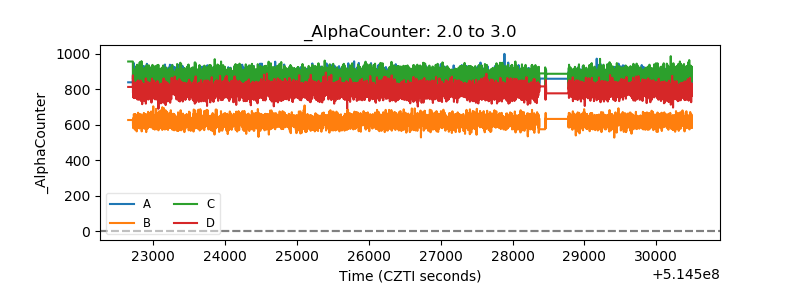 |
| _CPM_Rate | 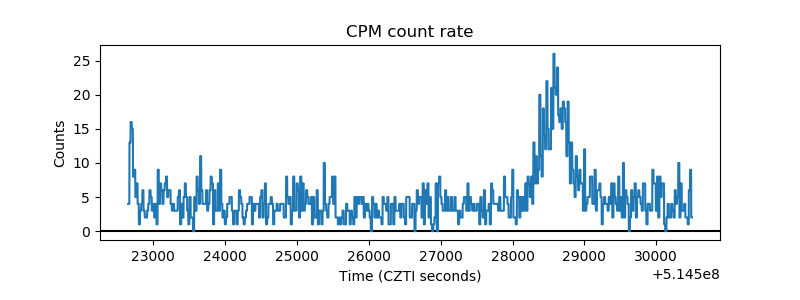 |
| CZT Counter | 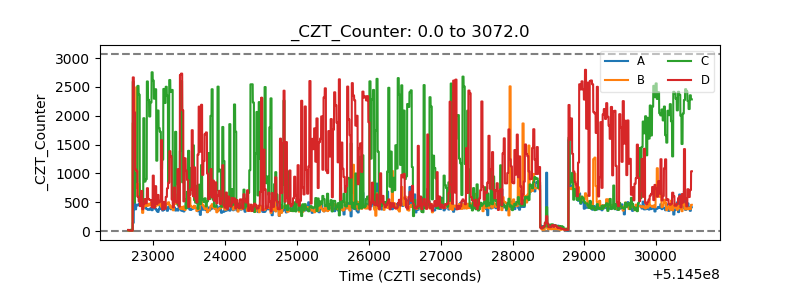 |
| +2.5 Volts monitor |  |
| +5 Volts monitor | 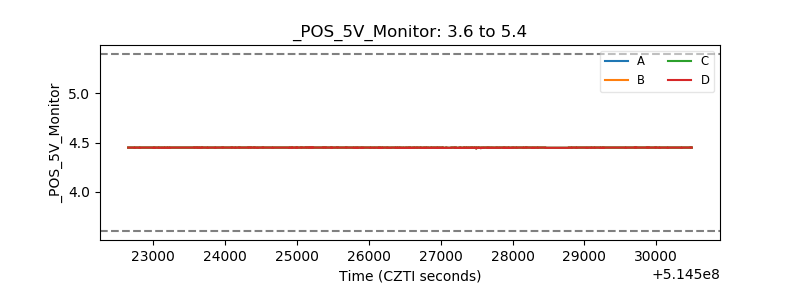 |
| _ROLL_ROT | 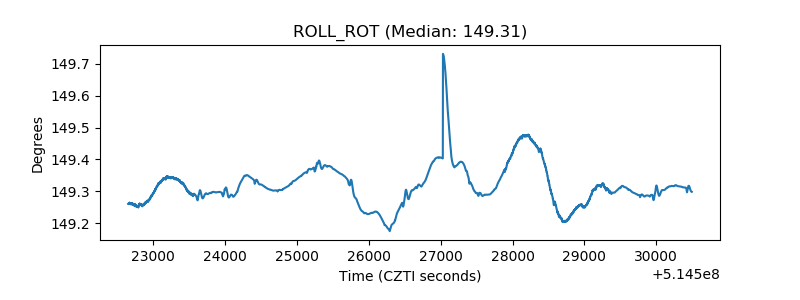 |
| _Roll_DEC | 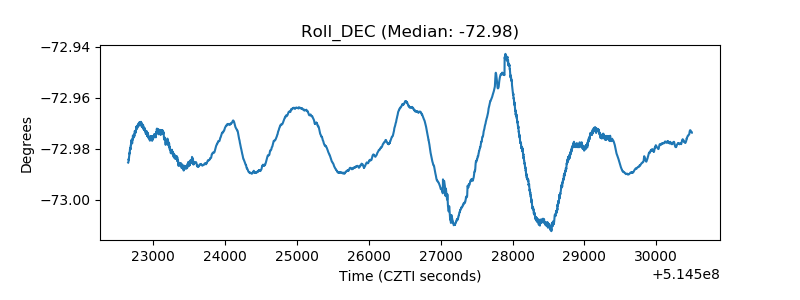 |
| _Roll_RA | 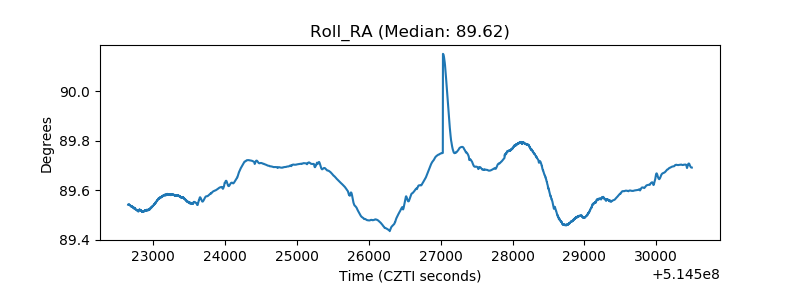 |
| Veto Counter | 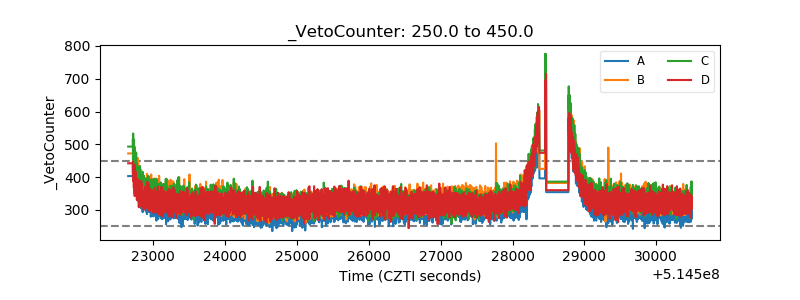 |