| Param | Original file | Final file |
|---|---|---|
| Filename | modeM0/AS1A14_070T08_9000006568_57165cztM0_level2.fits | modeM0/AS1A14_070T08_9000006568_57165cztM0_level2_quad_clean.evt |
| Size (bytes) | 510,621,120 | 95,921,280 |
| Size | 487.0 MB | 91.5 MB |
| Events in quadrant A | 2,924,186 | 656,030 |
| Events in quadrant B | 3,180,283 | 708,281 |
| Events in quadrant C | 7,192,373 | 499,906 |
| Events in quadrant D | 5,062,603 | 554,852 |
| Mode SS | |||
|---|---|---|---|
| Quadrant | BADHDUFLAG | Total packets | Discarded packets |
| A | 0 | 138 | 0 |
| B | 0 | 138 | 0 |
| C | 0 | 138 | 0 |
| D | 0 | 138 | 0 |
| Mode M0 | |||
|---|---|---|---|
| Quadrant | BADHDUFLAG | Total packets | Discarded packets |
| A | 0 | 14184 | 0 |
| B | 0 | 14759 | 0 |
| C | 0 | 26211 | 0 |
| D | 0 | 19952 | 0 |
| Quadrant | Total seconds | Saturated seconds | Saturation percentage |
|---|---|---|---|
| A | 6967 | 13 | 0.186594% |
| B | 6968 | 78 | 1.119403% |
| C | 6968 | 1597 | 22.919059% |
| D | 6968 | 453 | 6.501148% |
Noise dominated data is calculated using 1-second bins in cleaned event files. If a bin has >2000 counts, and if more than 50% of those come from <1% of pixels, then it is considered to be noise-dominated and hence unusable.
| Quadrant | # 1 sec bins | Bins with >0 counts | Bins with >2000 counts | High rate bins dominated by noise | Noise dominated (total time) | Noise dominated (detector-on time) | Marked lightcurve |
|---|---|---|---|---|---|---|---|
| A | 6967 | 6967 | 0 | 0 | 0.00% | 0.00% | 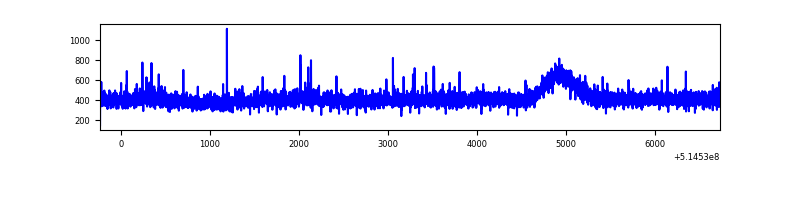 |
| B | 6968 | 6968 | 20 | 20 | 0.29% | 0.29% | 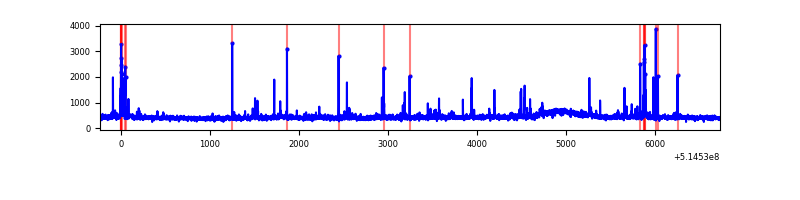 |
| C | 6968 | 6968 | 1033 | 1033 | 14.82% | 14.82% | 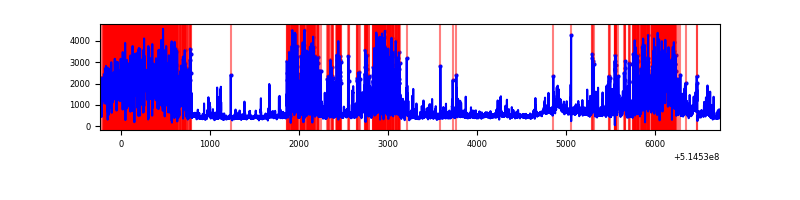 |
| D | 6968 | 6968 | 319 | 319 | 4.58% | 4.58% | 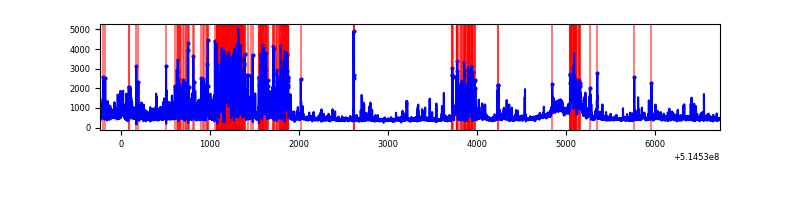 |
Top three noisy pixels from each quadrant. If the there are fewer than three noisy pixels in the level2.evt file, extra rows are filled as -1
| Pixel properties | Quadrant properties | ||||||
|---|---|---|---|---|---|---|---|
| Quadrant | DetID | PixID | Counts | Sigma | Mean | Median | Sigma |
| A | 0 | 12 | 20545 | 108.91 | 739 | 719 | 182.0 |
| A | 8 | 6 | 14782 | 77.25 | 739 | 719 | 182.0 |
| A | 4 | 3 | 11414 | 58.75 | 739 | 719 | 182.0 |
| B | 0 | 213 | 76342 | 480.85 | 733 | 703 | 157.3 |
| B | 5 | 185 | 54083 | 339.34 | 733 | 703 | 157.3 |
| B | 2 | 249 | 28748 | 178.29 | 733 | 703 | 157.3 |
| C | 15 | 224 | 2211858 | 12881.98 | 631 | 622 | 171.7 |
| C | 15 | 198 | 1424621 | 8295.78 | 631 | 622 | 171.7 |
| C | 13 | 3 | 553179 | 3219.03 | 631 | 622 | 171.7 |
| D | 12 | 33 | 1265433 | 6411.84 | 695 | 662 | 197.3 |
| D | 0 | 19 | 292947 | 1481.76 | 695 | 662 | 197.3 |
| D | 7 | 96 | 232540 | 1175.52 | 695 | 662 | 197.3 |
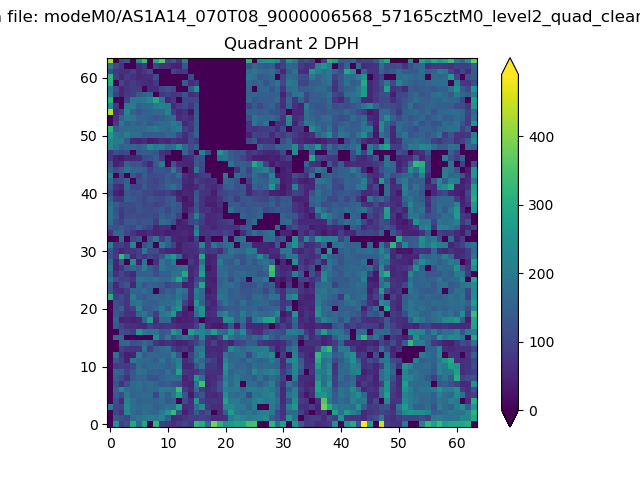
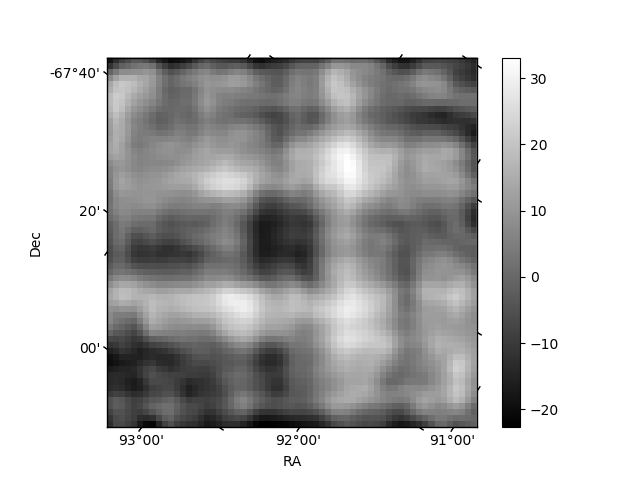
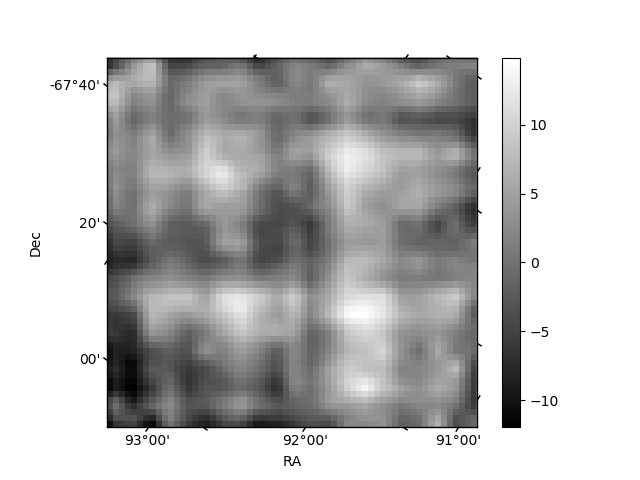
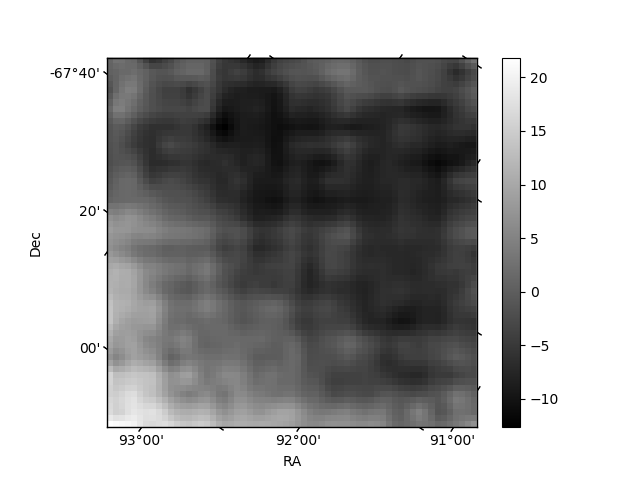
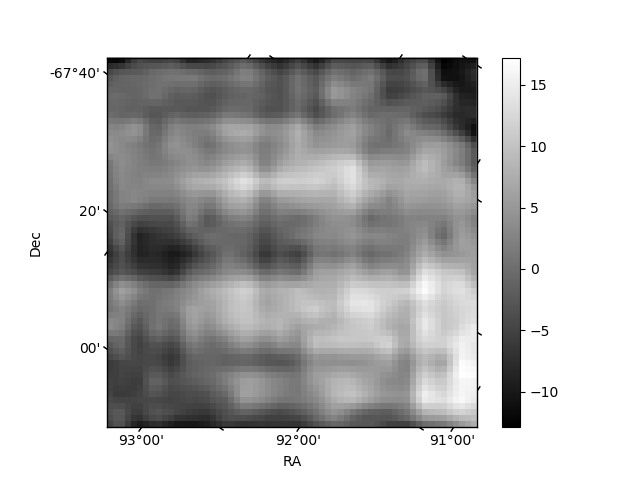
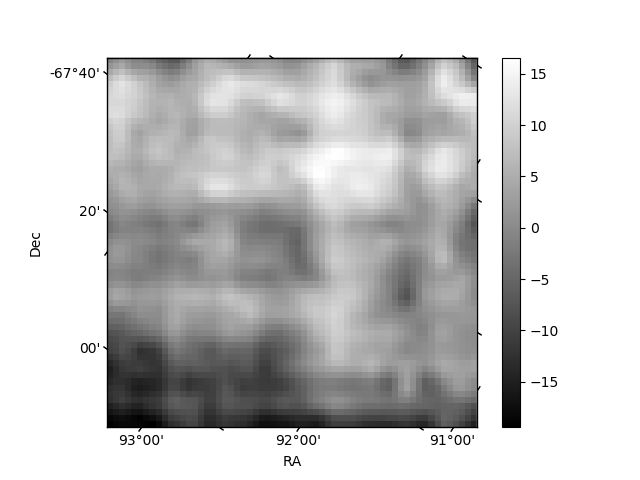
Histogram calculated using DETX and DETY for each event in the final _common_clean file
| Quadrant A | 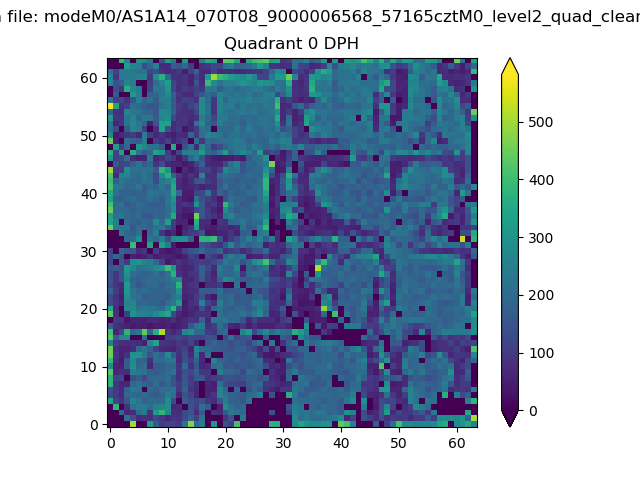 |
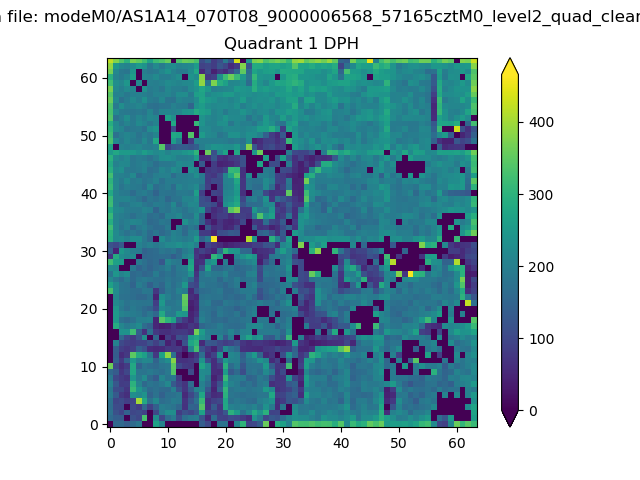 |
Quadrant B |
|---|---|---|---|
| Quadrant D | 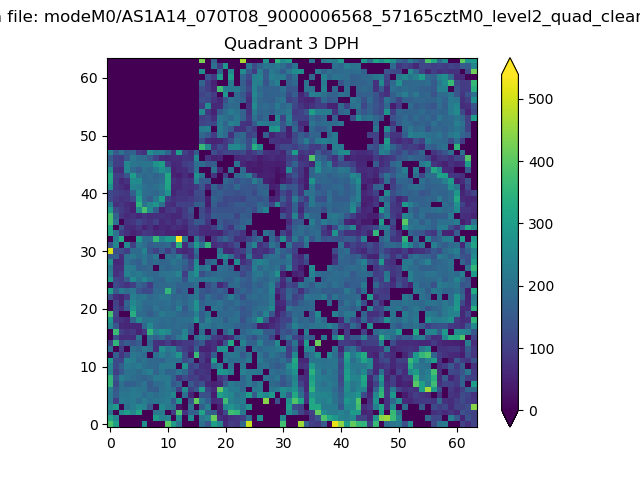 |
 |
Quadrant C |
| Plot type | Count rate plots | Images |
|---|---|---|
| Comparison with Poisson distribution Blue bars denote a histogram of data divided into 1 sec bins. Red curve is a Poisson curve with rate = median count rate of data. |
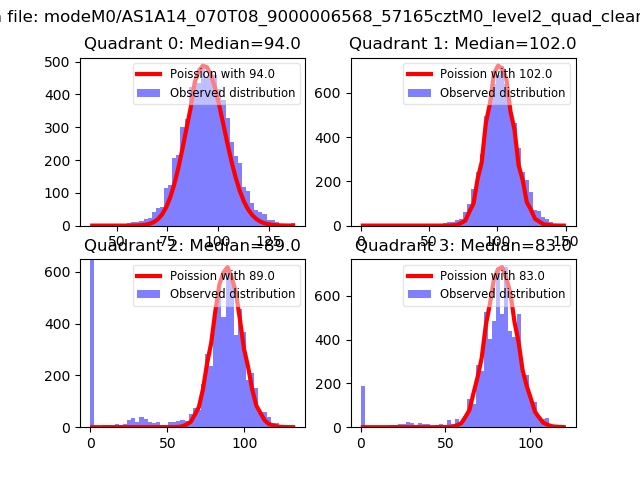 |
 |
| Quadrant-wise count rates Data is divided into 100 sec bins |
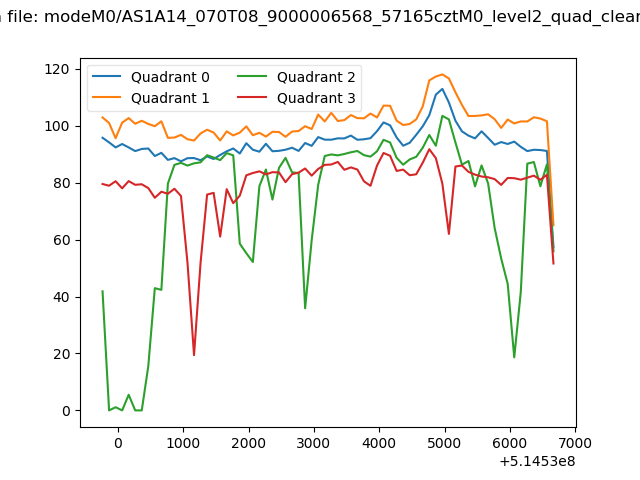 |
|
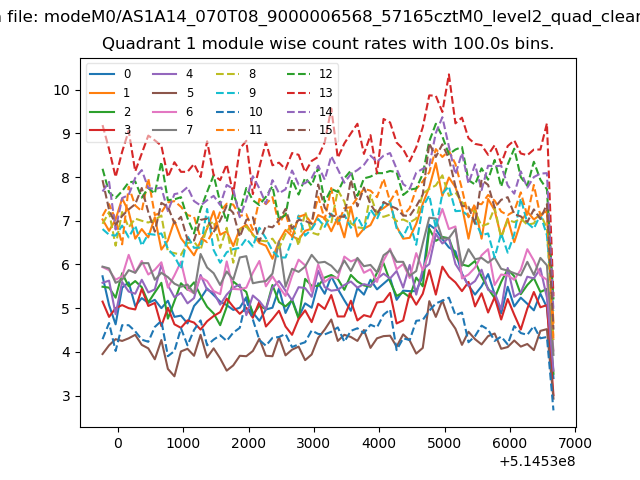
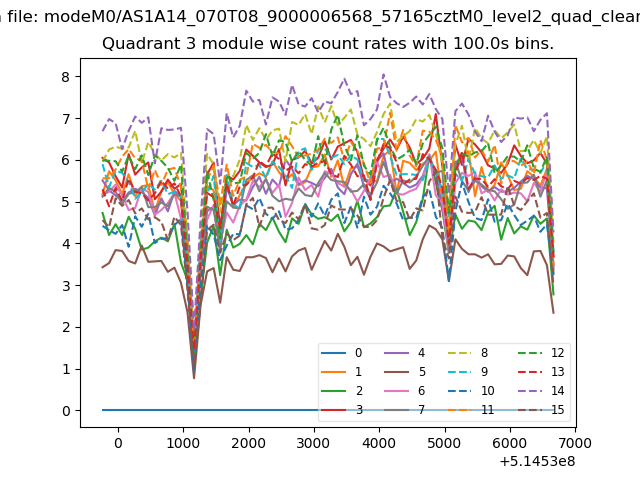
| Module-wise count rates for Quadrant A Data is divided into 100 sec bins |
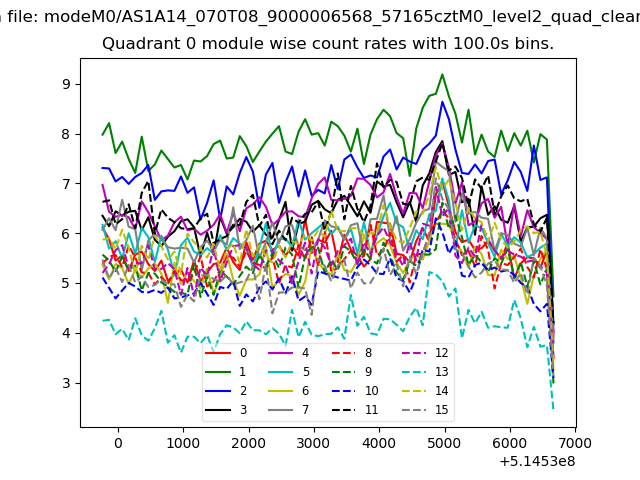 |
 |
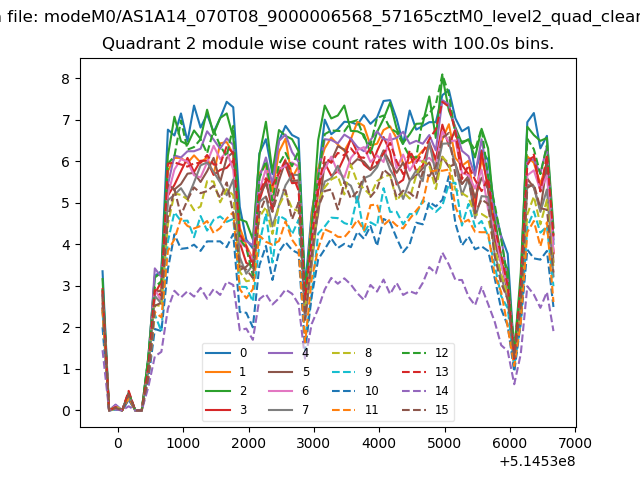
| Module-wise count rates for Quadrant B Data is divided into 100 sec bins |
 |
 |
| Module-wise count rates for Quadrant C Data is divided into 100 sec bins |
 |
 |
| Module-wise count rates for Quadrant D Data is divided into 100 sec bins |
 |
 |
| Parameter | Plot |
|---|---|
| CZT HV Monitor |  |
| D_VDD | 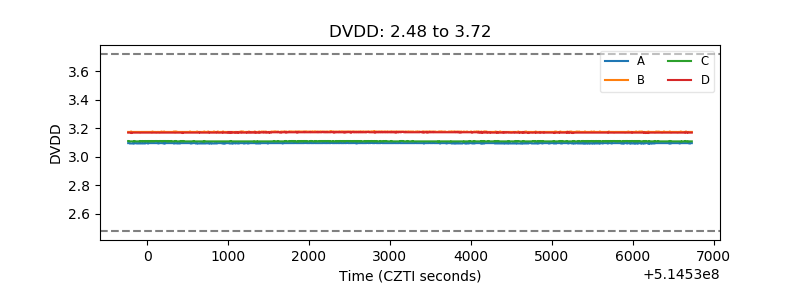 |
| Temperature 1 | 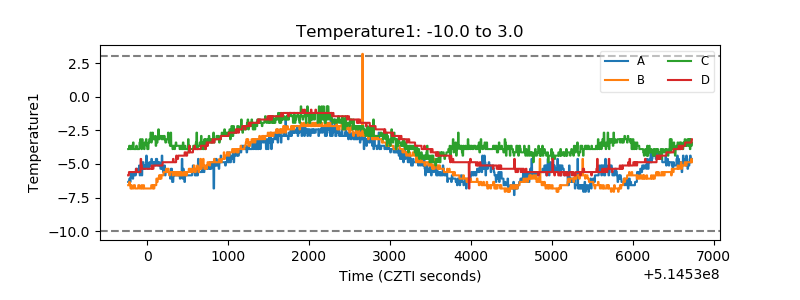 |
| Veto HV Monitor | 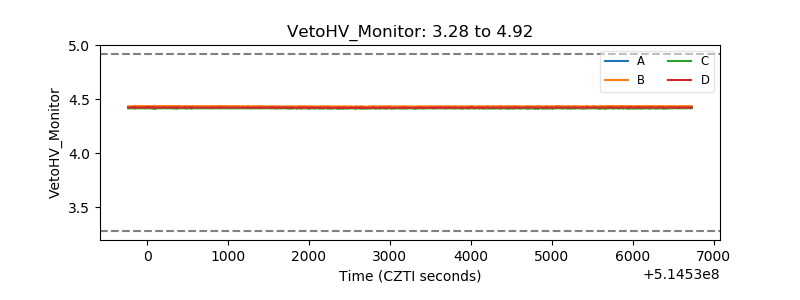 |
| Veto LLD | 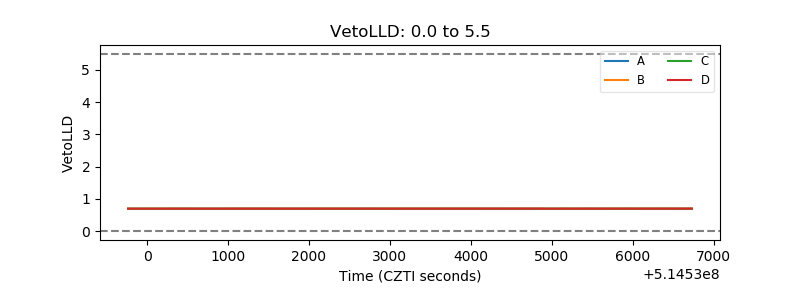 |
| Alpha Counter | 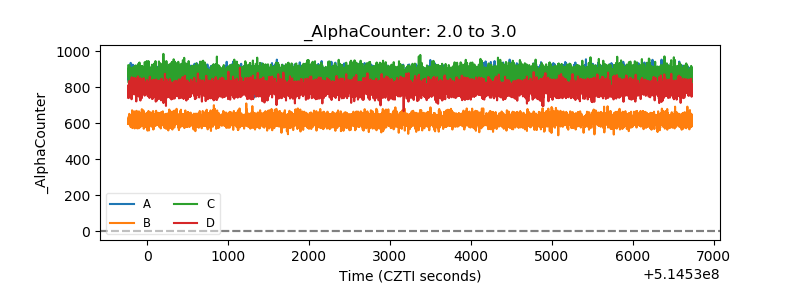 |
| _CPM_Rate | 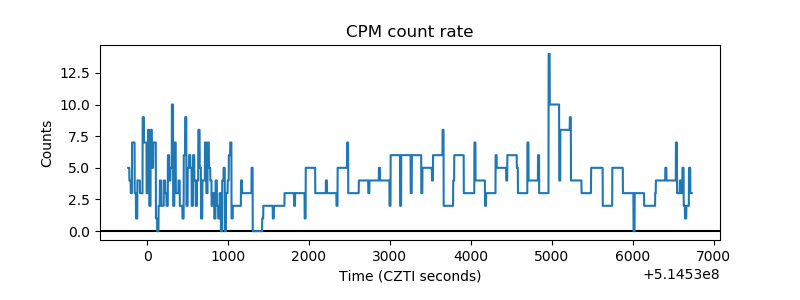 |
| CZT Counter | 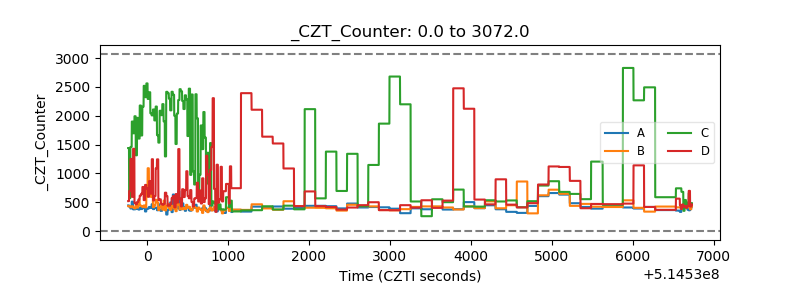 |
| +2.5 Volts monitor |  |
| +5 Volts monitor | 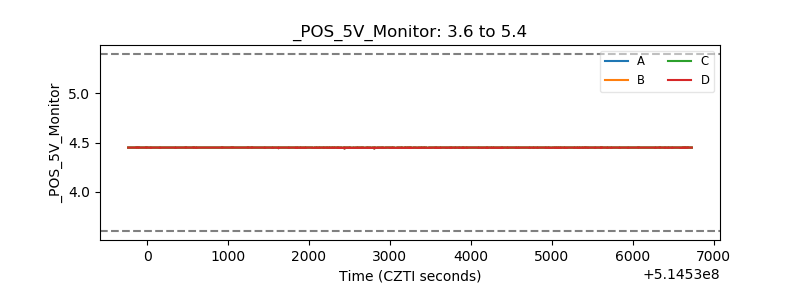 |
| _ROLL_ROT | 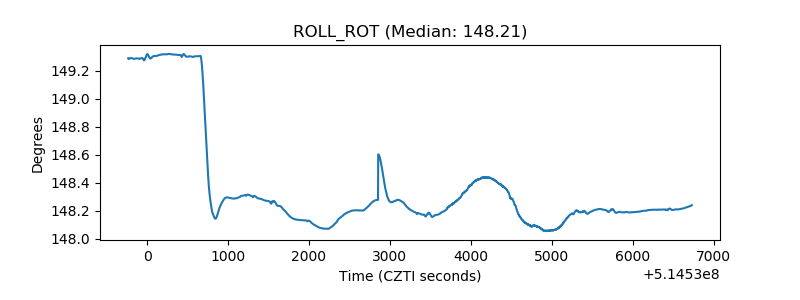 |
| _Roll_DEC | 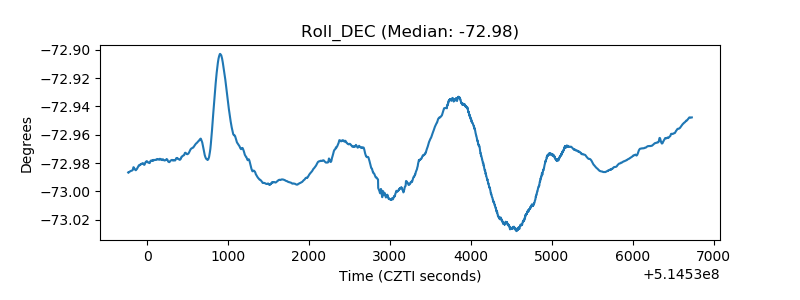 |
| _Roll_RA | 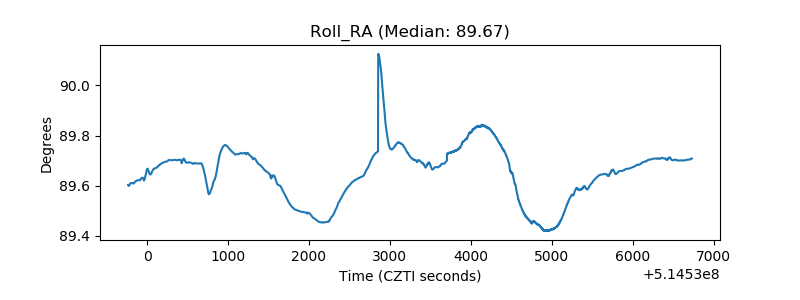 |
| Veto Counter | 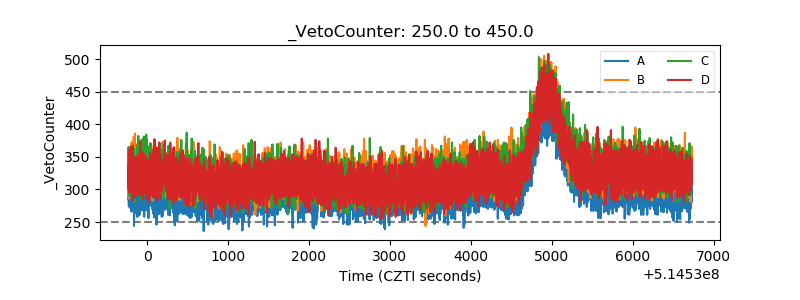 |