| Param | Original file | Final file |
|---|---|---|
| Filename | modeM0/AS1A14_070T08_9000006568_57166cztM0_level2.fits | modeM0/AS1A14_070T08_9000006568_57166cztM0_level2_quad_clean.evt |
| Size (bytes) | 493,911,360 | 103,417,920 |
| Size | 471.0 MB | 98.6 MB |
| Events in quadrant A | 3,079,072 | 691,953 |
| Events in quadrant B | 3,251,032 | 747,336 |
| Events in quadrant C | 7,048,232 | 570,491 |
| Events in quadrant D | 4,331,600 | 609,004 |
| Mode SS | |||
|---|---|---|---|
| Quadrant | BADHDUFLAG | Total packets | Discarded packets |
| A | 0 | 146 | 0 |
| B | 0 | 146 | 0 |
| C | 0 | 146 | 0 |
| D | 0 | 146 | 0 |
| Mode M0 | |||
|---|---|---|---|
| Quadrant | BADHDUFLAG | Total packets | Discarded packets |
| A | 0 | 14875 | 0 |
| B | 0 | 15242 | 0 |
| C | 0 | 26043 | 0 |
| D | 0 | 17997 | 0 |
| Quadrant | Total seconds | Saturated seconds | Saturation percentage |
|---|---|---|---|
| A | 7367 | 12 | 0.162889% |
| B | 7367 | 38 | 0.515814% |
| C | 7368 | 1184 | 16.069490% |
| D | 7368 | 182 | 2.470141% |
Noise dominated data is calculated using 1-second bins in cleaned event files. If a bin has >2000 counts, and if more than 50% of those come from <1% of pixels, then it is considered to be noise-dominated and hence unusable.
| Quadrant | # 1 sec bins | Bins with >0 counts | Bins with >2000 counts | High rate bins dominated by noise | Noise dominated (total time) | Noise dominated (detector-on time) | Marked lightcurve |
|---|---|---|---|---|---|---|---|
| A | 7367 | 7367 | 3 | 3 | 0.04% | 0.04% | 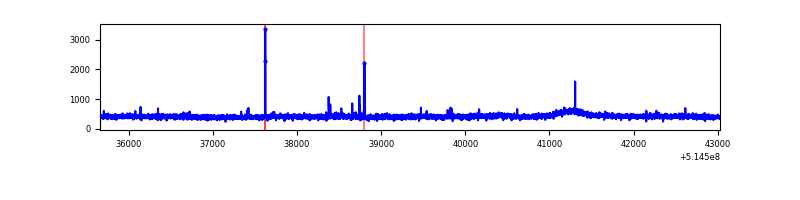 |
| B | 7367 | 7367 | 13 | 13 | 0.18% | 0.18% | 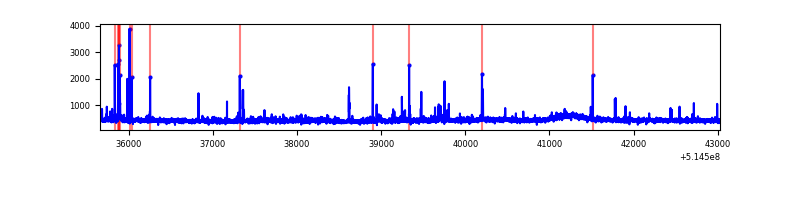 |
| C | 7368 | 7368 | 853 | 853 | 11.58% | 11.58% | 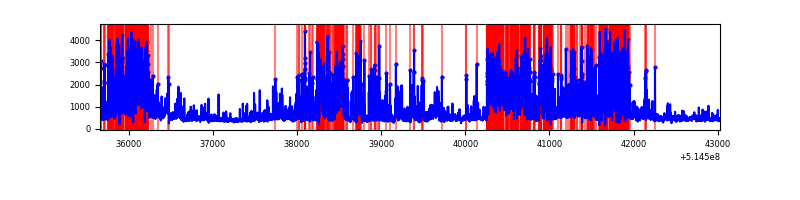 |
| D | 7368 | 7368 | 161 | 161 | 2.19% | 2.19% | 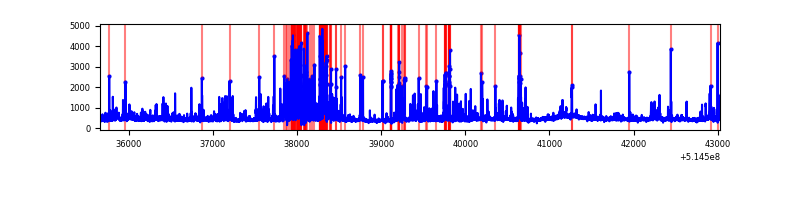 |
Top three noisy pixels from each quadrant. If the there are fewer than three noisy pixels in the level2.evt file, extra rows are filled as -1
| Pixel properties | Quadrant properties | ||||||
|---|---|---|---|---|---|---|---|
| Quadrant | DetID | PixID | Counts | Sigma | Mean | Median | Sigma |
| A | 0 | 12 | 22133 | 111.07 | 776 | 756 | 192.5 |
| A | 3 | 245 | 15723 | 77.76 | 776 | 756 | 192.5 |
| A | 4 | 3 | 14110 | 69.38 | 776 | 756 | 192.5 |
| B | 4 | 201 | 37909 | 223.01 | 772 | 742 | 166.7 |
| B | 10 | 247 | 24925 | 145.11 | 772 | 742 | 166.7 |
| B | 7 | 252 | 23366 | 135.75 | 772 | 742 | 166.7 |
| C | 15 | 224 | 2125235 | 10914.6 | 707 | 701 | 194.7 |
| C | 15 | 198 | 1112557 | 5712.06 | 707 | 701 | 194.7 |
| C | 13 | 3 | 740921 | 3802.81 | 707 | 701 | 194.7 |
| D | 0 | 19 | 395529 | 1866.79 | 744 | 708 | 211.5 |
| D | 2 | 249 | 319936 | 1509.38 | 744 | 708 | 211.5 |
| D | 8 | 240 | 247104 | 1165.01 | 744 | 708 | 211.5 |
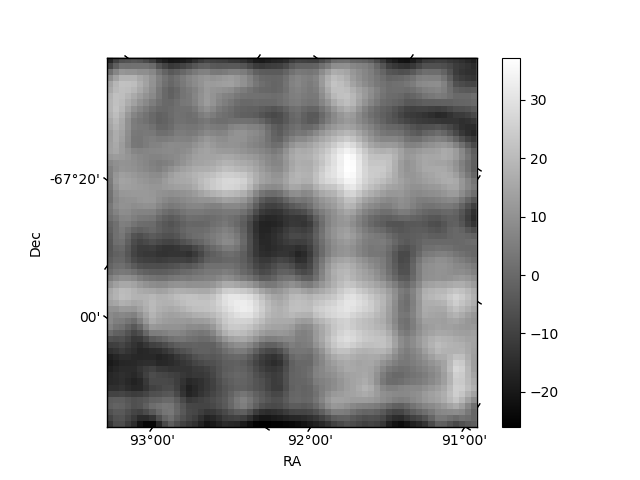
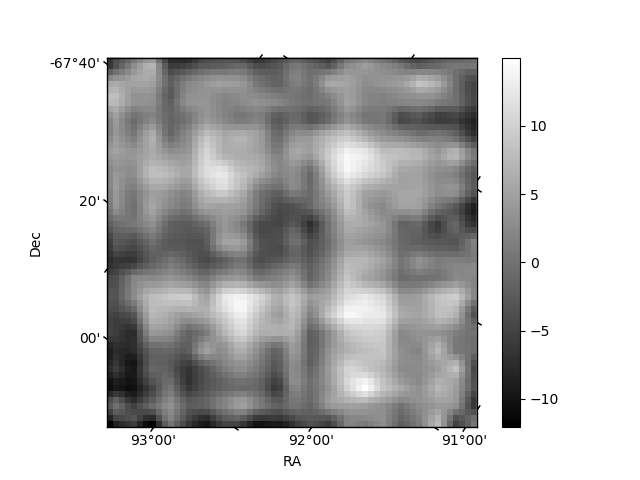
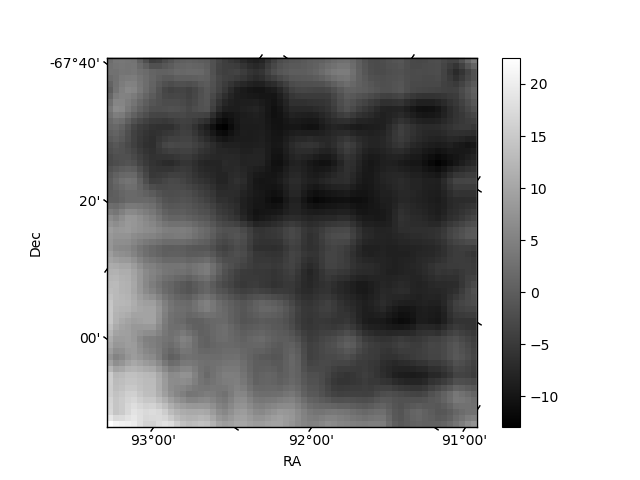
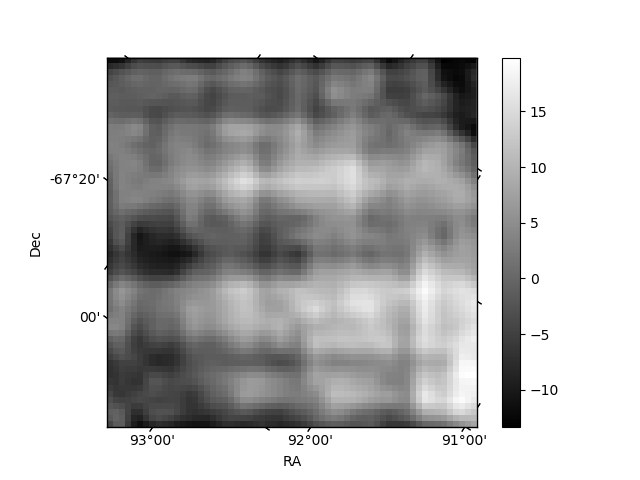
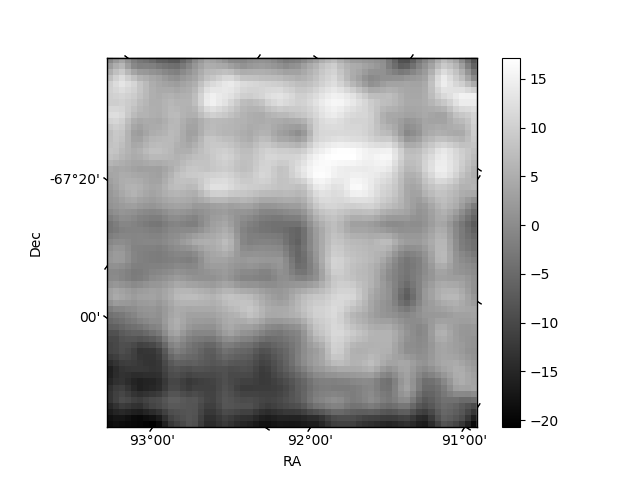
Histogram calculated using DETX and DETY for each event in the final _common_clean file
| Quadrant A | 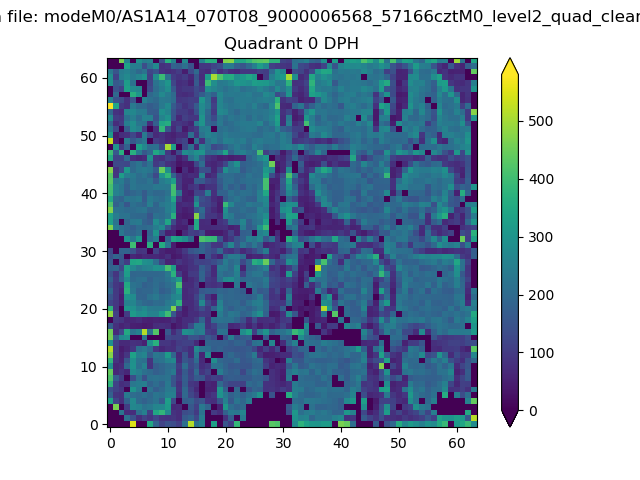 |
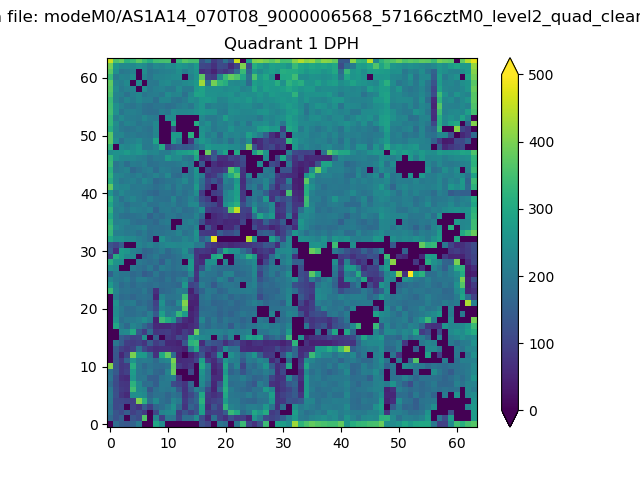 |
Quadrant B |
|---|---|---|---|
| Quadrant D | 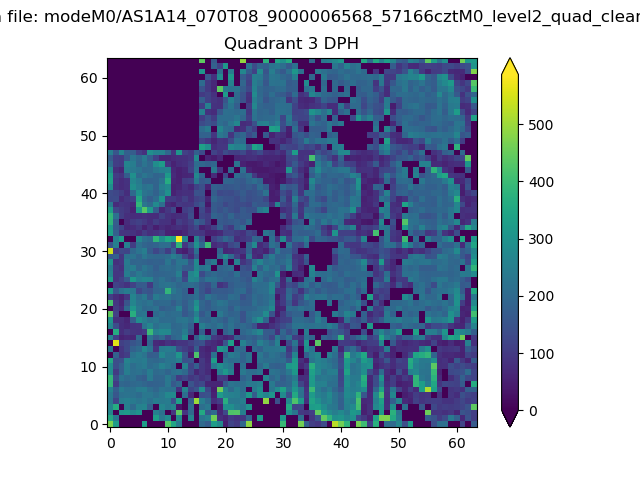 |
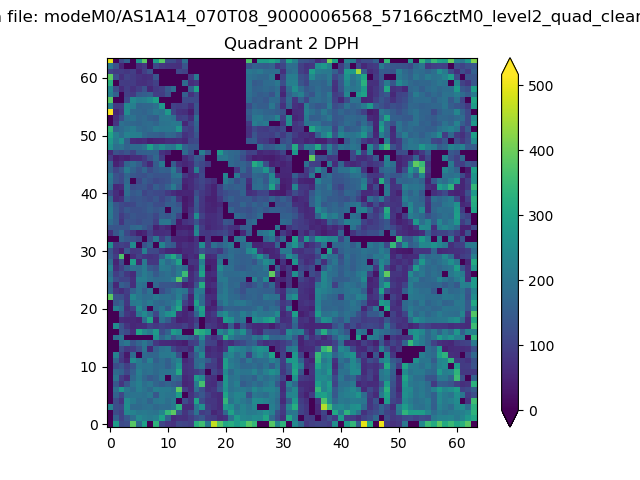 |
Quadrant C |
| Plot type | Count rate plots | Images |
|---|---|---|
| Comparison with Poisson distribution Blue bars denote a histogram of data divided into 1 sec bins. Red curve is a Poisson curve with rate = median count rate of data. |
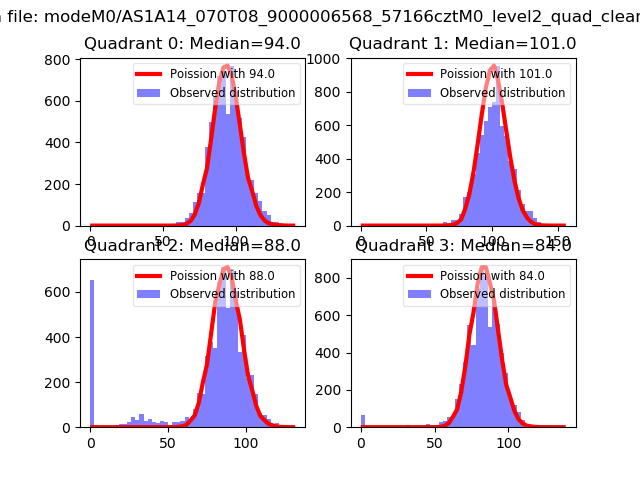 |
 |
| Quadrant-wise count rates Data is divided into 100 sec bins |
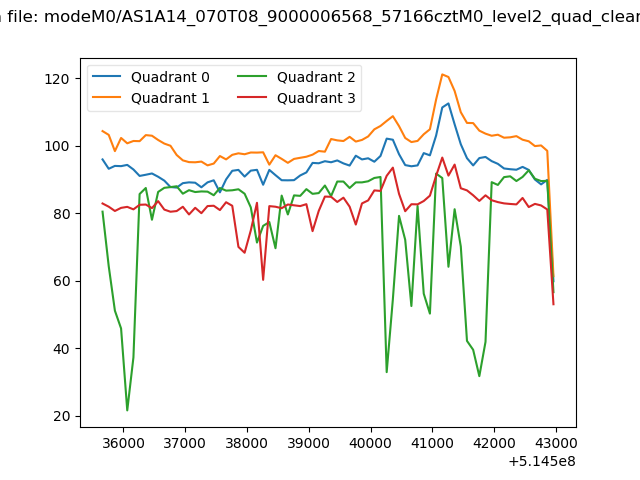 |
|
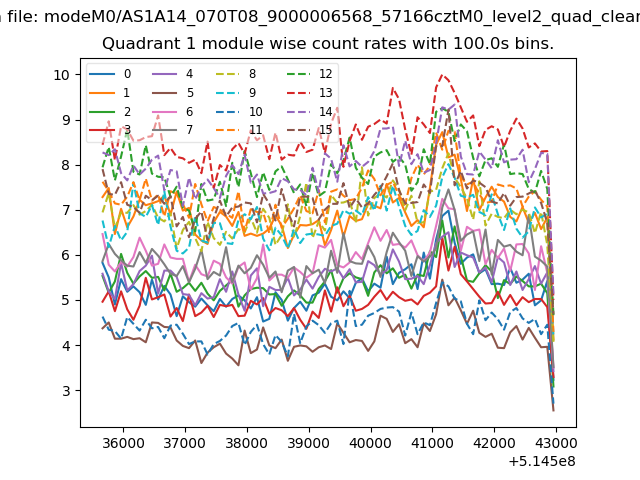
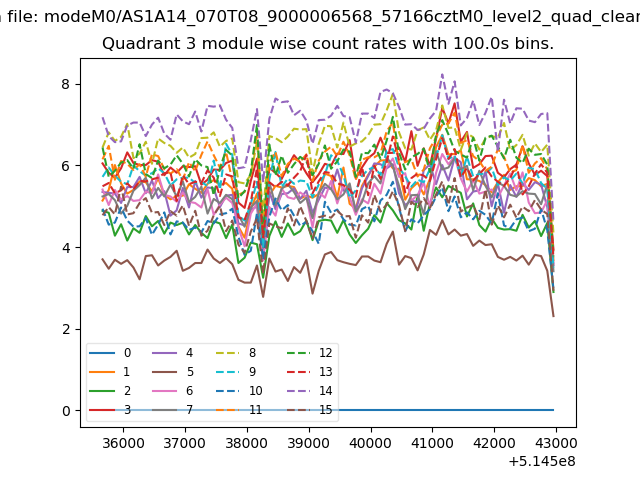
| Module-wise count rates for Quadrant A Data is divided into 100 sec bins |
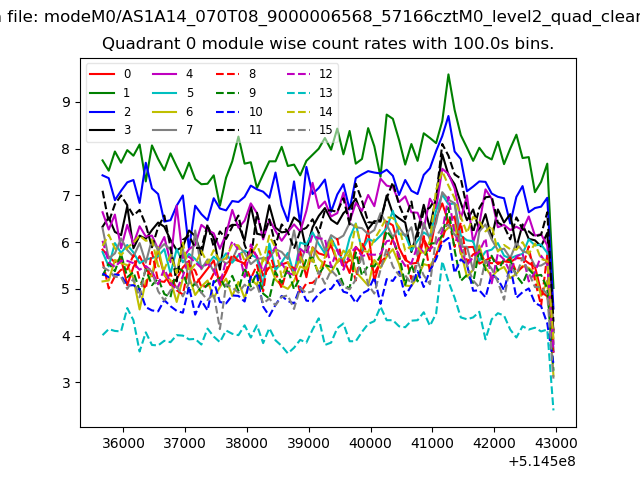 |
 |
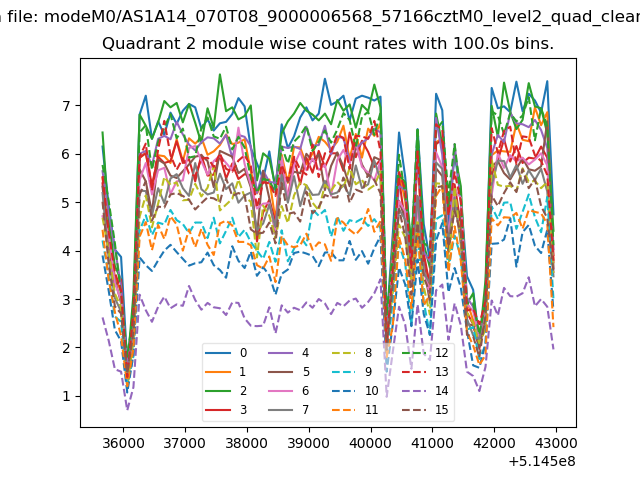
| Module-wise count rates for Quadrant B Data is divided into 100 sec bins |
 |
 |
| Module-wise count rates for Quadrant C Data is divided into 100 sec bins |
 |
 |
| Module-wise count rates for Quadrant D Data is divided into 100 sec bins |
 |
 |
| Parameter | Plot |
|---|---|
| CZT HV Monitor |  |
| D_VDD | 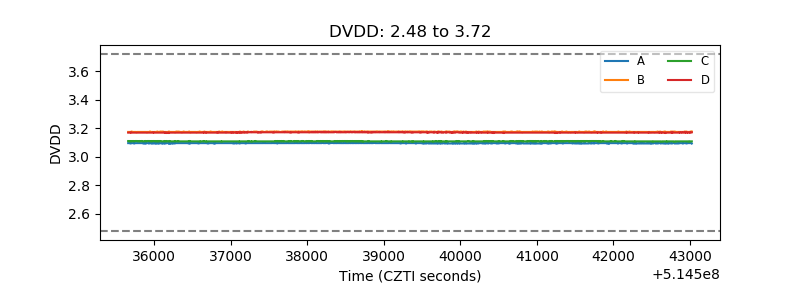 |
| Temperature 1 | 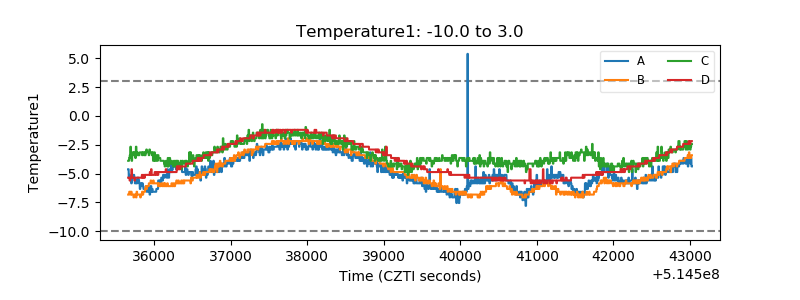 |
| Veto HV Monitor | 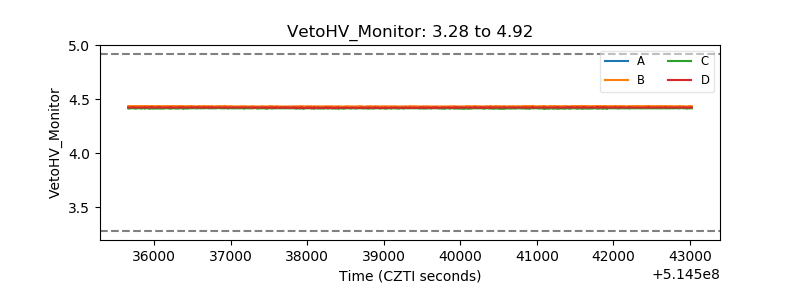 |
| Veto LLD | 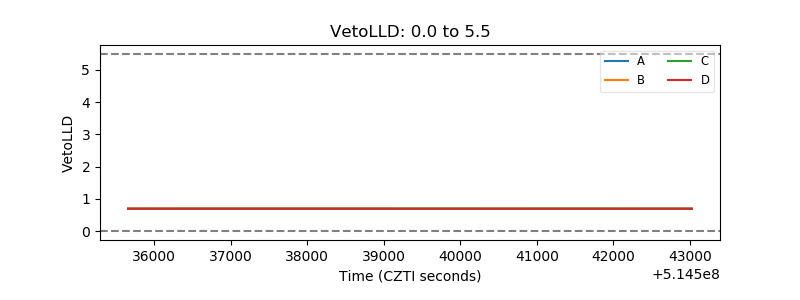 |
| Alpha Counter | 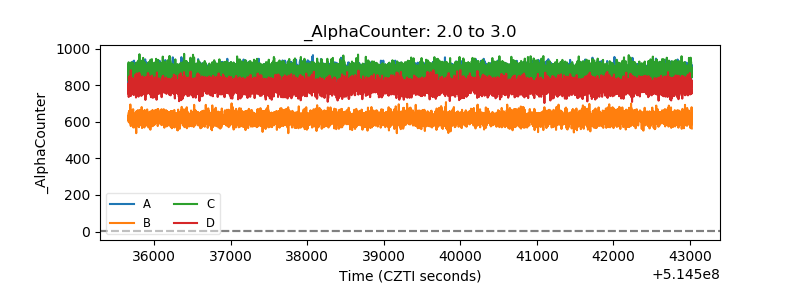 |
| _CPM_Rate | 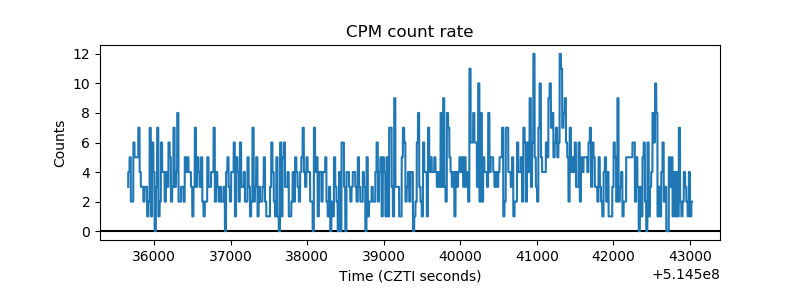 |
| CZT Counter | 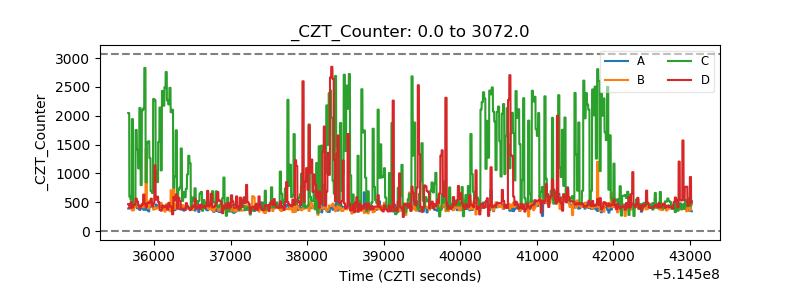 |
| +2.5 Volts monitor |  |
| +5 Volts monitor |  |
| _ROLL_ROT | 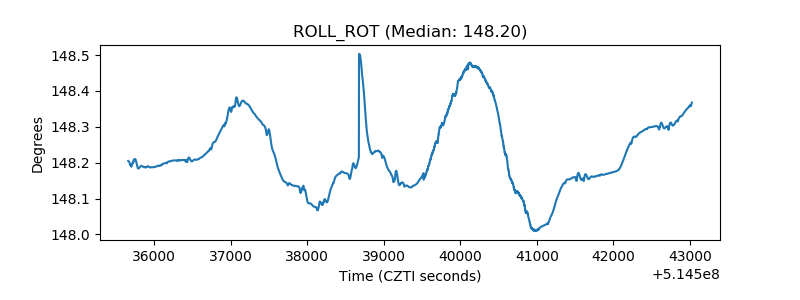 |
| _Roll_DEC | 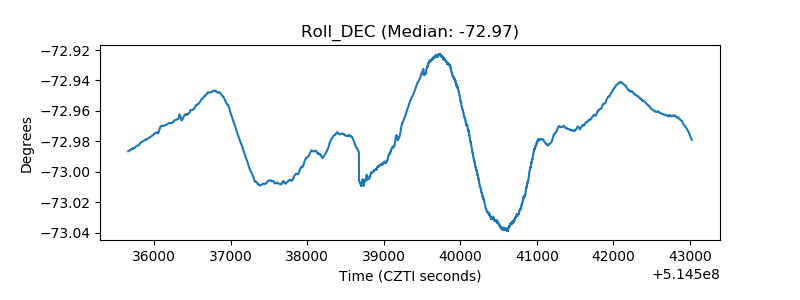 |
| _Roll_RA | 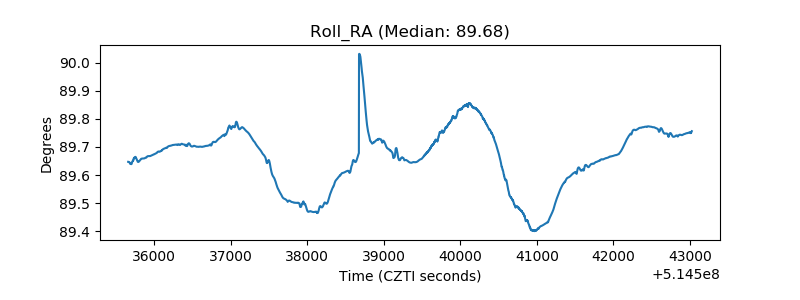 |
| Veto Counter | 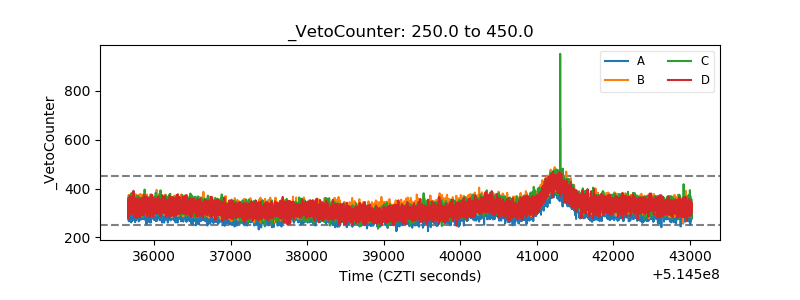 |