| Param | Original file | Final file |
|---|---|---|
| Filename | modeM0/AS1A14_070T08_9000006568_57169cztM0_level2.fits | modeM0/AS1A14_070T08_9000006568_57169cztM0_level2_quad_clean.evt |
| Size (bytes) | 572,788,800 | 128,882,880 |
| Size | 546.3 MB | 122.9 MB |
| Events in quadrant A | 3,880,534 | 850,739 |
| Events in quadrant B | 4,065,425 | 915,697 |
| Events in quadrant C | 6,884,051 | 753,306 |
| Events in quadrant D | 5,660,980 | 746,994 |
| Mode SS | |||
|---|---|---|---|
| Quadrant | BADHDUFLAG | Total packets | Discarded packets |
| A | 0 | 184 | 0 |
| B | 0 | 184 | 0 |
| C | 0 | 184 | 0 |
| D | 0 | 184 | 0 |
| Mode M0 | |||
|---|---|---|---|
| Quadrant | BADHDUFLAG | Total packets | Discarded packets |
| A | 0 | 18742 | 0 |
| B | 0 | 19016 | 0 |
| C | 0 | 26953 | 0 |
| D | 0 | 23338 | 0 |
| Quadrant | Total seconds | Saturated seconds | Saturation percentage |
|---|---|---|---|
| A | 9157 | 107 | 1.168505% |
| B | 9158 | 183 | 1.998253% |
| C | 9158 | 920 | 10.045862% |
| D | 9158 | 382 | 4.171216% |
Noise dominated data is calculated using 1-second bins in cleaned event files. If a bin has >2000 counts, and if more than 50% of those come from <1% of pixels, then it is considered to be noise-dominated and hence unusable.
| Quadrant | # 1 sec bins | Bins with >0 counts | Bins with >2000 counts | High rate bins dominated by noise | Noise dominated (total time) | Noise dominated (detector-on time) | Marked lightcurve |
|---|---|---|---|---|---|---|---|
| A | 9157 | 9157 | 4 | 4 | 0.04% | 0.04% | 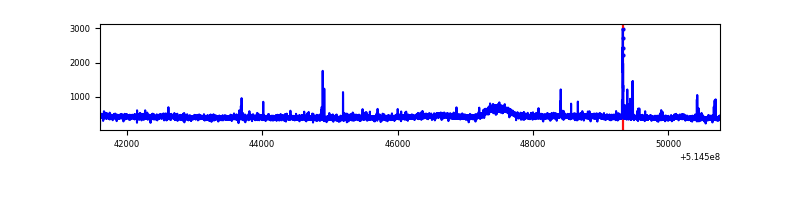 |
| B | 9158 | 9158 | 12 | 12 | 0.13% | 0.13% | 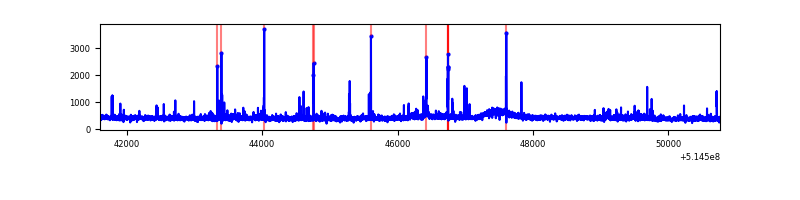 |
| C | 9158 | 9158 | 518 | 518 | 5.66% | 5.66% | 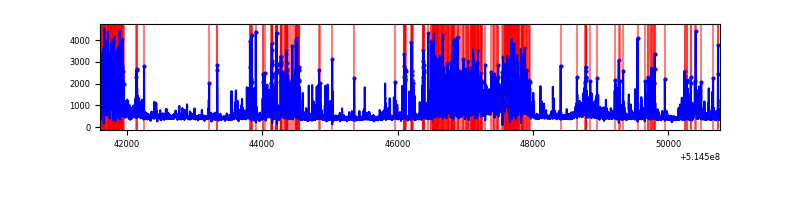 |
| D | 9158 | 9158 | 338 | 338 | 3.69% | 3.69% | 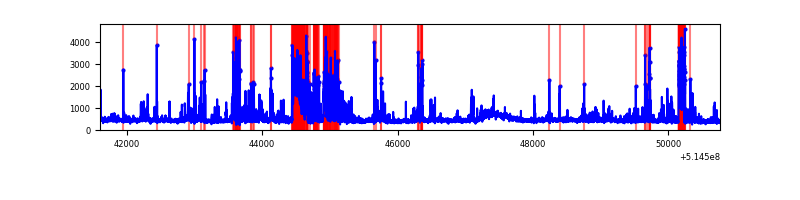 |
Top three noisy pixels from each quadrant. If the there are fewer than three noisy pixels in the level2.evt file, extra rows are filled as -1
| Pixel properties | Quadrant properties | ||||||
|---|---|---|---|---|---|---|---|
| Quadrant | DetID | PixID | Counts | Sigma | Mean | Median | Sigma |
| A | 13 | 248 | 34445 | 138.07 | 974 | 948 | 242.6 |
| A | 0 | 12 | 31510 | 125.98 | 974 | 948 | 242.6 |
| A | 10 | 251 | 18089 | 70.66 | 974 | 948 | 242.6 |
| B | 5 | 185 | 78562 | 377.05 | 960 | 922 | 205.9 |
| B | 4 | 201 | 32844 | 155.02 | 960 | 922 | 205.9 |
| B | 12 | 111 | 25623 | 119.96 | 960 | 922 | 205.9 |
| C | 15 | 224 | 1768306 | 7164.82 | 906 | 895 | 246.7 |
| C | 15 | 198 | 1171947 | 4747.27 | 906 | 895 | 246.7 |
| C | 14 | 67 | 143382 | 577.62 | 906 | 895 | 246.7 |
| D | 0 | 19 | 469384 | 1776.82 | 933 | 890 | 263.7 |
| D | 8 | 240 | 339052 | 1282.52 | 933 | 890 | 263.7 |
| D | 2 | 249 | 323093 | 1221.99 | 933 | 890 | 263.7 |
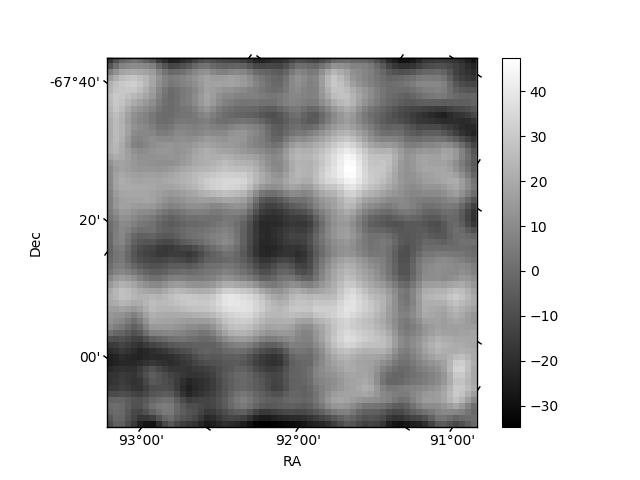
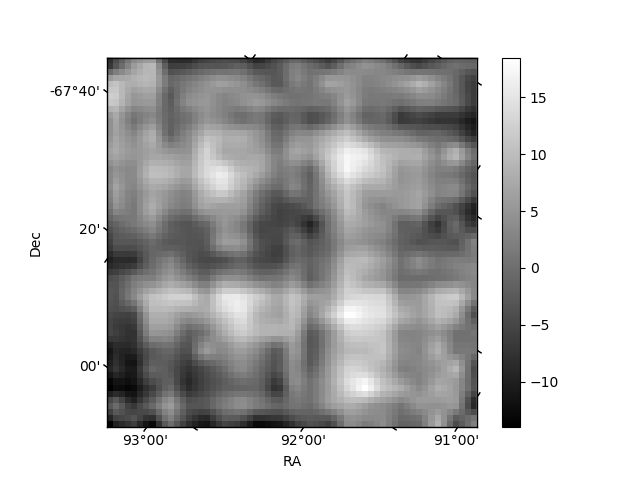
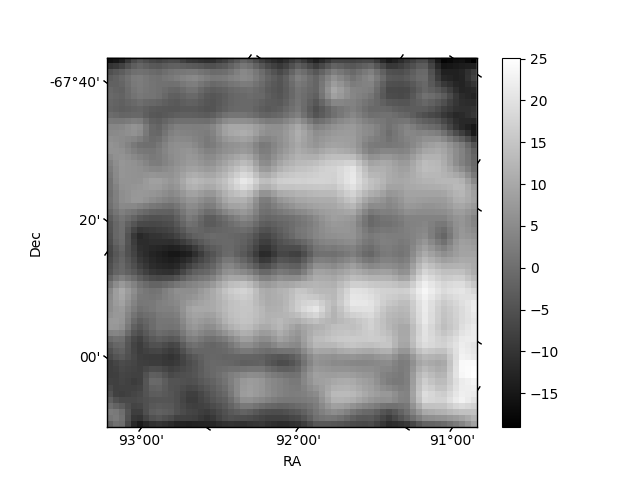
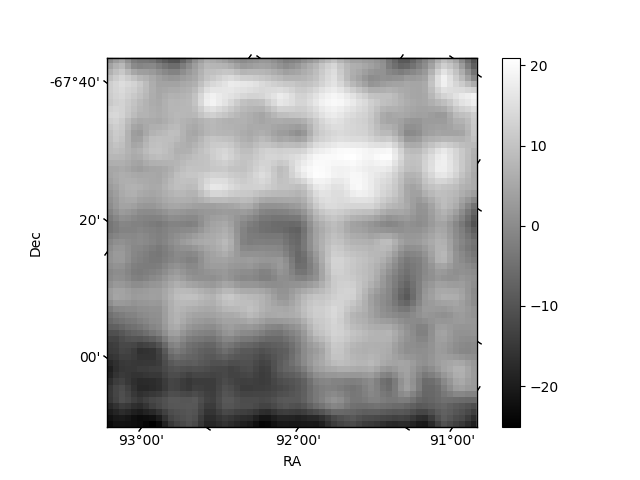
Histogram calculated using DETX and DETY for each event in the final _common_clean file
| Quadrant A | 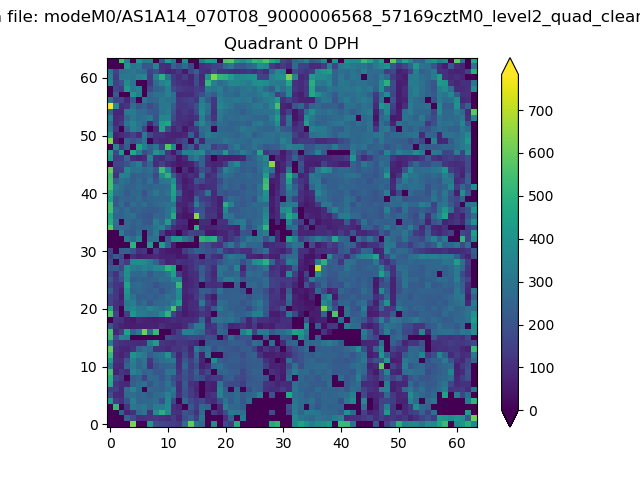 |
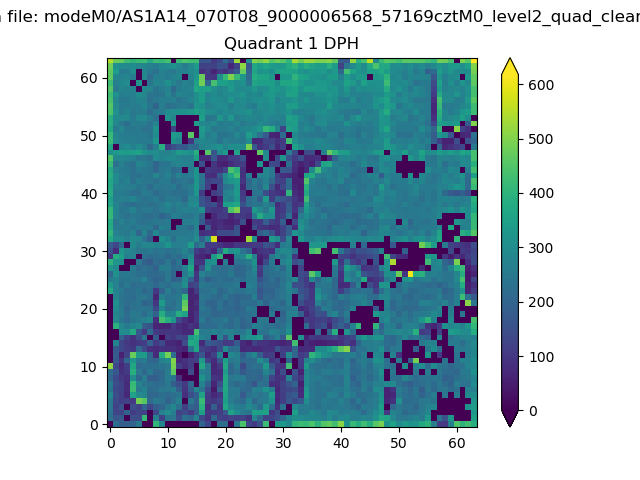 |
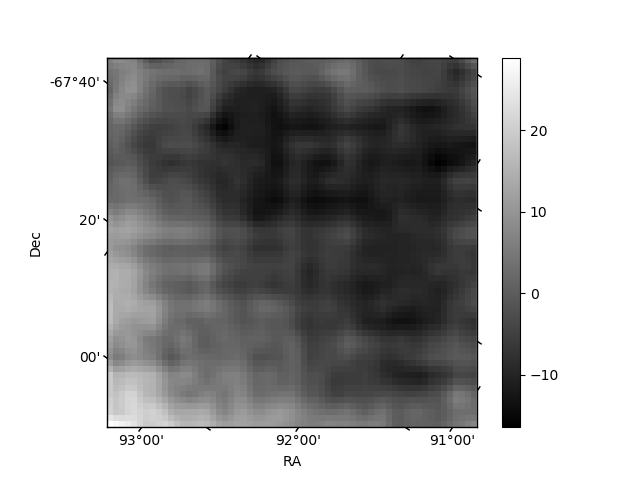
Quadrant B |
|---|---|---|---|
| Quadrant D | 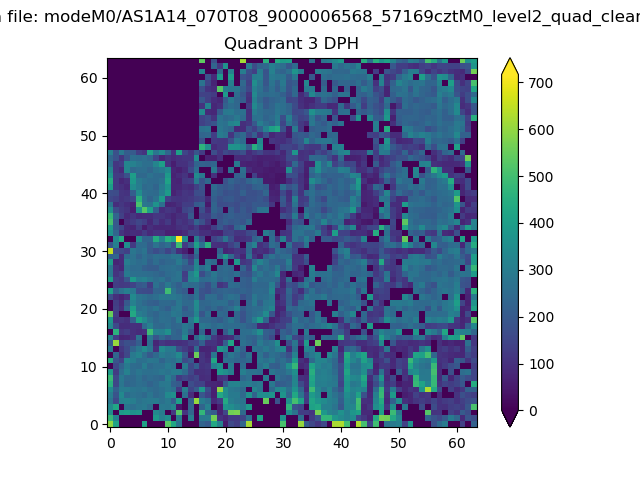 |
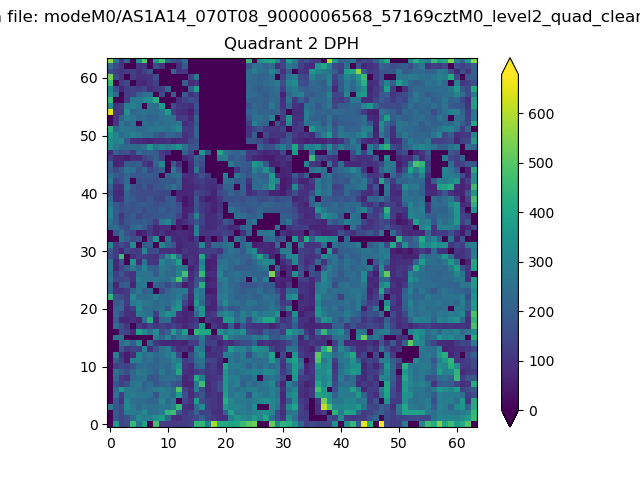 |
Quadrant C |
| Plot type | Count rate plots | Images |
|---|---|---|
| Comparison with Poisson distribution Blue bars denote a histogram of data divided into 1 sec bins. Red curve is a Poisson curve with rate = median count rate of data. |
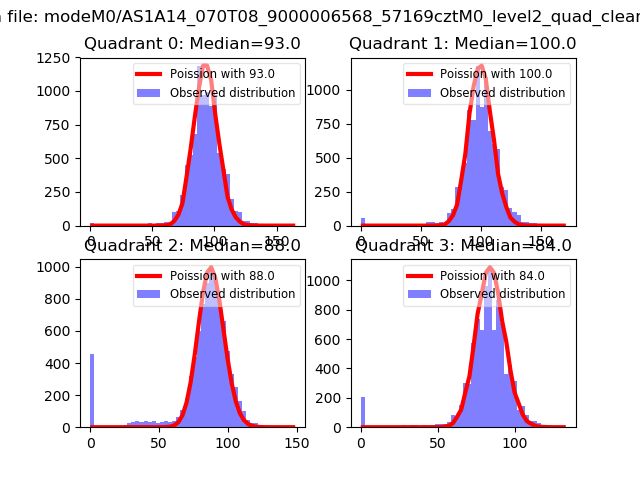 |
 |
| Quadrant-wise count rates Data is divided into 100 sec bins |
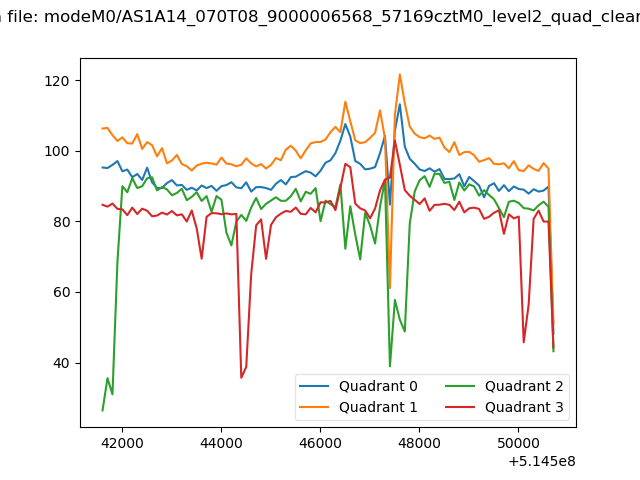 |
|
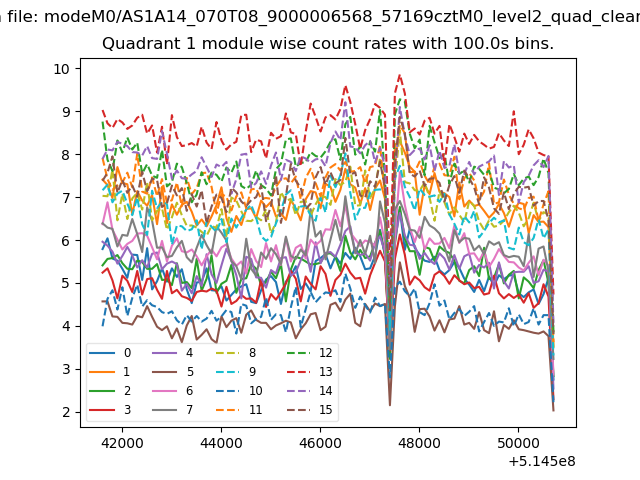
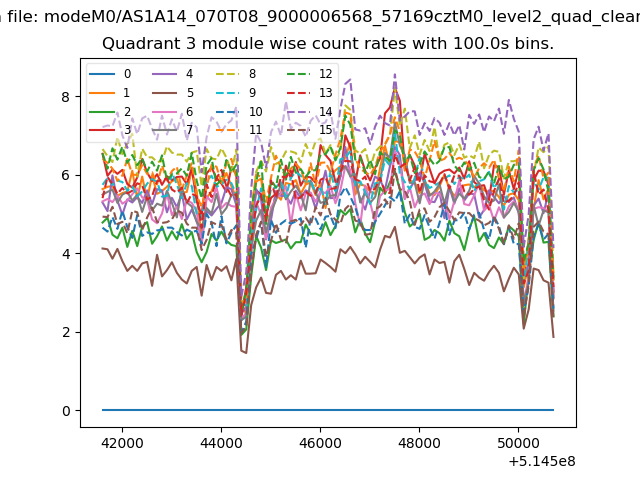
| Module-wise count rates for Quadrant A Data is divided into 100 sec bins |
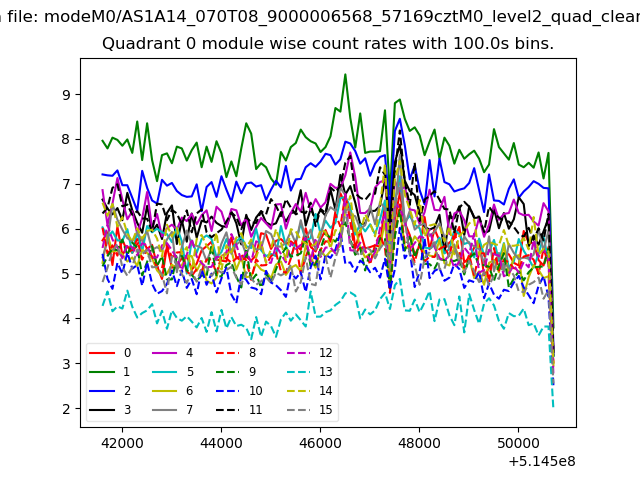 |
 |
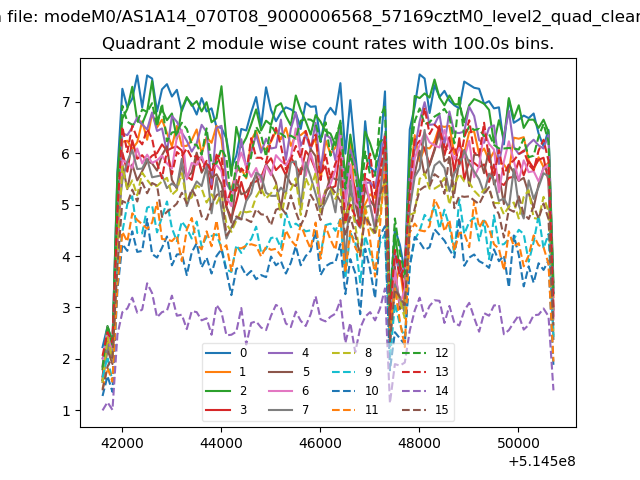
| Module-wise count rates for Quadrant B Data is divided into 100 sec bins |
 |
 |
| Module-wise count rates for Quadrant C Data is divided into 100 sec bins |
 |
 |
| Module-wise count rates for Quadrant D Data is divided into 100 sec bins |
 |
 |
| Parameter | Plot |
|---|---|
| CZT HV Monitor | 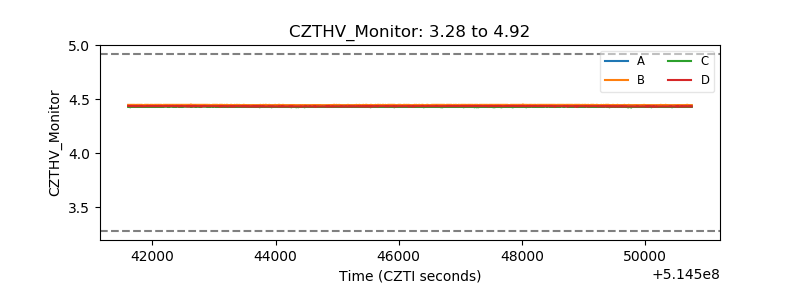 |
| D_VDD | 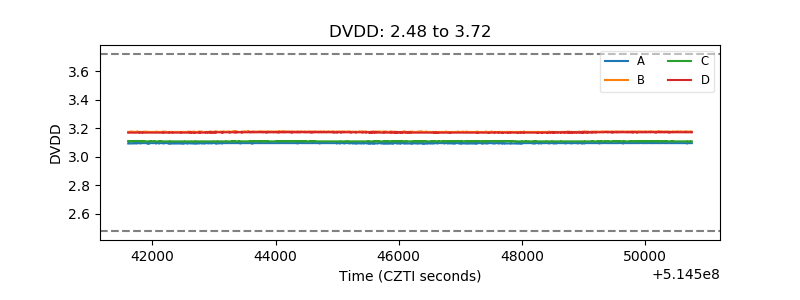 |
| Temperature 1 | 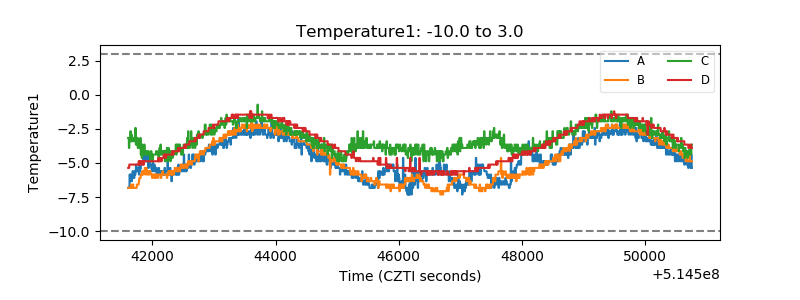 |
| Veto HV Monitor | 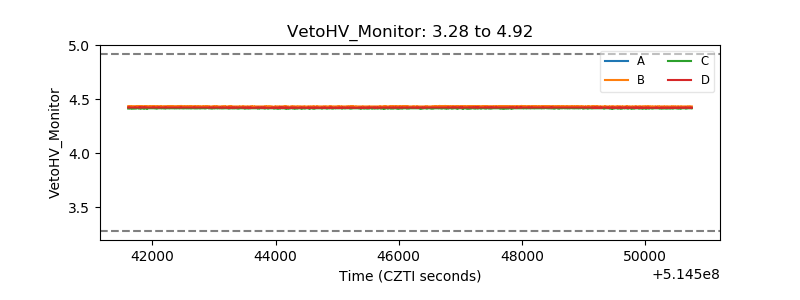 |
| Veto LLD | 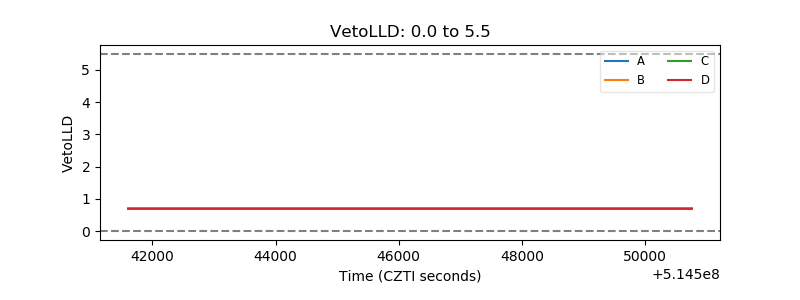 |
| Alpha Counter | 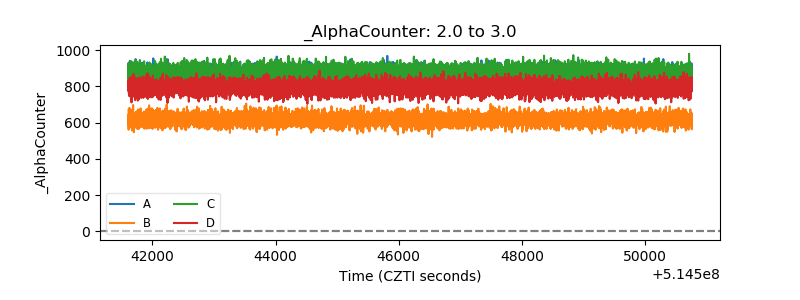 |
| _CPM_Rate | 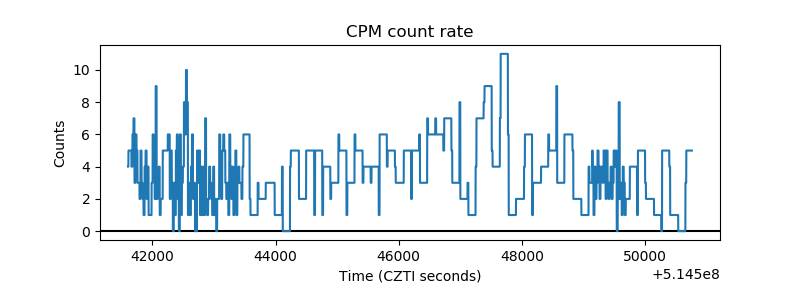 |
| CZT Counter | 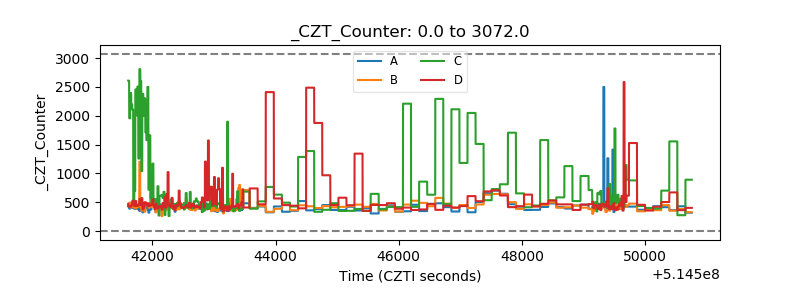 |
| +2.5 Volts monitor |  |
| +5 Volts monitor | 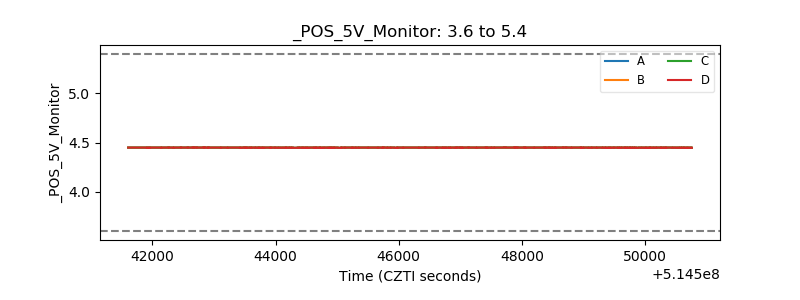 |
| _ROLL_ROT | 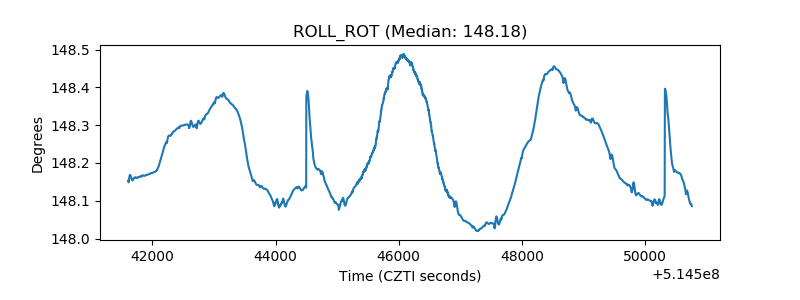 |
| _Roll_DEC | 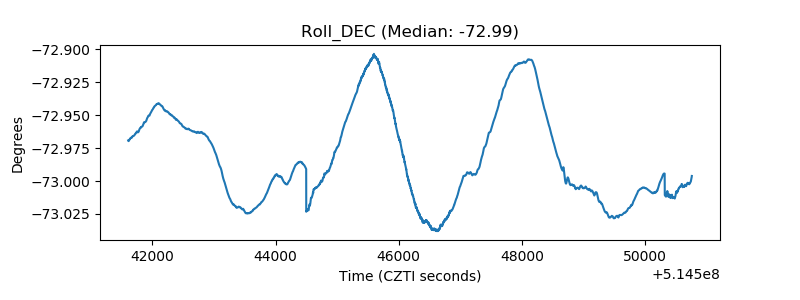 |
| _Roll_RA | 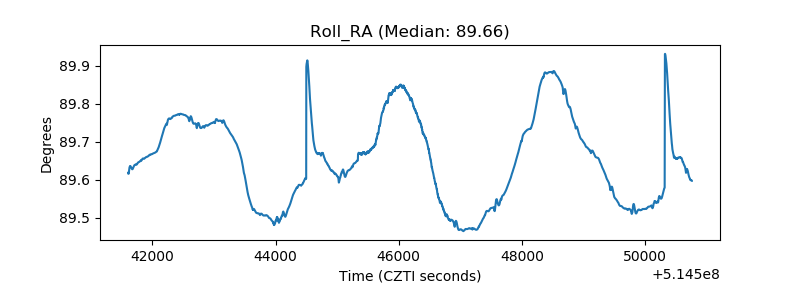 |
| Veto Counter | 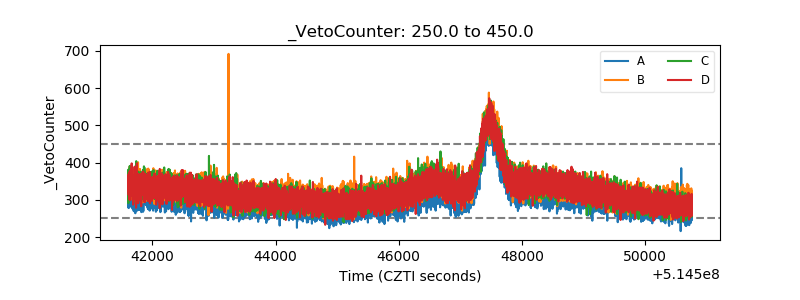 |