| Param | Original file | Final file |
|---|---|---|
| Filename | modeM0/AS1A14_070T08_9000006568_57171cztM0_level2.fits | modeM0/AS1A14_070T08_9000006568_57171cztM0_level2_quad_clean.evt |
| Size (bytes) | 372,064,320 | 89,046,720 |
| Size | 354.8 MB | 84.9 MB |
| Events in quadrant A | 2,702,075 | 585,922 |
| Events in quadrant B | 3,206,339 | 617,165 |
| Events in quadrant C | 3,939,005 | 540,437 |
| Events in quadrant D | 3,446,777 | 524,007 |
| Mode M9 | |||
|---|---|---|---|
| Quadrant | BADHDUFLAG | Total packets | Discarded packets |
| A | 0 | 10 | 0 |
| B | 0 | 10 | 0 |
| C | 0 | 10 | 0 |
| D | 0 | 10 | 0 |
| Mode SS | |||
|---|---|---|---|
| Quadrant | BADHDUFLAG | Total packets | Discarded packets |
| A | 0 | 124 | 0 |
| B | 0 | 124 | 0 |
| C | 0 | 124 | 0 |
| D | 0 | 124 | 0 |
| Mode M0 | |||
|---|---|---|---|
| Quadrant | BADHDUFLAG | Total packets | Discarded packets |
| A | 0 | 12696 | 1 |
| B | 0 | 13981 | 1 |
| C | 0 | 16102 | 1 |
| D | 0 | 14319 | 1 |
| Quadrant | Total seconds | Saturated seconds | Saturation percentage |
|---|---|---|---|
| A | 6144 | 49 | 0.797526% |
| B | 6145 | 144 | 2.343369% |
| C | 6145 | 241 | 3.921888% |
| D | 6145 | 65 | 1.057771% |
Noise dominated data is calculated using 1-second bins in cleaned event files. If a bin has >2000 counts, and if more than 50% of those come from <1% of pixels, then it is considered to be noise-dominated and hence unusable.
| Quadrant | # 1 sec bins | Bins with >0 counts | Bins with >2000 counts | High rate bins dominated by noise | Noise dominated (total time) | Noise dominated (detector-on time) | Marked lightcurve |
|---|---|---|---|---|---|---|---|
| A | 7089 | 6145 | 7 | 7 | 0.10% | 0.11% | 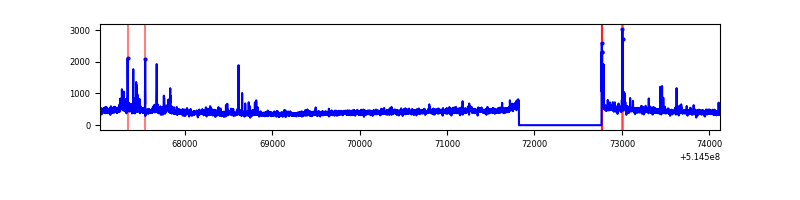 |
| B | 7090 | 6146 | 86 | 86 | 1.21% | 1.40% | 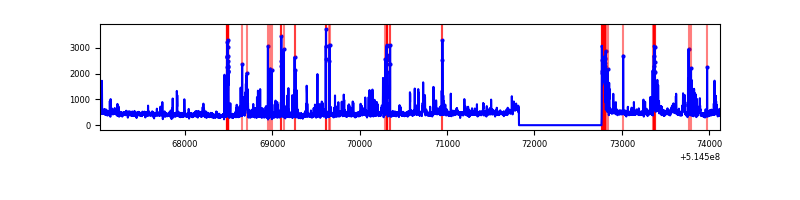 |
| C | 7090 | 6146 | 166 | 166 | 2.34% | 2.70% | 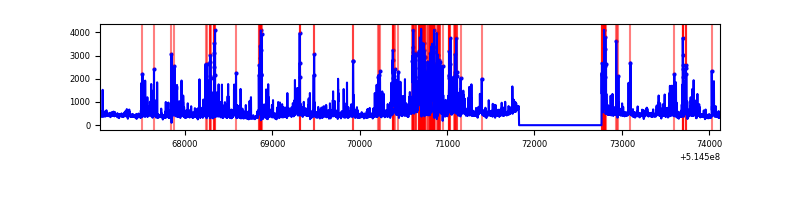 |
| D | 7090 | 6146 | 37 | 37 | 0.52% | 0.60% | 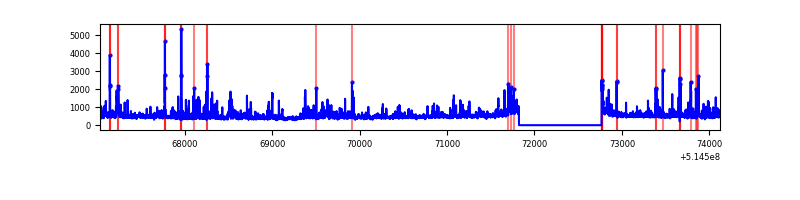 |
Top three noisy pixels from each quadrant. If the there are fewer than three noisy pixels in the level2.evt file, extra rows are filled as -1
| Pixel properties | Quadrant properties | ||||||
|---|---|---|---|---|---|---|---|
| Quadrant | DetID | PixID | Counts | Sigma | Mean | Median | Sigma |
| A | 3 | 14 | 84566 | 519.0 | 646 | 629 | 161.7 |
| A | 13 | 248 | 57845 | 353.78 | 646 | 629 | 161.7 |
| A | 6 | 226 | 17506 | 104.35 | 646 | 629 | 161.7 |
| B | 2 | 249 | 312123 | 2303.36 | 633 | 611 | 135.2 |
| B | 10 | 16 | 226980 | 1673.8 | 633 | 611 | 135.2 |
| B | 0 | 213 | 34125 | 247.81 | 633 | 611 | 135.2 |
| C | 15 | 224 | 1101603 | 6546.48 | 611 | 603 | 168.2 |
| C | 15 | 198 | 160879 | 952.99 | 611 | 603 | 168.2 |
| C | 14 | 254 | 102845 | 607.92 | 611 | 603 | 168.2 |
| D | 12 | 33 | 327825 | 1855.16 | 618 | 588 | 176.4 |
| D | 5 | 113 | 166459 | 940.35 | 618 | 588 | 176.4 |
| D | 8 | 240 | 119357 | 673.32 | 618 | 588 | 176.4 |
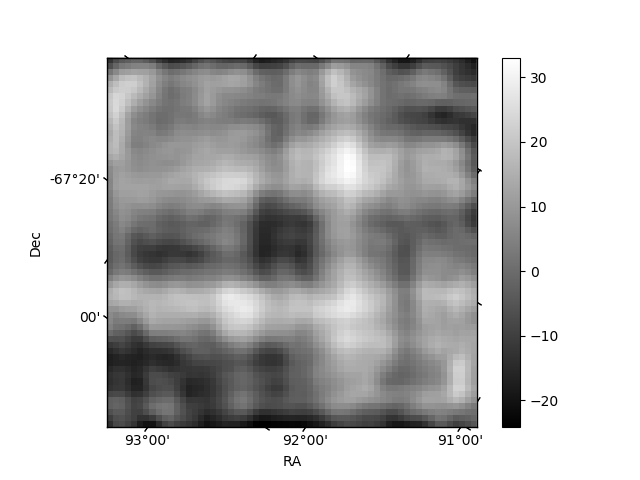
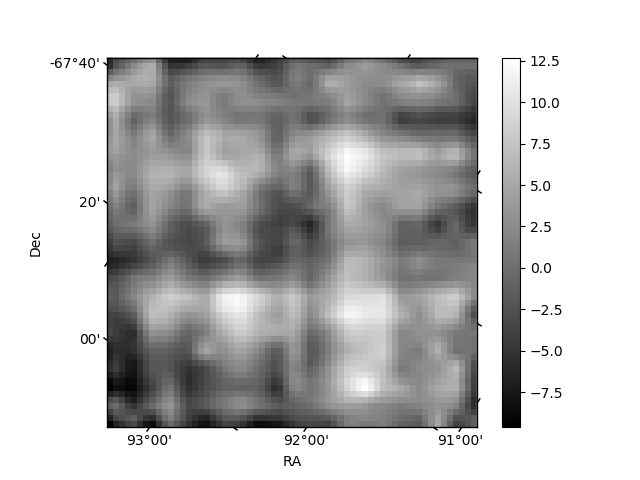
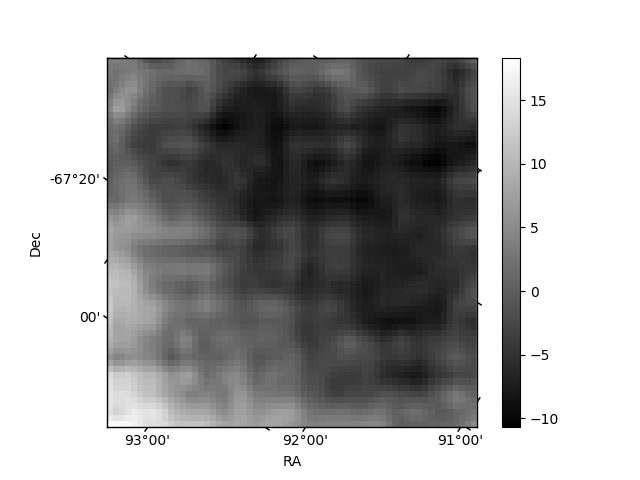
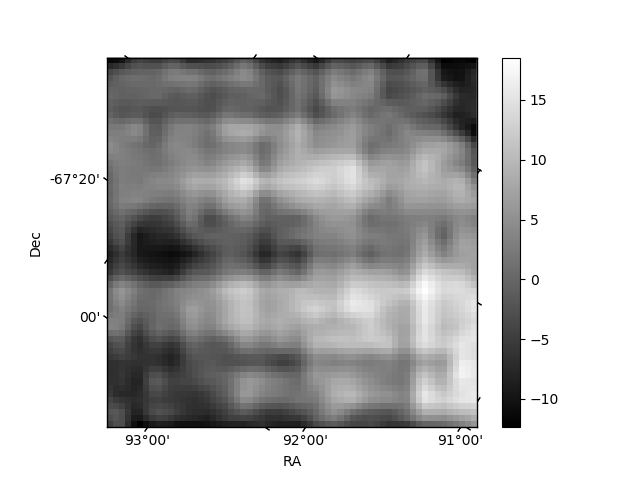
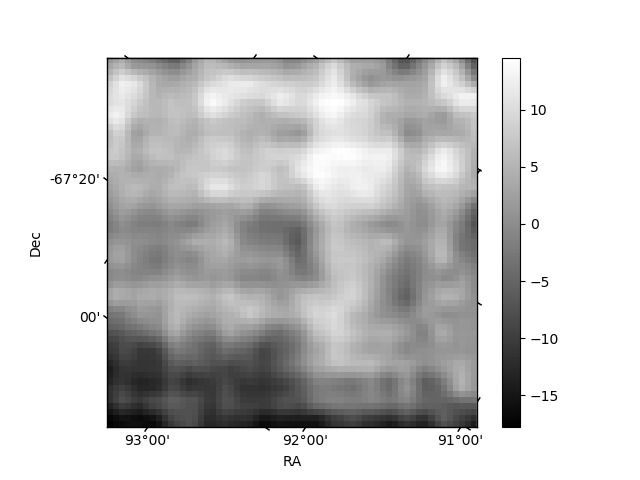
Histogram calculated using DETX and DETY for each event in the final _common_clean file
| Quadrant A | 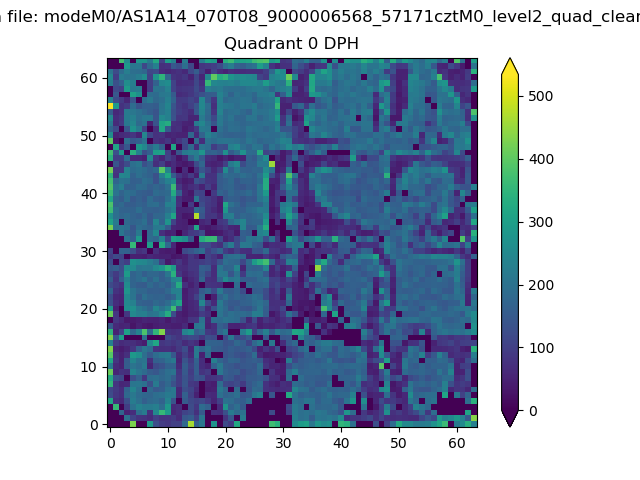 |
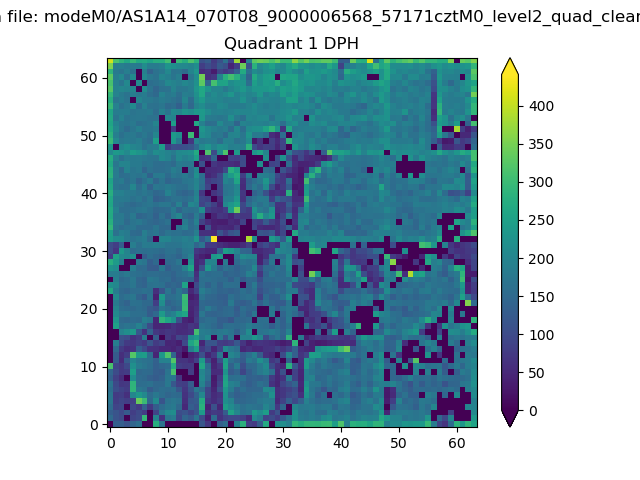 |
Quadrant B |
|---|---|---|---|
| Quadrant D | 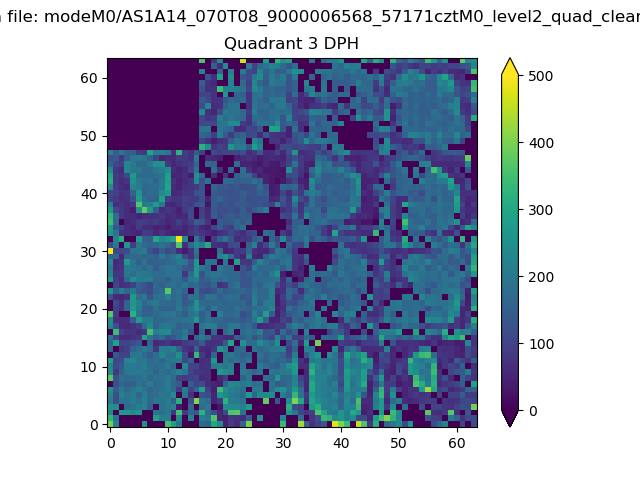 |
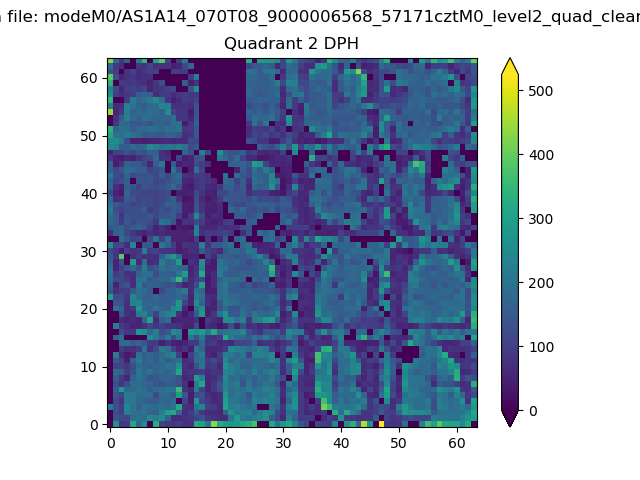 |
Quadrant C |
| Plot type | Count rate plots | Images |
|---|---|---|
| Comparison with Poisson distribution Blue bars denote a histogram of data divided into 1 sec bins. Red curve is a Poisson curve with rate = median count rate of data. |
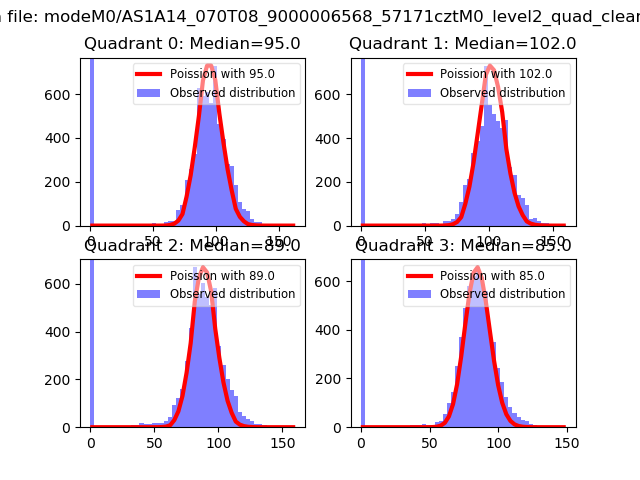 |
 |
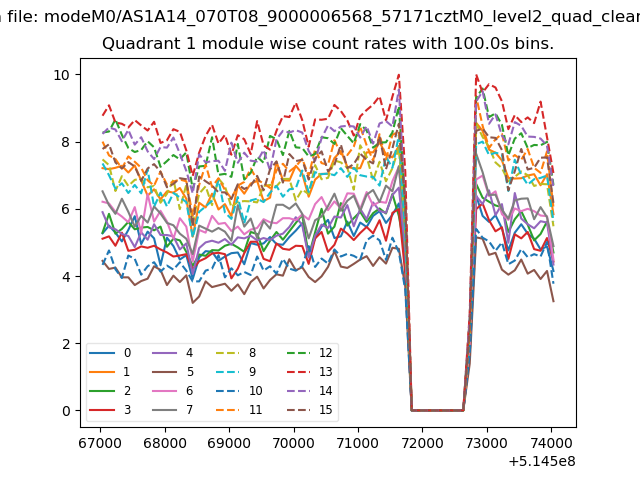
| Quadrant-wise count rates Data is divided into 100 sec bins |
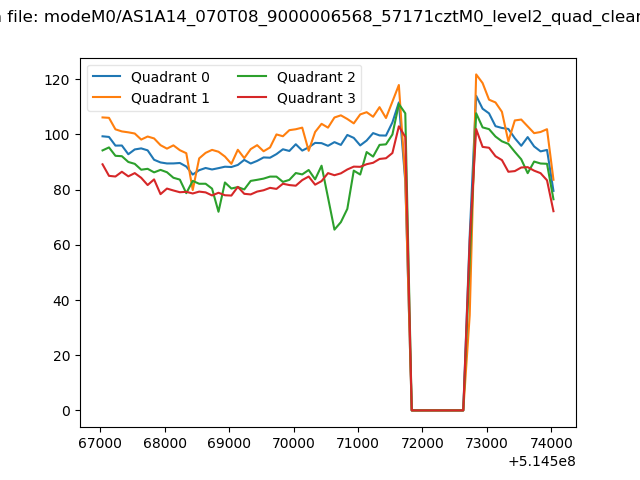 |
|
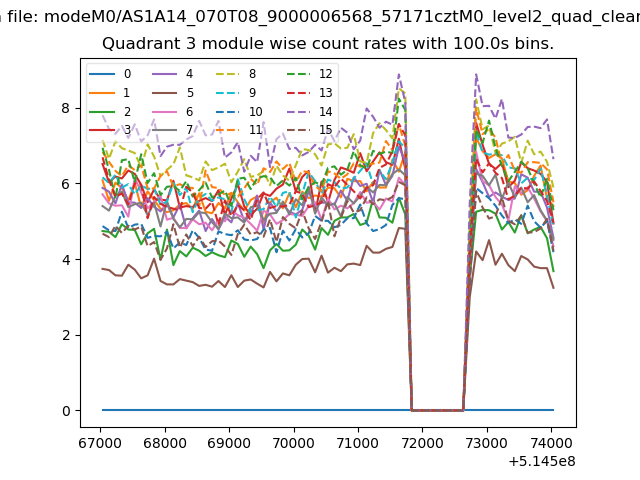
| Module-wise count rates for Quadrant A Data is divided into 100 sec bins |
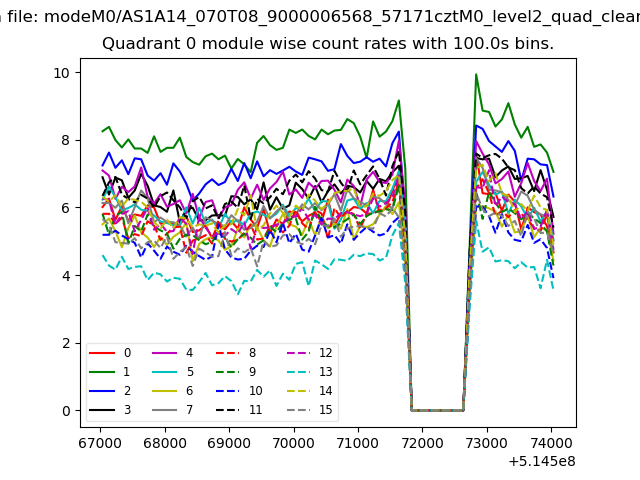 |
 |
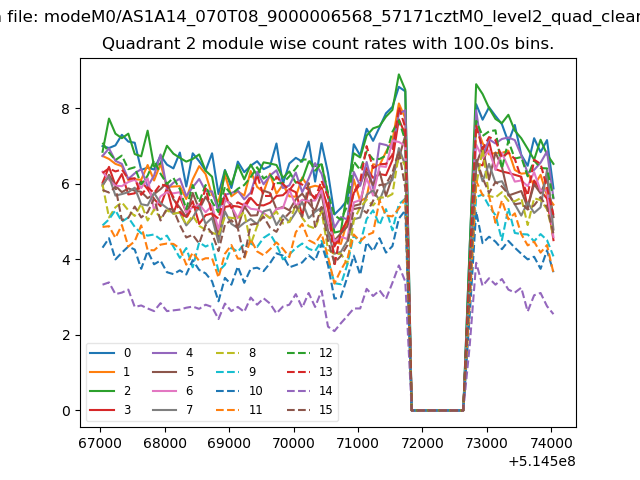
| Module-wise count rates for Quadrant B Data is divided into 100 sec bins |
 |
 |
| Module-wise count rates for Quadrant C Data is divided into 100 sec bins |
 |
 |
| Module-wise count rates for Quadrant D Data is divided into 100 sec bins |
 |
 |
| Parameter | Plot |
|---|---|
| CZT HV Monitor | 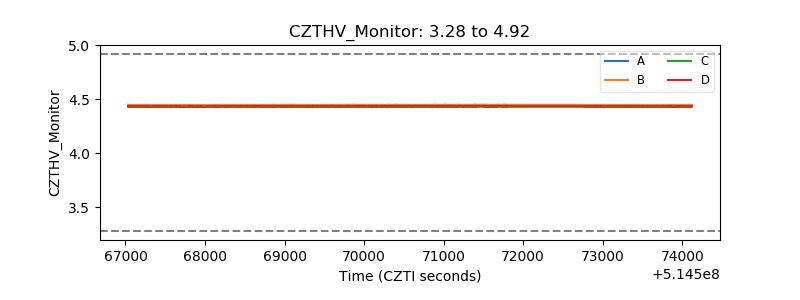 |
| D_VDD | 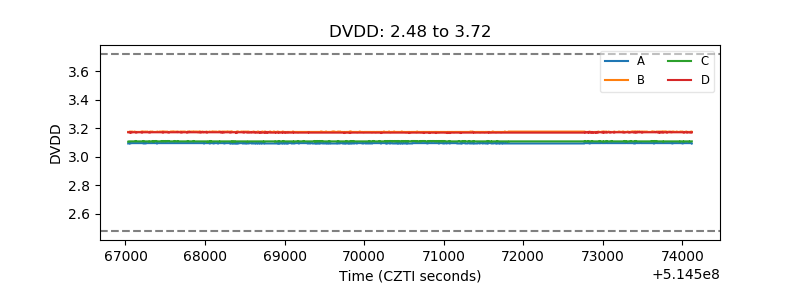 |
| Temperature 1 | 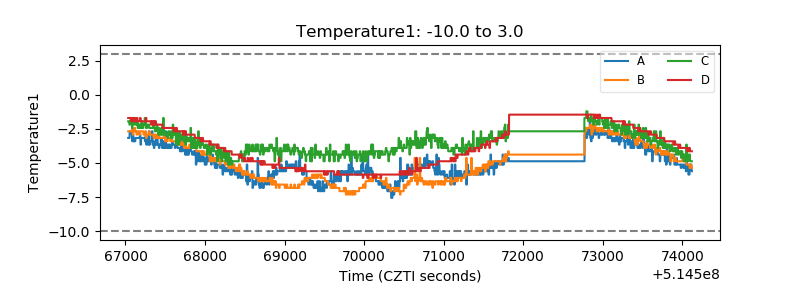 |
| Veto HV Monitor |  |
| Veto LLD | 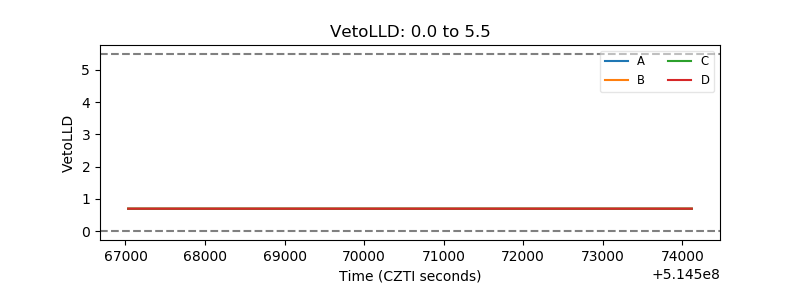 |
| Alpha Counter | 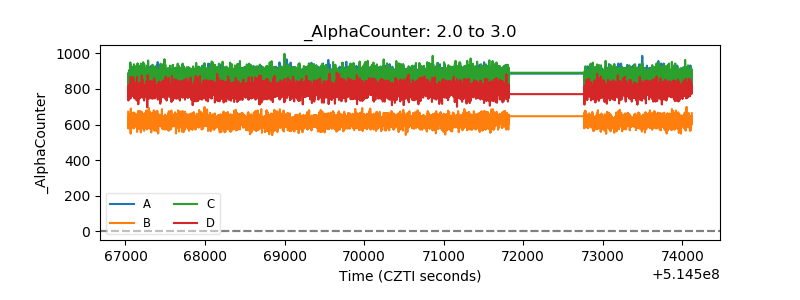 |
| _CPM_Rate | 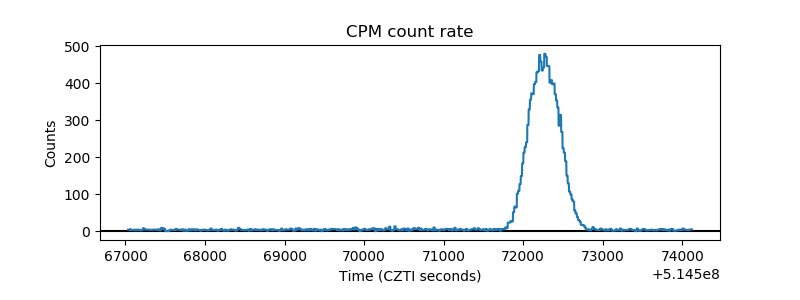 |
| CZT Counter | 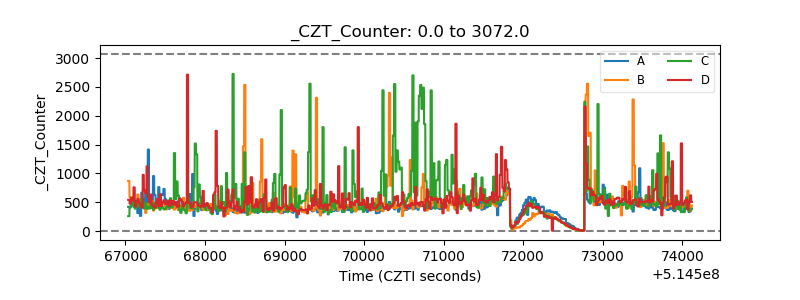 |
| +2.5 Volts monitor |  |
| +5 Volts monitor | 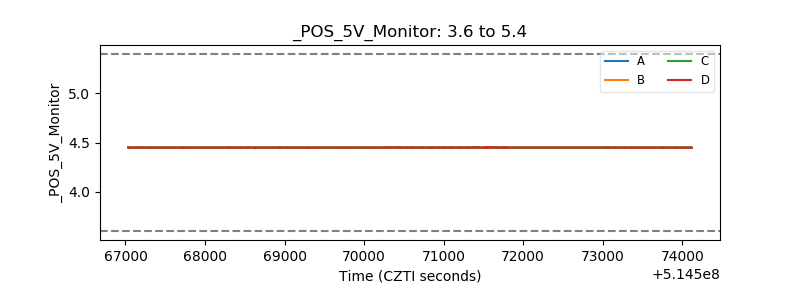 |
| _ROLL_ROT | 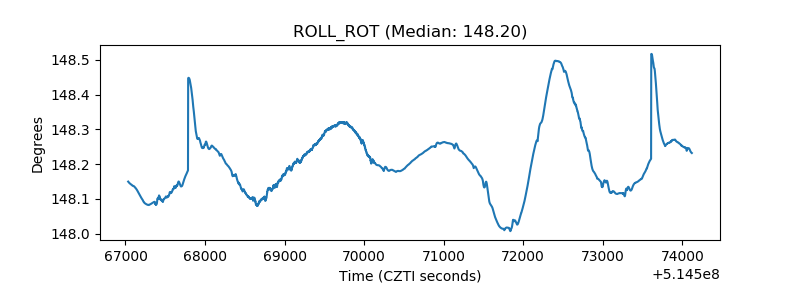 |
| _Roll_DEC | 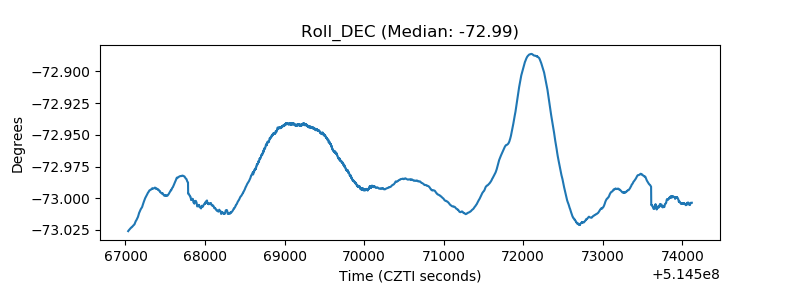 |
| _Roll_RA | 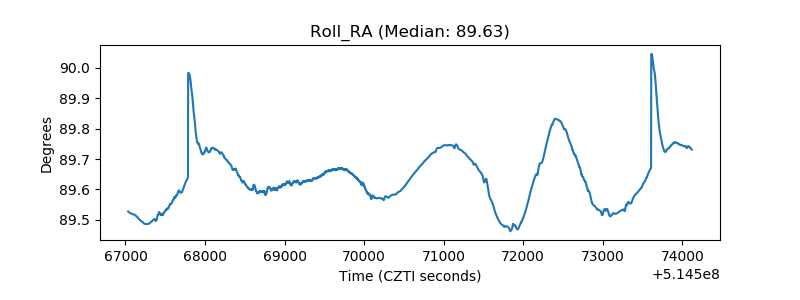 |
| Veto Counter | 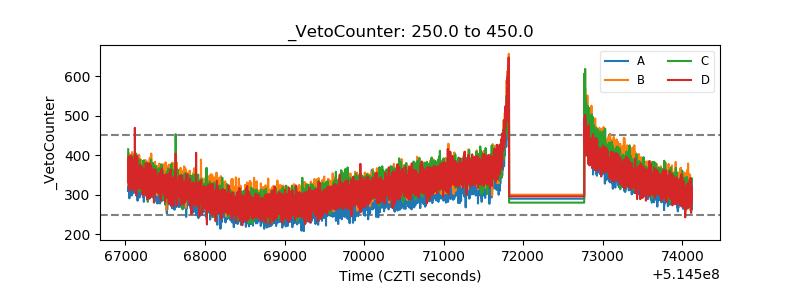 |