| Param | Original file | Final file |
|---|---|---|
| Filename | modeM0/AS1A14_070T08_9000006568_57174cztM0_level2.fits | modeM0/AS1A14_070T08_9000006568_57174cztM0_level2_quad_clean.evt |
| Size (bytes) | 467,490,240 | 85,970,880 |
| Size | 445.8 MB | 82.0 MB |
| Events in quadrant A | 3,435,241 | 558,628 |
| Events in quadrant B | 3,558,281 | 614,418 |
| Events in quadrant C | 4,817,213 | 494,526 |
| Events in quadrant D | 4,998,953 | 491,025 |
| Mode M9 | |||
|---|---|---|---|
| Quadrant | BADHDUFLAG | Total packets | Discarded packets |
| A | 0 | 12 | 0 |
| B | 0 | 13 | 0 |
| C | 0 | 13 | 0 |
| D | 0 | 13 | 0 |
| Mode SS | |||
|---|---|---|---|
| Quadrant | BADHDUFLAG | Total packets | Discarded packets |
| A | 0 | 128 | 0 |
| B | 0 | 128 | 0 |
| C | 0 | 128 | 0 |
| D | 0 | 128 | 0 |
| Mode M0 | |||
|---|---|---|---|
| Quadrant | BADHDUFLAG | Total packets | Discarded packets |
| A | 0 | 14896 | 2 |
| B | 0 | 15169 | 2 |
| C | 0 | 18946 | 2 |
| D | 0 | 18998 | 4 |
| Quadrant | Total seconds | Saturated seconds | Saturation percentage |
|---|---|---|---|
| A | 6375 | 68 | 1.066667% |
| B | 6375 | 240 | 3.764706% |
| C | 6375 | 482 | 7.560784% |
| D | 6374 | 400 | 6.275494% |
Noise dominated data is calculated using 1-second bins in cleaned event files. If a bin has >2000 counts, and if more than 50% of those come from <1% of pixels, then it is considered to be noise-dominated and hence unusable.
| Quadrant | # 1 sec bins | Bins with >0 counts | Bins with >2000 counts | High rate bins dominated by noise | Noise dominated (total time) | Noise dominated (detector-on time) | Marked lightcurve |
|---|---|---|---|---|---|---|---|
| A | 7831 | 6657 | 54 | 54 | 0.69% | 0.81% | 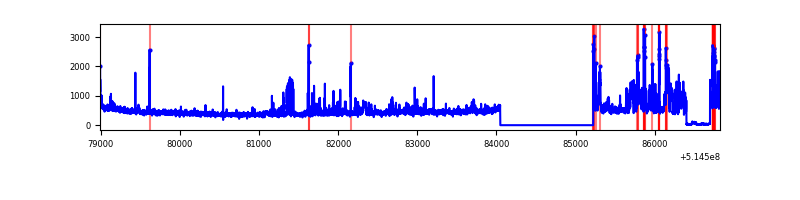 |
| B | 7831 | 6657 | 154 | 154 | 1.97% | 2.31% | 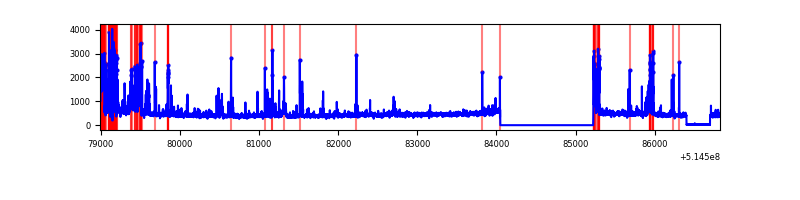 |
| C | 7831 | 6657 | 379 | 379 | 4.84% | 5.69% | 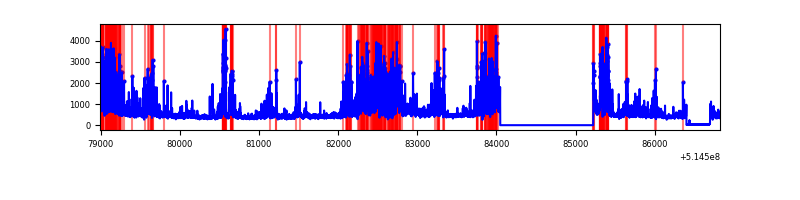 |
| D | 7830 | 6656 | 433 | 433 | 5.53% | 6.51% | 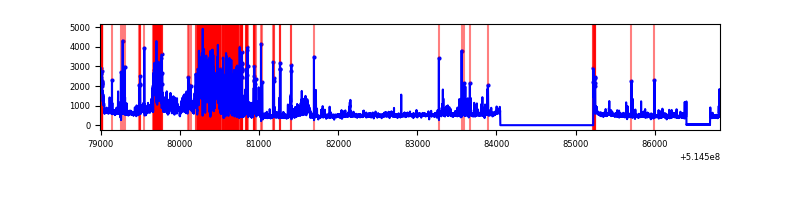 |
Top three noisy pixels from each quadrant. If the there are fewer than three noisy pixels in the level2.evt file, extra rows are filled as -1
| Pixel properties | Quadrant properties | ||||||
|---|---|---|---|---|---|---|---|
| Quadrant | DetID | PixID | Counts | Sigma | Mean | Median | Sigma |
| A | 3 | 14 | 713175 | 4140.45 | 683 | 666 | 172.1 |
| A | 10 | 251 | 18688 | 104.73 | 683 | 666 | 172.1 |
| A | 10 | 248 | 13983 | 77.39 | 683 | 666 | 172.1 |
| B | 10 | 16 | 541688 | 3810.57 | 666 | 640 | 142.0 |
| B | 2 | 249 | 188881 | 1325.77 | 666 | 640 | 142.0 |
| B | 0 | 213 | 51146 | 355.71 | 666 | 640 | 142.0 |
| C | 15 | 224 | 1947982 | 11195.31 | 634 | 629 | 173.9 |
| C | 9 | 38 | 143736 | 822.72 | 634 | 629 | 173.9 |
| C | 14 | 246 | 71048 | 404.84 | 634 | 629 | 173.9 |
| D | 7 | 96 | 999446 | 5463.61 | 637 | 606 | 182.8 |
| D | 5 | 113 | 475162 | 2595.8 | 637 | 606 | 182.8 |
| D | 12 | 33 | 407023 | 2223.08 | 637 | 606 | 182.8 |
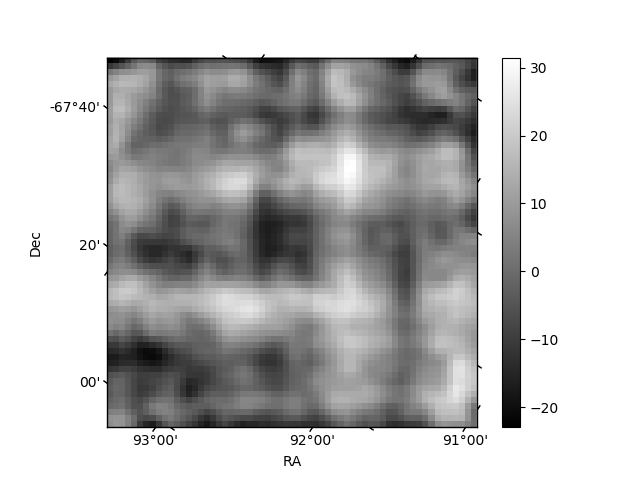
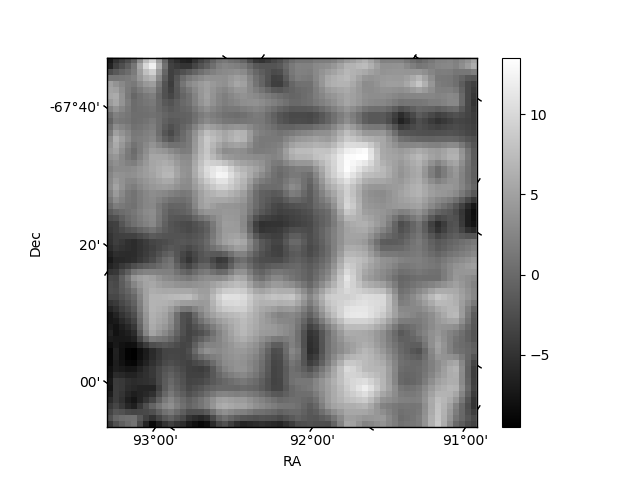
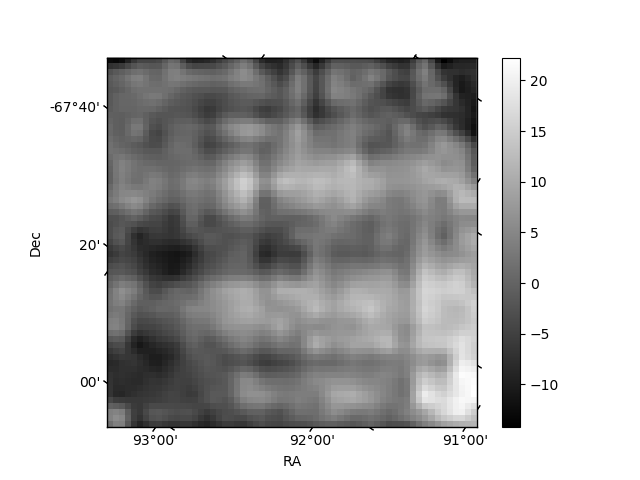
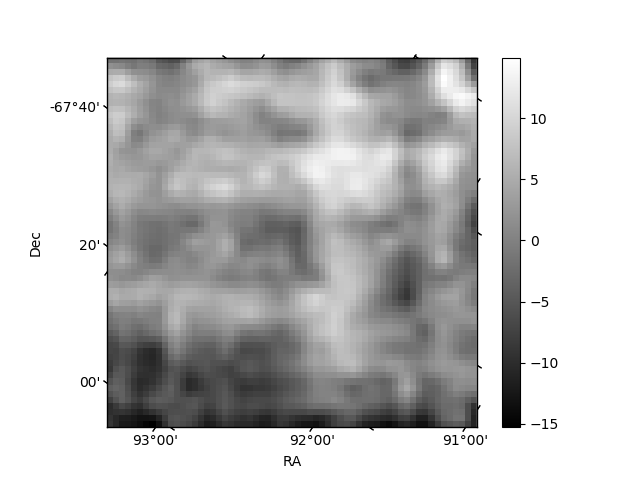
Histogram calculated using DETX and DETY for each event in the final _common_clean file
| Quadrant A | 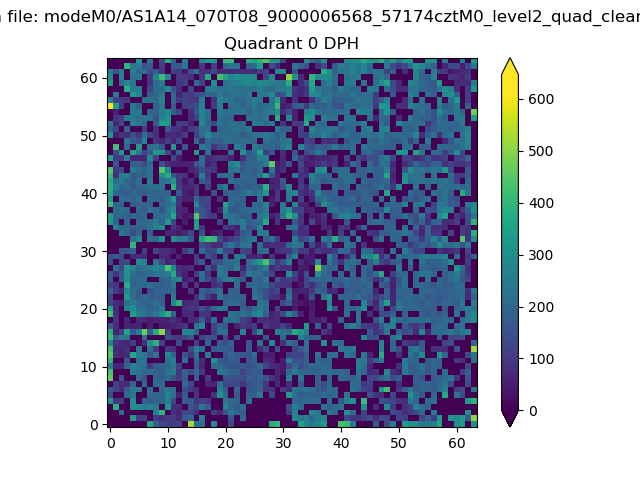 |
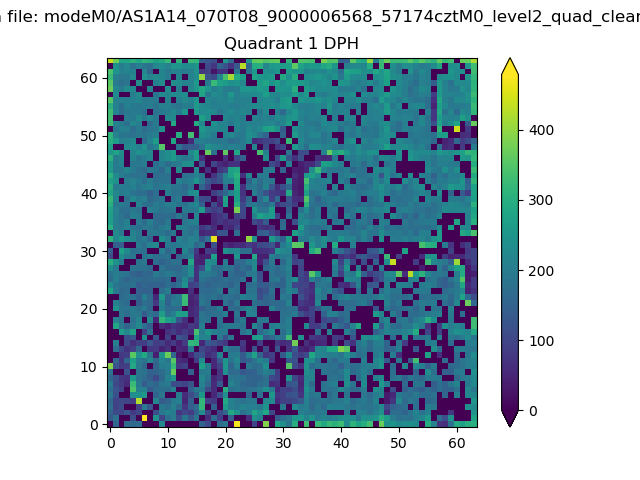 |
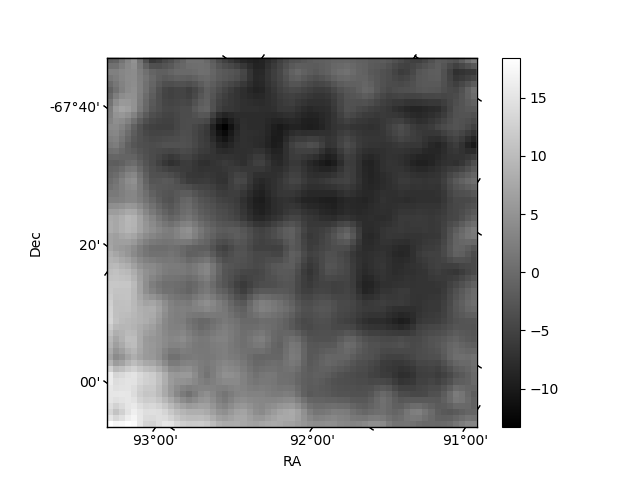
Quadrant B |
|---|---|---|---|
| Quadrant D | 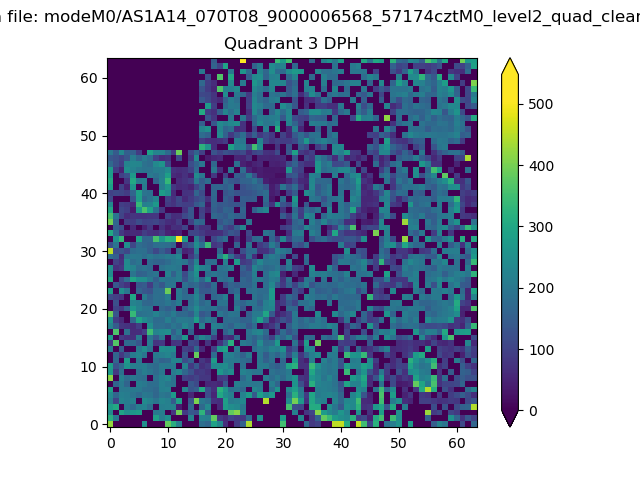 |
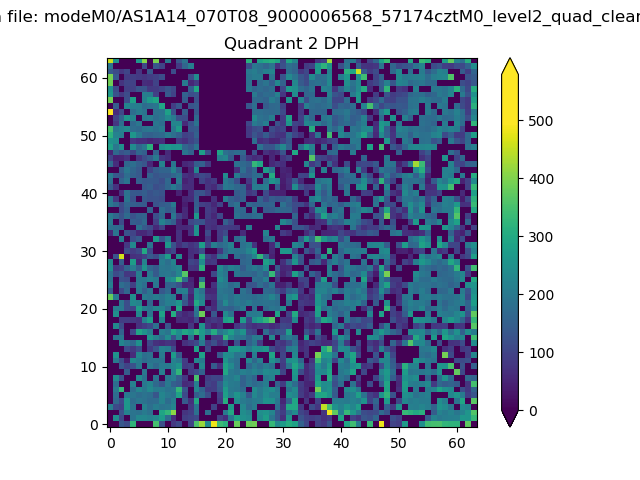 |
Quadrant C |
| Plot type | Count rate plots | Images |
|---|---|---|
| Comparison with Poisson distribution Blue bars denote a histogram of data divided into 1 sec bins. Red curve is a Poisson curve with rate = median count rate of data. |
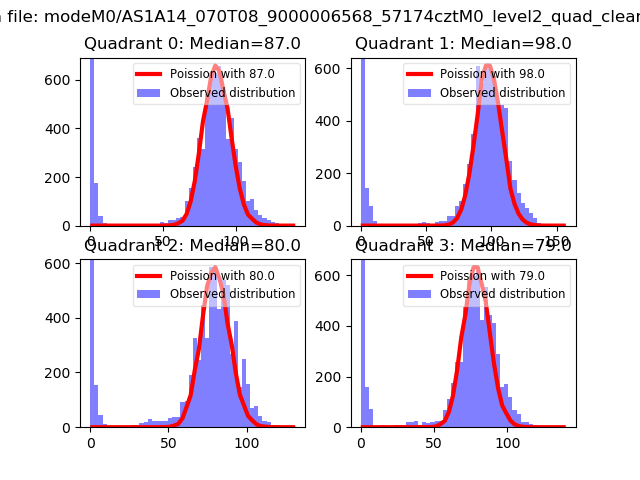 |
 |
| Quadrant-wise count rates Data is divided into 100 sec bins |
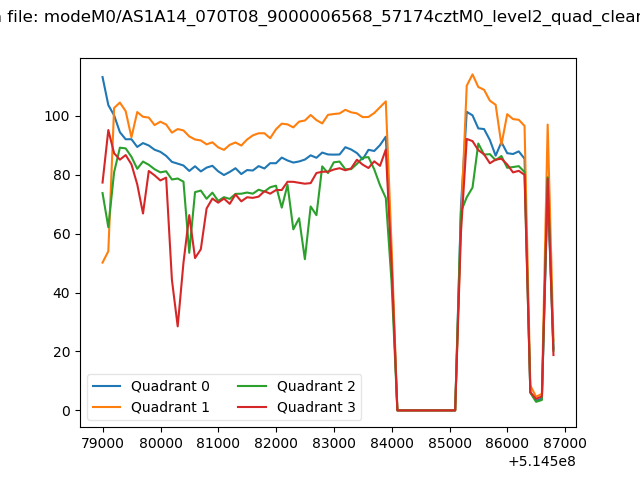 |
|
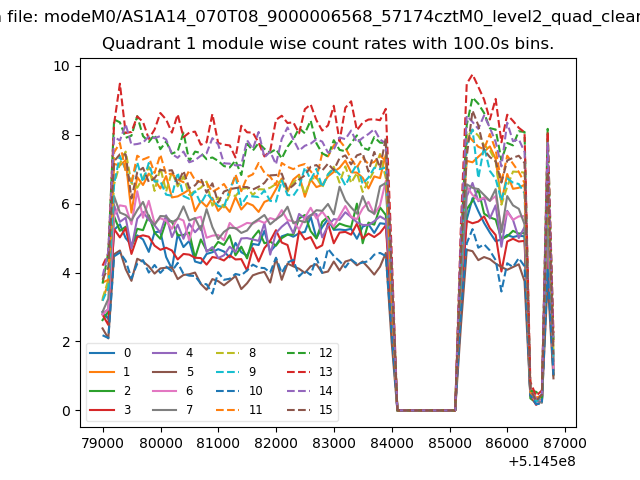
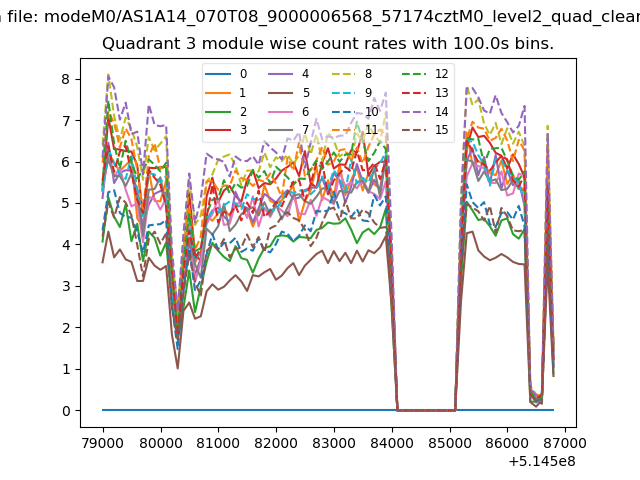
| Module-wise count rates for Quadrant A Data is divided into 100 sec bins |
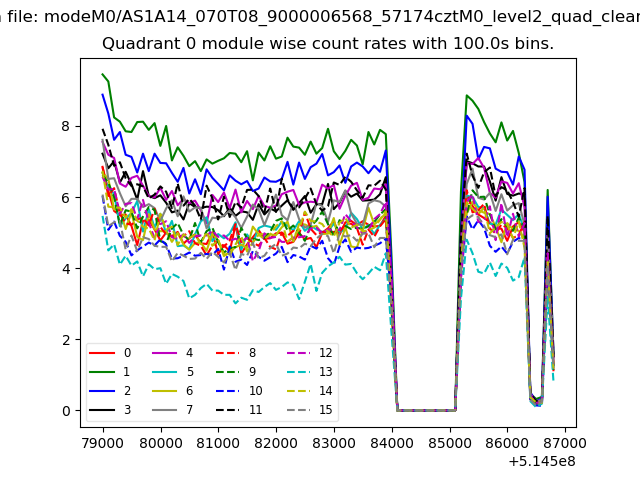 |
 |
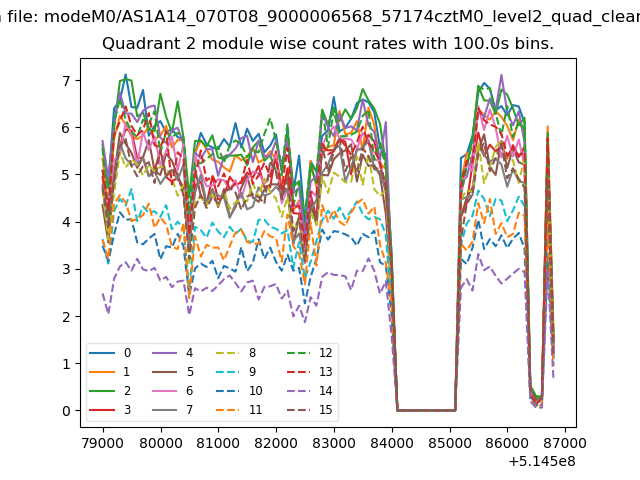
| Module-wise count rates for Quadrant B Data is divided into 100 sec bins |
 |
 |
| Module-wise count rates for Quadrant C Data is divided into 100 sec bins |
 |
 |
| Module-wise count rates for Quadrant D Data is divided into 100 sec bins |
 |
 |
| Parameter | Plot |
|---|---|
| CZT HV Monitor | 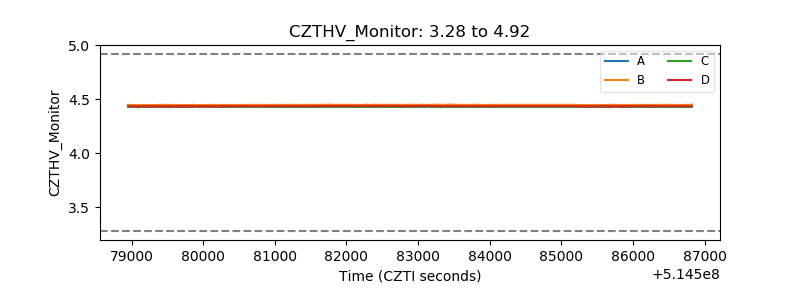 |
| D_VDD | 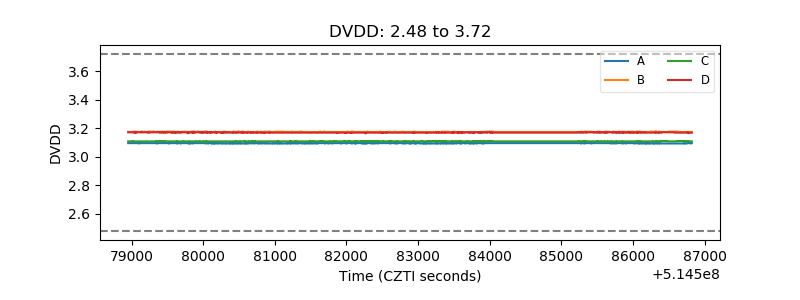 |
| Temperature 1 | 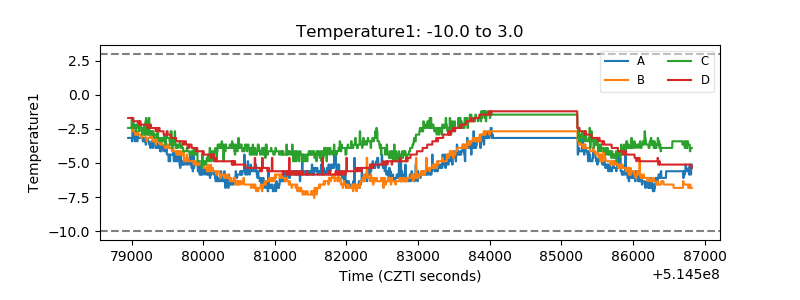 |
| Veto HV Monitor | 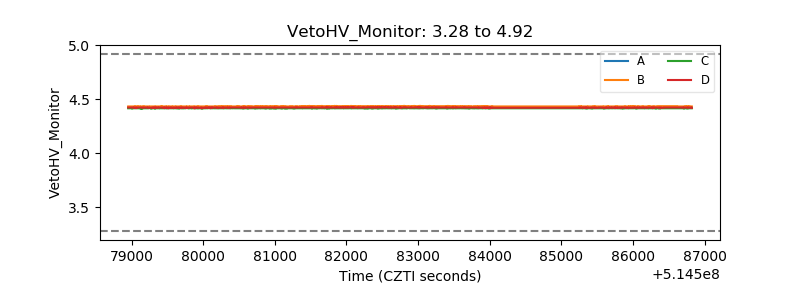 |
| Veto LLD | 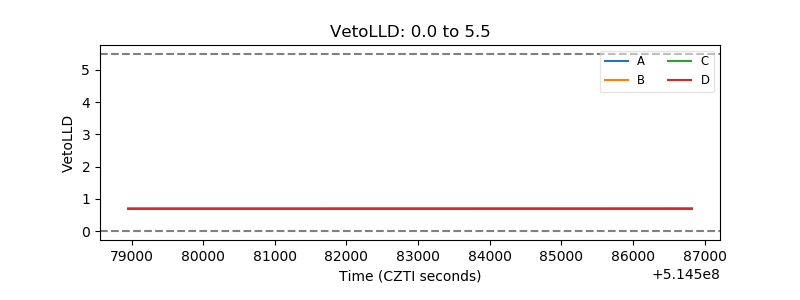 |
| Alpha Counter | 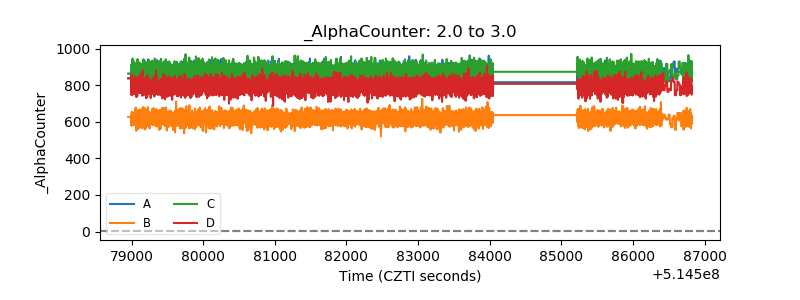 |
| _CPM_Rate | 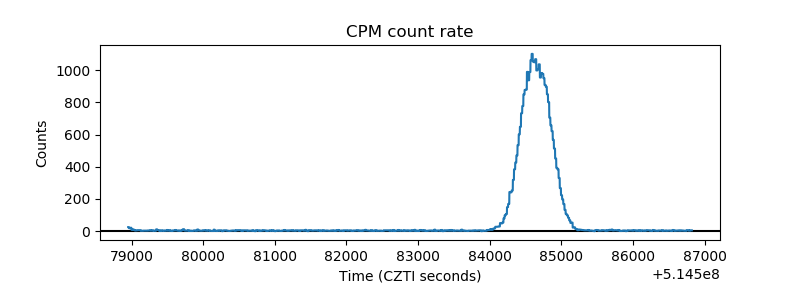 |
| CZT Counter | 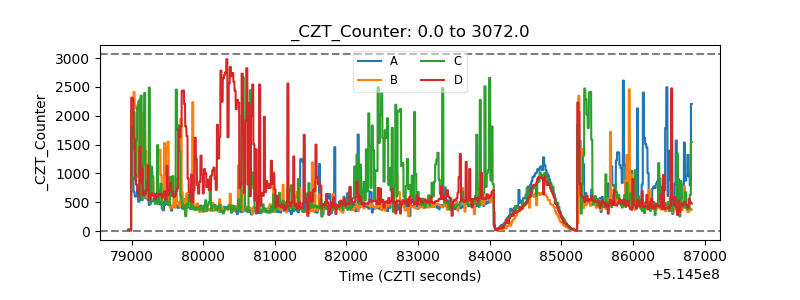 |
| +2.5 Volts monitor |  |
| +5 Volts monitor | 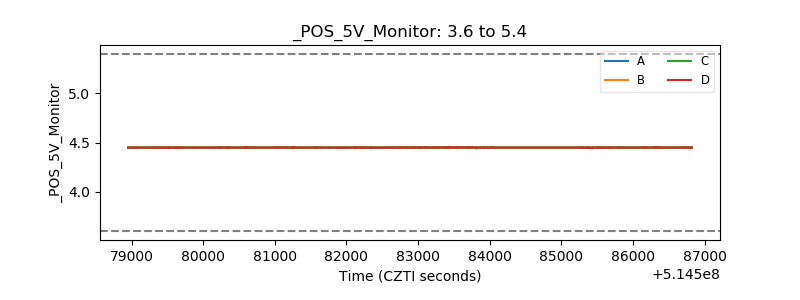 |
| _ROLL_ROT | 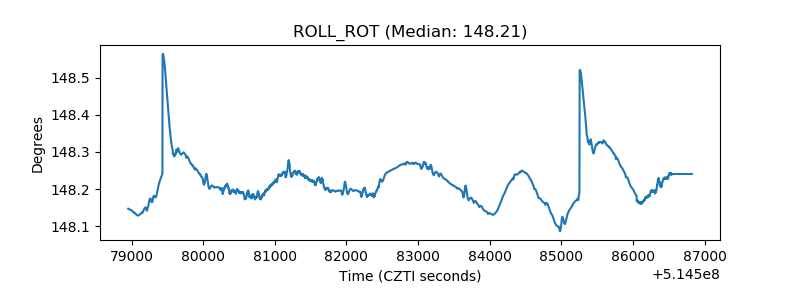 |
| _Roll_DEC | 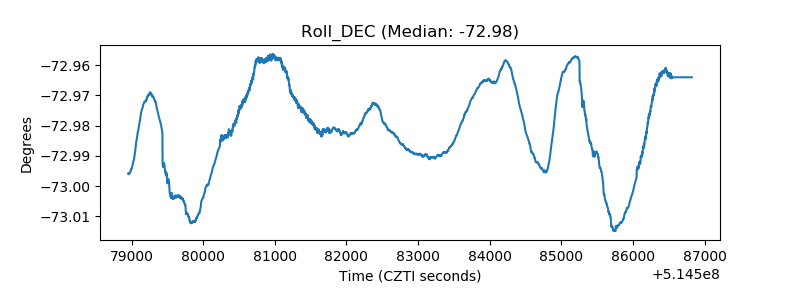 |
| _Roll_RA | 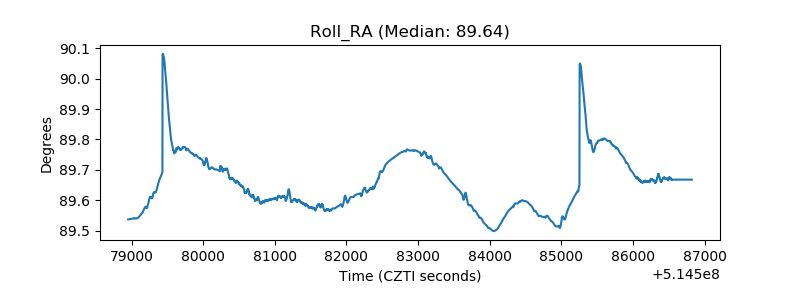 |
| Veto Counter | 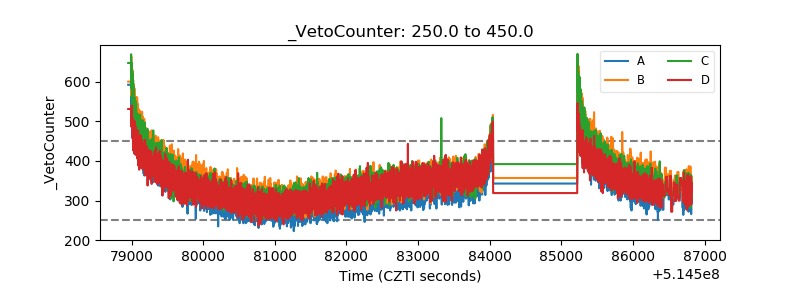 |