| Param | Original file | Final file |
|---|---|---|
| Filename | modeM0/AS1A14_070T08_9000006568_57175cztM0_level2.fits | modeM0/AS1A14_070T08_9000006568_57175cztM0_level2_quad_clean.evt |
| Size (bytes) | 540,434,880 | 85,576,320 |
| Size | 515.4 MB | 81.6 MB |
| Events in quadrant A | 5,779,130 | 553,871 |
| Events in quadrant B | 3,116,085 | 636,318 |
| Events in quadrant C | 6,869,618 | 440,551 |
| Events in quadrant D | 3,742,612 | 513,233 |
| Mode M9 | |||
|---|---|---|---|
| Quadrant | BADHDUFLAG | Total packets | Discarded packets |
| A | 0 | 24 | 0 |
| B | 0 | 24 | 0 |
| C | 0 | 24 | 0 |
| D | 0 | 24 | 0 |
| Mode SS | |||
|---|---|---|---|
| Quadrant | BADHDUFLAG | Total packets | Discarded packets |
| A | 0 | 132 | 0 |
| B | 0 | 132 | 0 |
| C | 0 | 132 | 0 |
| D | 0 | 132 | 0 |
| Mode M0 | |||
|---|---|---|---|
| Quadrant | BADHDUFLAG | Total packets | Discarded packets |
| A | 0 | 21503 | 2 |
| B | 0 | 13942 | 2 |
| C | 0 | 24968 | 2 |
| D | 0 | 15151 | 2 |
| Quadrant | Total seconds | Saturated seconds | Saturation percentage |
|---|---|---|---|
| A | 6408 | 584 | 9.113608% |
| B | 6409 | 107 | 1.669527% |
| C | 6409 | 1531 | 23.888282% |
| D | 6409 | 108 | 1.685130% |
Noise dominated data is calculated using 1-second bins in cleaned event files. If a bin has >2000 counts, and if more than 50% of those come from <1% of pixels, then it is considered to be noise-dominated and hence unusable.
| Quadrant | # 1 sec bins | Bins with >0 counts | Bins with >2000 counts | High rate bins dominated by noise | Noise dominated (total time) | Noise dominated (detector-on time) | Marked lightcurve |
|---|---|---|---|---|---|---|---|
| A | 9080 | 6693 | 646 | 646 | 7.11% | 9.65% | 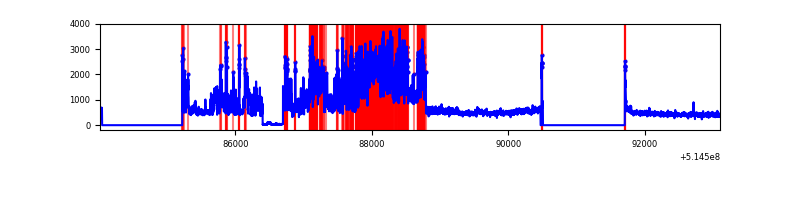 |
| B | 9081 | 6694 | 55 | 55 | 0.61% | 0.82% | 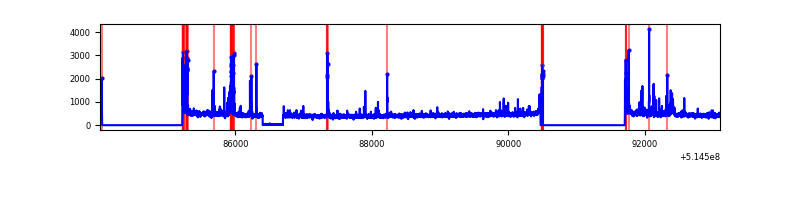 |
| C | 9080 | 6693 | 1266 | 1266 | 13.94% | 18.92% | 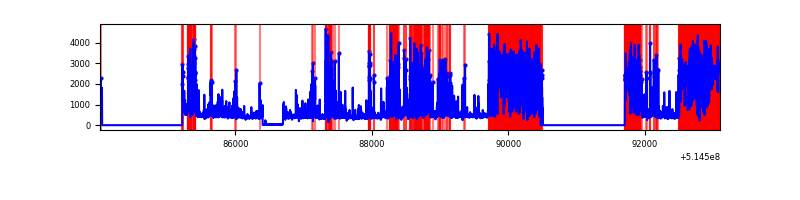 |
| D | 9081 | 6694 | 75 | 75 | 0.83% | 1.12% | 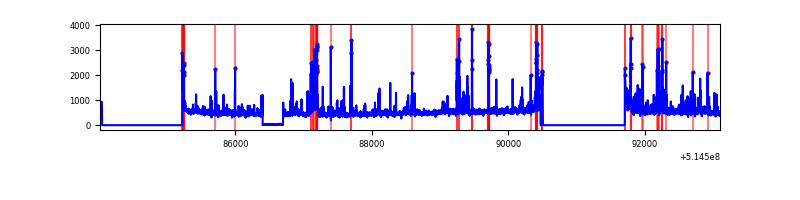 |
Top three noisy pixels from each quadrant. If the there are fewer than three noisy pixels in the level2.evt file, extra rows are filled as -1
| Pixel properties | Quadrant properties | ||||||
|---|---|---|---|---|---|---|---|
| Quadrant | DetID | PixID | Counts | Sigma | Mean | Median | Sigma |
| A | 3 | 14 | 3128918 | 18621.43 | 674 | 658 | 168.0 |
| A | 10 | 251 | 17051 | 97.58 | 674 | 658 | 168.0 |
| A | 13 | 254 | 10421 | 58.12 | 674 | 658 | 168.0 |
| B | 10 | 16 | 154901 | 1065.84 | 681 | 657 | 144.7 |
| B | 2 | 249 | 95254 | 653.67 | 681 | 657 | 144.7 |
| B | 5 | 185 | 40122 | 272.7 | 681 | 657 | 144.7 |
| C | 15 | 224 | 4454793 | 27767.24 | 577 | 570 | 160.4 |
| C | 14 | 67 | 41354 | 254.24 | 577 | 570 | 160.4 |
| C | 14 | 254 | 36827 | 226.02 | 577 | 570 | 160.4 |
| D | 5 | 113 | 428739 | 2297.9 | 651 | 620 | 186.3 |
| D | 8 | 240 | 160603 | 858.7 | 651 | 620 | 186.3 |
| D | 2 | 249 | 126761 | 677.05 | 651 | 620 | 186.3 |
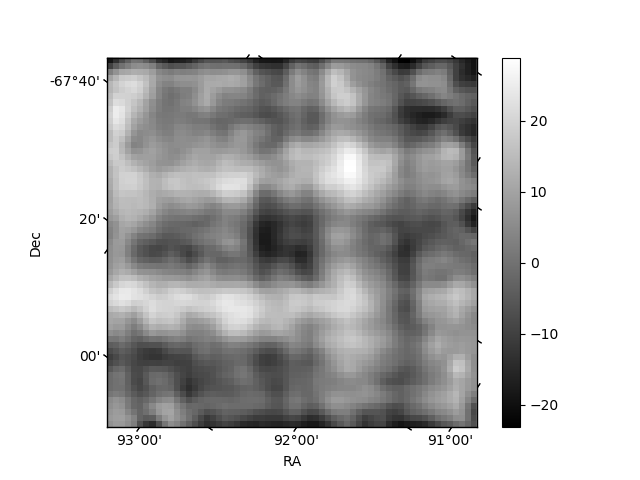
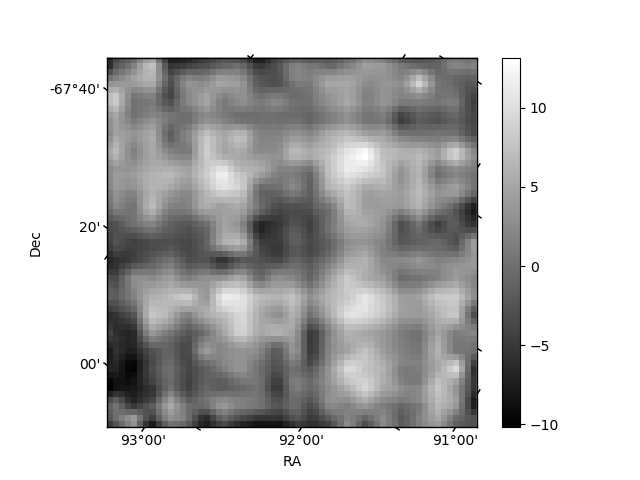
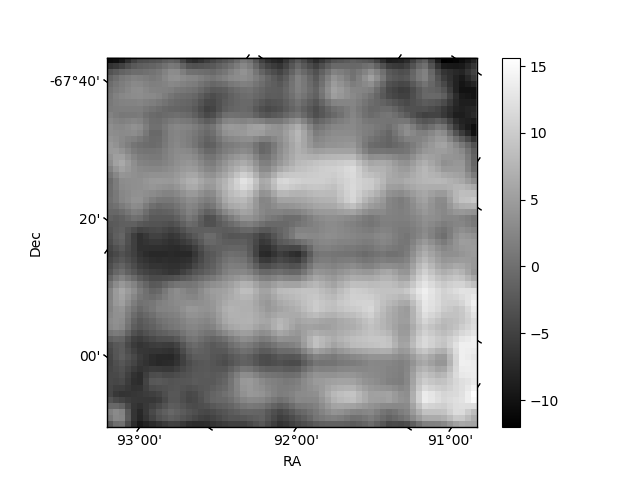
Histogram calculated using DETX and DETY for each event in the final _common_clean file
| Quadrant A | 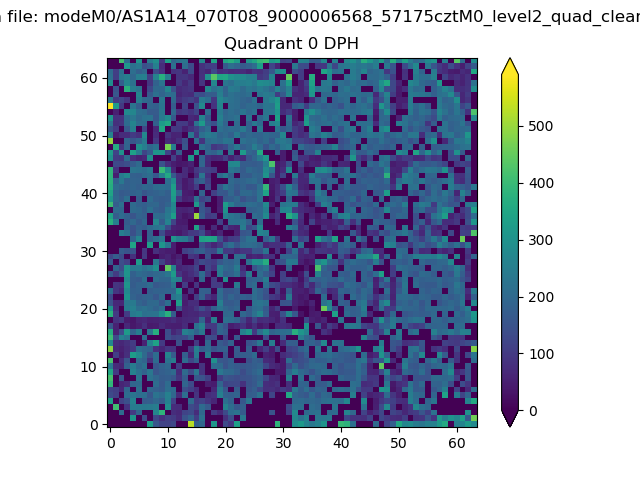 |
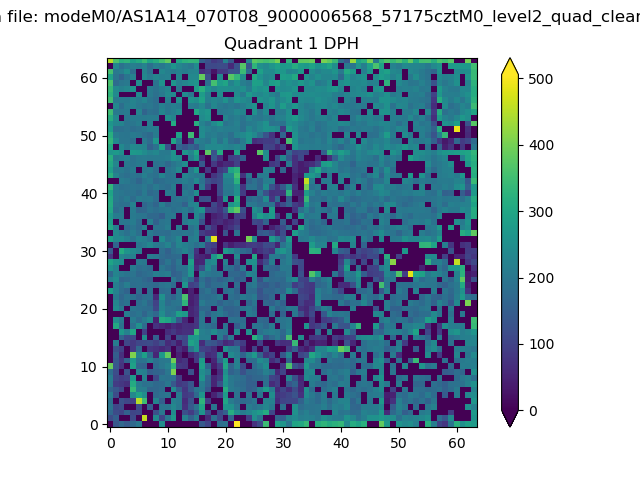 |
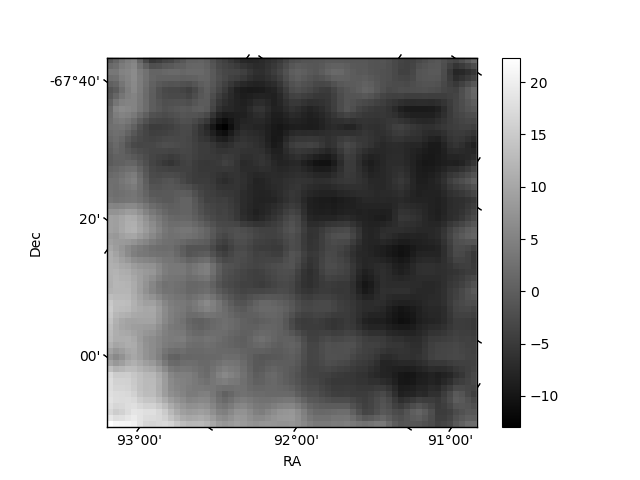
Quadrant B |
|---|---|---|---|
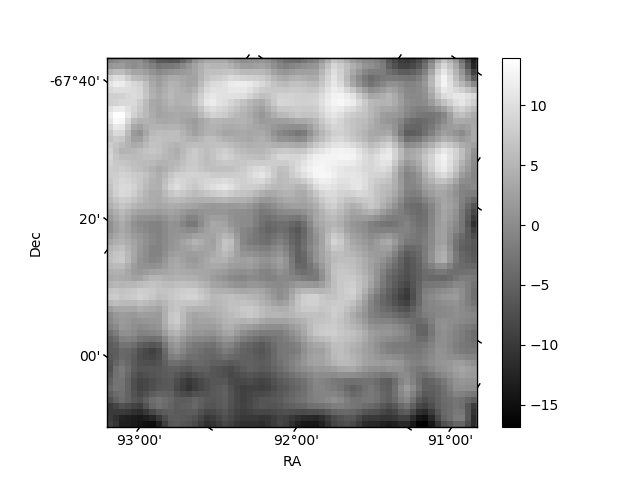
| Quadrant D | 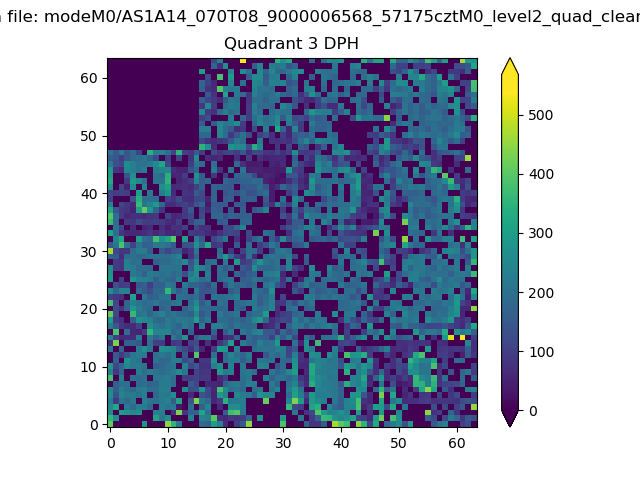 |
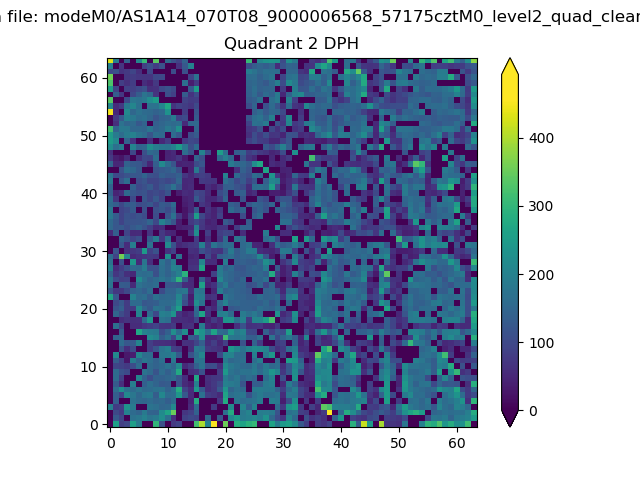 |
Quadrant C |
| Plot type | Count rate plots | Images |
|---|---|---|
| Comparison with Poisson distribution Blue bars denote a histogram of data divided into 1 sec bins. Red curve is a Poisson curve with rate = median count rate of data. |
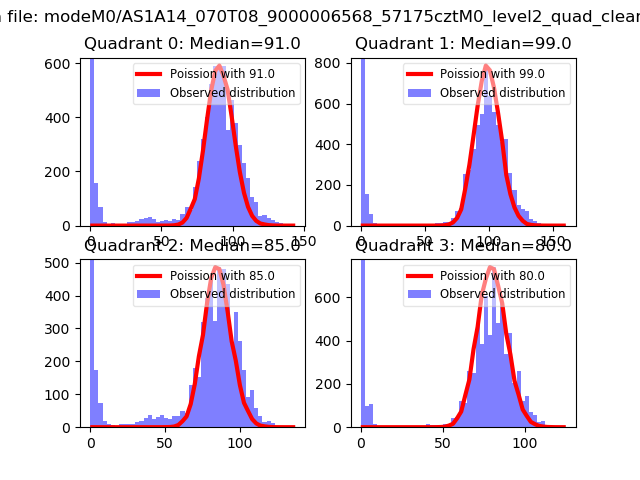 |
 |
| Quadrant-wise count rates Data is divided into 100 sec bins |
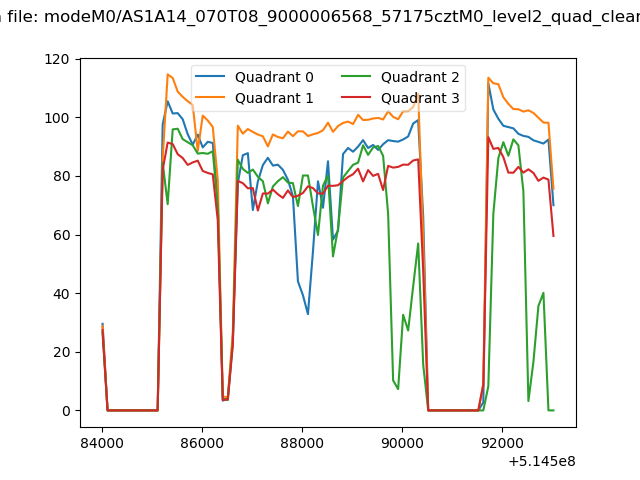 |
|
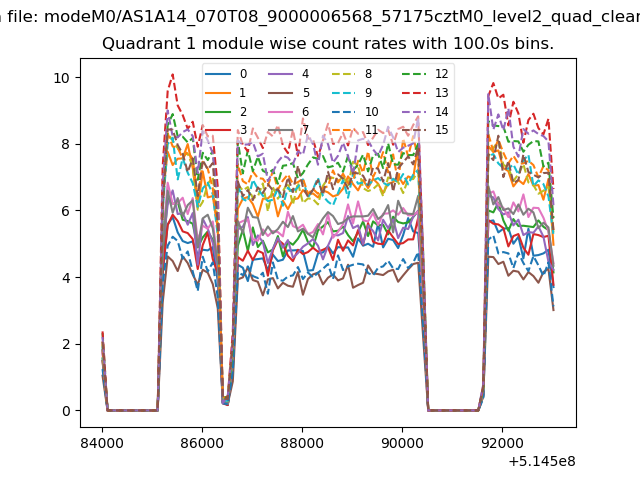
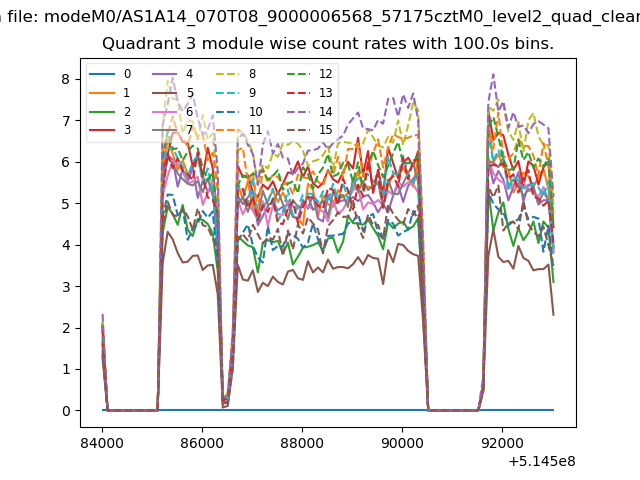
| Module-wise count rates for Quadrant A Data is divided into 100 sec bins |
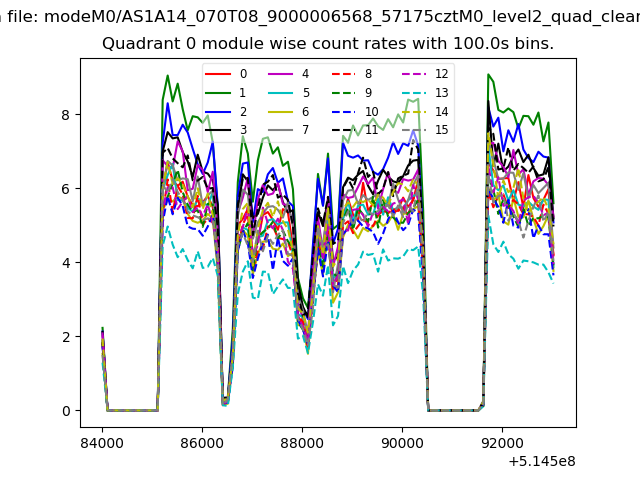 |
 |
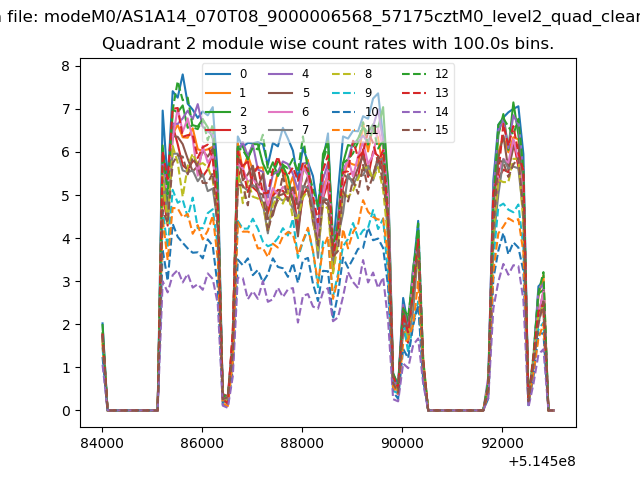
| Module-wise count rates for Quadrant B Data is divided into 100 sec bins |
 |
 |
| Module-wise count rates for Quadrant C Data is divided into 100 sec bins |
 |
 |
| Module-wise count rates for Quadrant D Data is divided into 100 sec bins |
 |
 |
| Parameter | Plot |
|---|---|
| CZT HV Monitor | 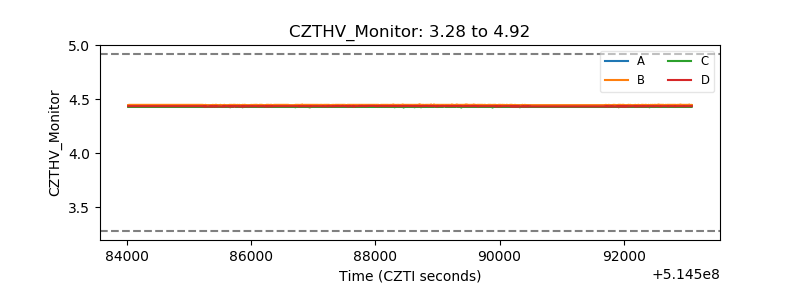 |
| D_VDD | 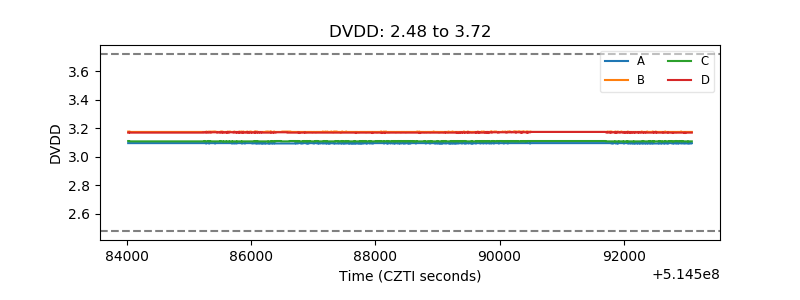 |
| Temperature 1 | 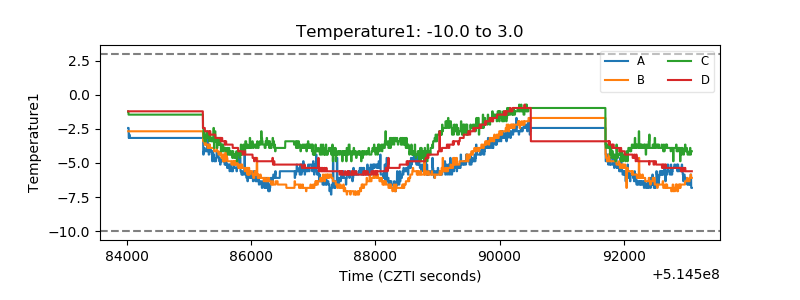 |
| Veto HV Monitor | 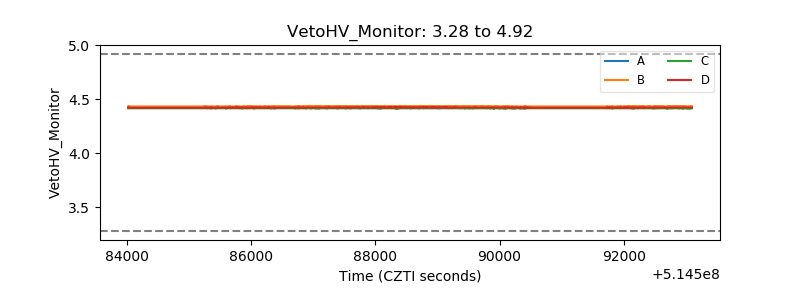 |
| Veto LLD | 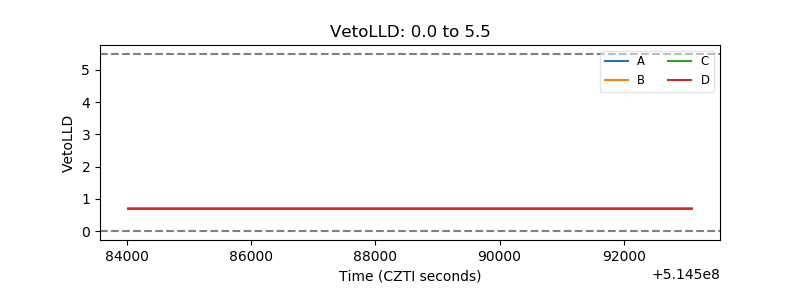 |
| Alpha Counter | 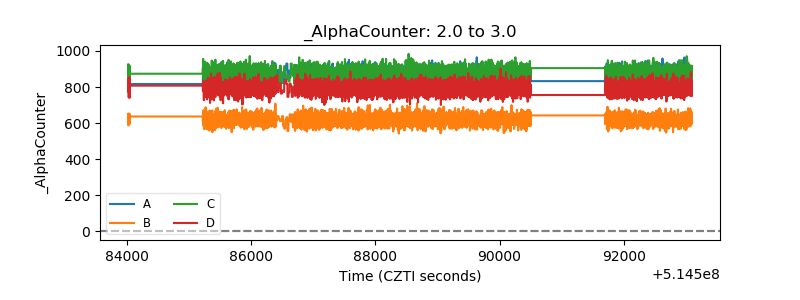 |
| _CPM_Rate | 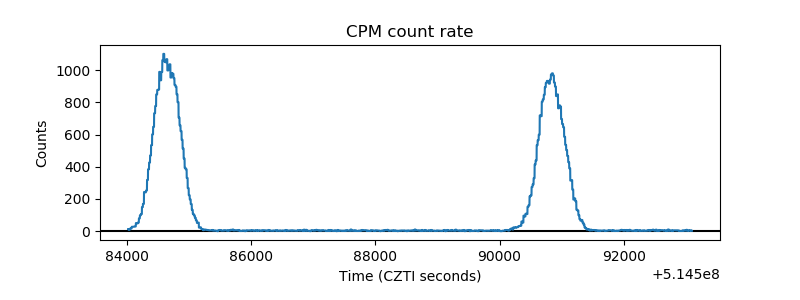 |
| CZT Counter | 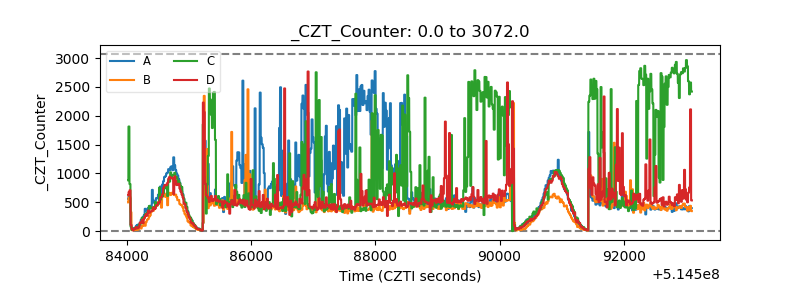 |
| +2.5 Volts monitor |  |
| +5 Volts monitor |  |
| _ROLL_ROT | 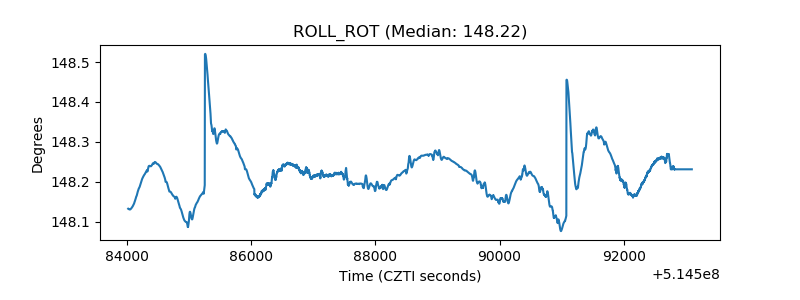 |
| _Roll_DEC | 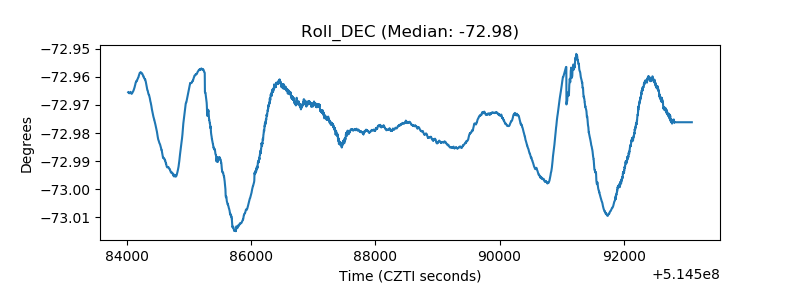 |
| _Roll_RA | 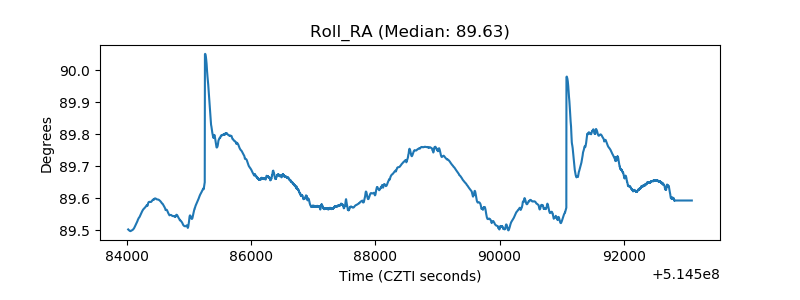 |
| Veto Counter | 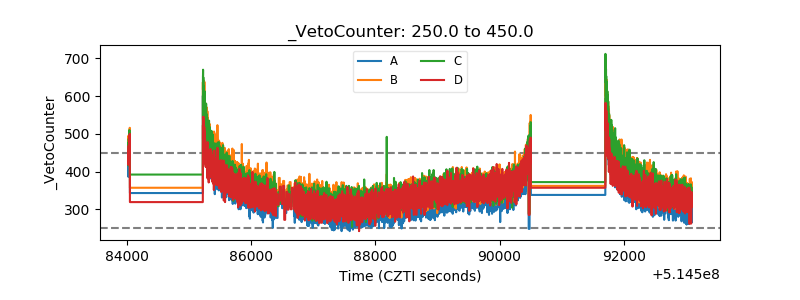 |