| Param | Original file | Final file |
|---|---|---|
| Filename | modeM0/AS1A14_070T08_9000006568_57176cztM0_level2.fits | modeM0/AS1A14_070T08_9000006568_57176cztM0_level2_quad_clean.evt |
| Size (bytes) | 538,836,480 | 84,755,520 |
| Size | 513.9 MB | 80.8 MB |
| Events in quadrant A | 3,321,767 | 596,500 |
| Events in quadrant B | 3,309,891 | 636,030 |
| Events in quadrant C | 8,926,091 | 369,647 |
| Events in quadrant D | 3,882,846 | 510,717 |
| Mode M9 | |||
|---|---|---|---|
| Quadrant | BADHDUFLAG | Total packets | Discarded packets |
| A | 0 | 23 | 0 |
| B | 0 | 23 | 0 |
| C | 0 | 23 | 0 |
| D | 0 | 23 | 0 |
| Mode SS | |||
|---|---|---|---|
| Quadrant | BADHDUFLAG | Total packets | Discarded packets |
| A | 0 | 134 | 0 |
| B | 0 | 134 | 0 |
| C | 0 | 134 | 0 |
| D | 0 | 134 | 0 |
| Mode M0 | |||
|---|---|---|---|
| Quadrant | BADHDUFLAG | Total packets | Discarded packets |
| A | 0 | 14509 | 2 |
| B | 0 | 14553 | 2 |
| C | 0 | 30964 | 2 |
| D | 0 | 15625 | 3 |
| Quadrant | Total seconds | Saturated seconds | Saturation percentage |
|---|---|---|---|
| A | 6500 | 86 | 1.323077% |
| B | 6501 | 184 | 2.830334% |
| C | 6501 | 2260 | 34.763882% |
| D | 6500 | 95 | 1.461538% |
Noise dominated data is calculated using 1-second bins in cleaned event files. If a bin has >2000 counts, and if more than 50% of those come from <1% of pixels, then it is considered to be noise-dominated and hence unusable.
| Quadrant | # 1 sec bins | Bins with >0 counts | Bins with >2000 counts | High rate bins dominated by noise | Noise dominated (total time) | Noise dominated (detector-on time) | Marked lightcurve |
|---|---|---|---|---|---|---|---|
| A | 9157 | 6780 | 37 | 37 | 0.40% | 0.55% | 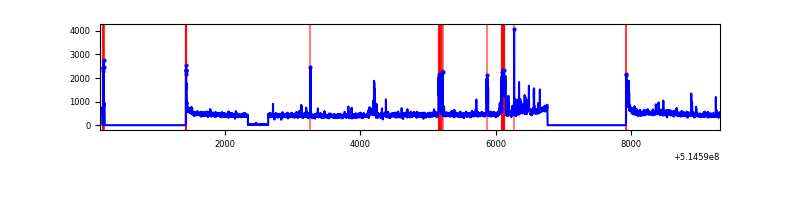 |
| B | 9158 | 6781 | 93 | 93 | 1.02% | 1.37% | 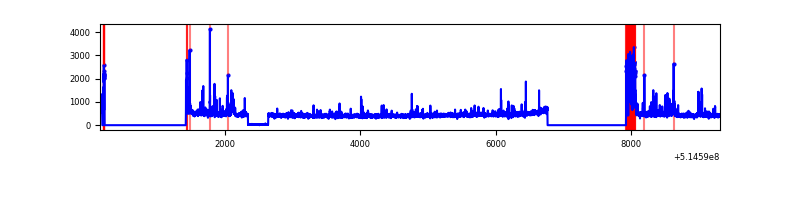 |
| C | 9158 | 6643 | 1977 | 1977 | 21.59% | 29.76% | 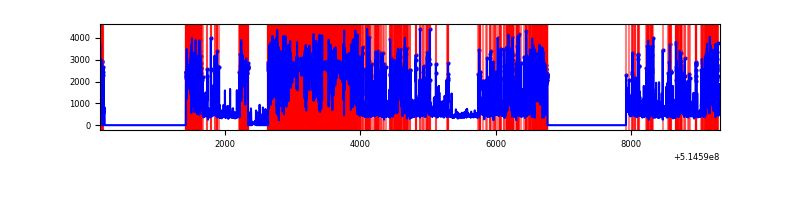 |
| D | 9157 | 6780 | 67 | 67 | 0.73% | 0.99% | 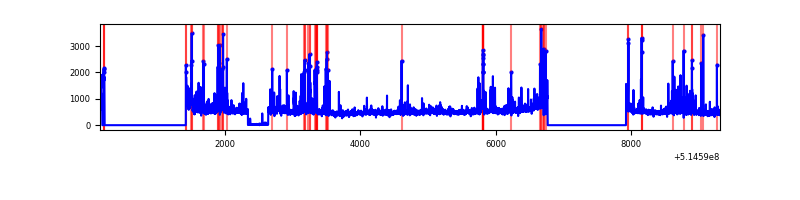 |
Top three noisy pixels from each quadrant. If the there are fewer than three noisy pixels in the level2.evt file, extra rows are filled as -1
| Pixel properties | Quadrant properties | ||||||
|---|---|---|---|---|---|---|---|
| Quadrant | DetID | PixID | Counts | Sigma | Mean | Median | Sigma |
| A | 3 | 14 | 556251 | 3210.35 | 697 | 679 | 173.1 |
| A | 13 | 248 | 18537 | 103.19 | 697 | 679 | 173.1 |
| A | 10 | 251 | 13338 | 73.15 | 697 | 679 | 173.1 |
| B | 10 | 16 | 364033 | 2503.93 | 687 | 662 | 145.1 |
| B | 2 | 249 | 63408 | 432.37 | 687 | 662 | 145.1 |
| B | 5 | 185 | 36029 | 243.71 | 687 | 662 | 145.1 |
| C | 15 | 224 | 6619124 | 44152.24 | 547 | 542 | 149.9 |
| C | 14 | 67 | 41694 | 274.52 | 547 | 542 | 149.9 |
| C | 14 | 254 | 39979 | 263.08 | 547 | 542 | 149.9 |
| D | 5 | 113 | 428115 | 2244.99 | 667 | 633 | 190.4 |
| D | 12 | 33 | 155902 | 815.42 | 667 | 633 | 190.4 |
| D | 8 | 240 | 141743 | 741.06 | 667 | 633 | 190.4 |
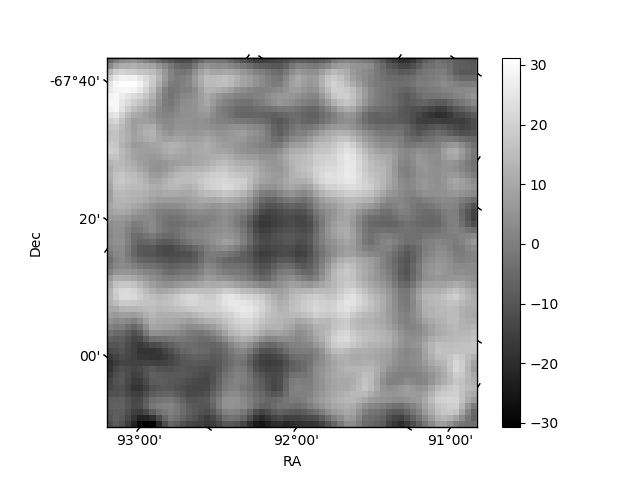
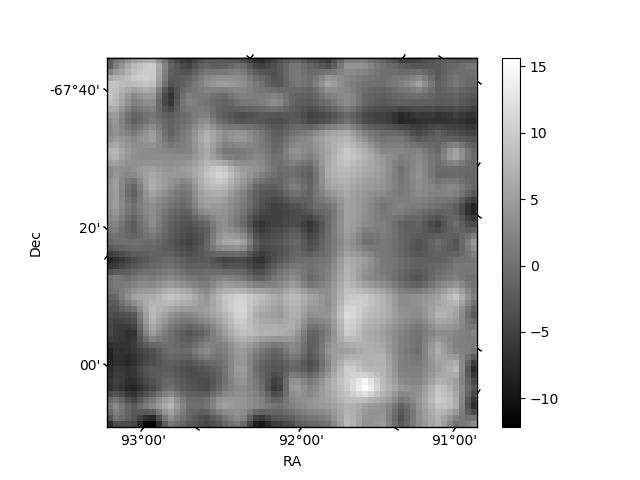
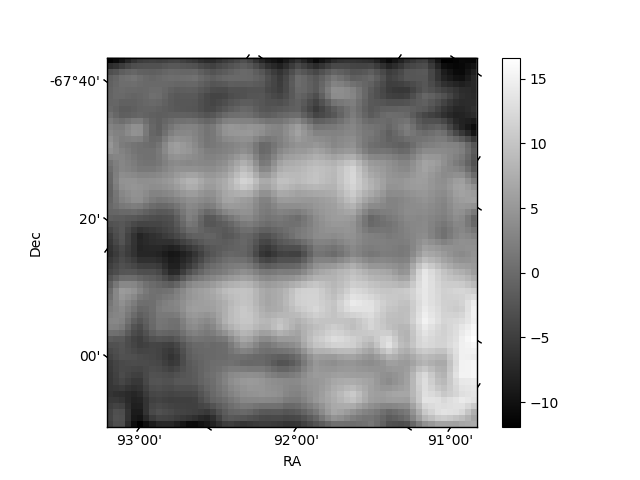
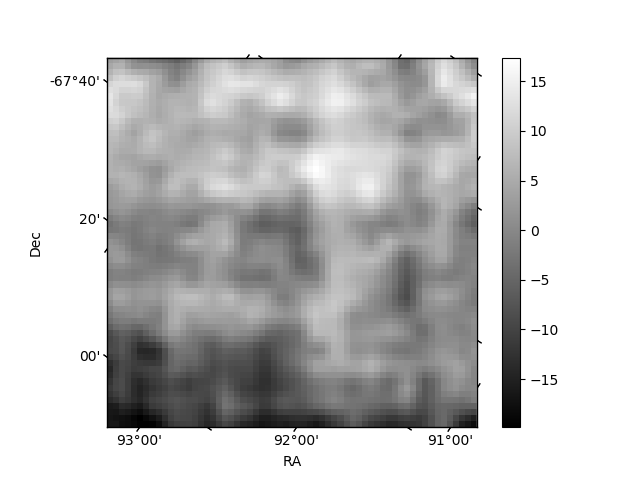
Histogram calculated using DETX and DETY for each event in the final _common_clean file
| Quadrant A | 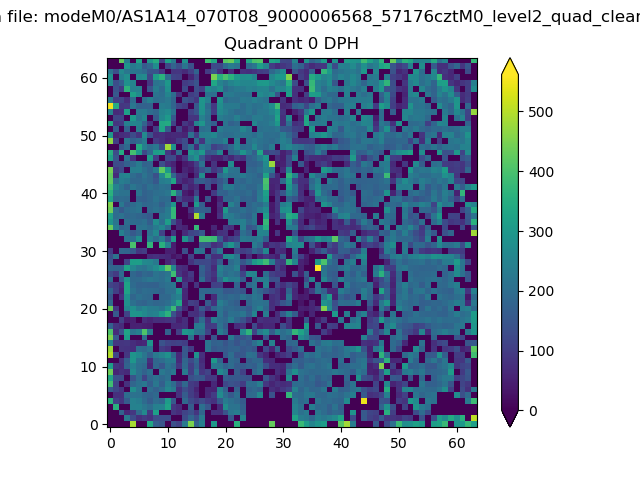 |
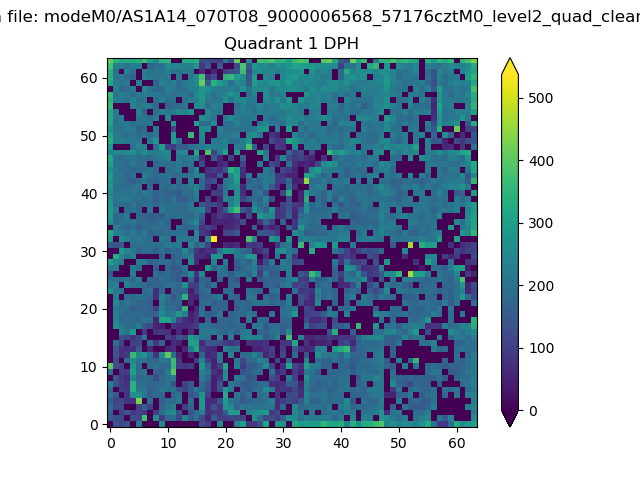 |
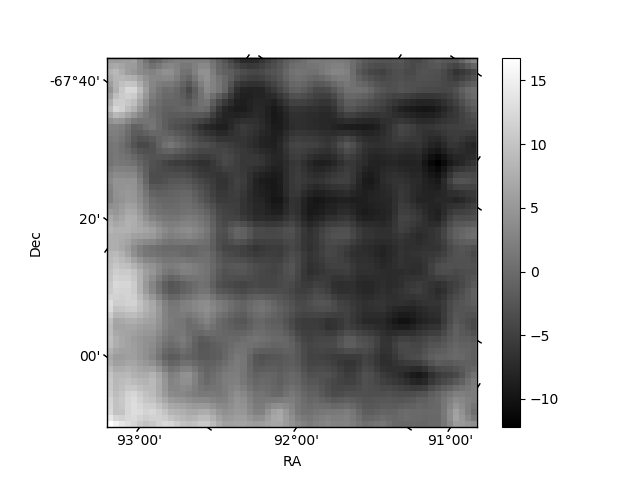
Quadrant B |
|---|---|---|---|
| Quadrant D | 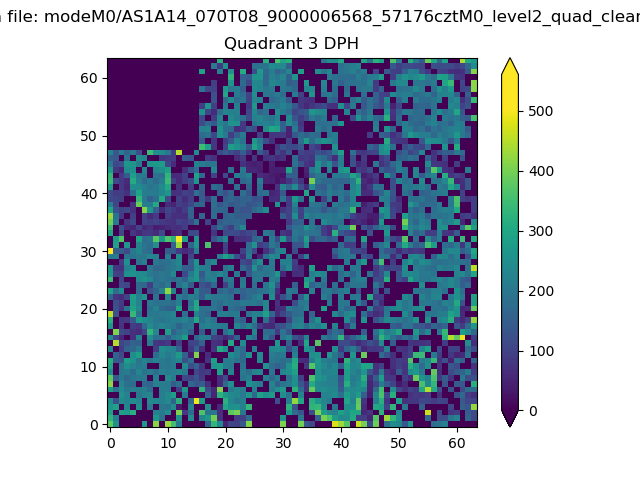 |
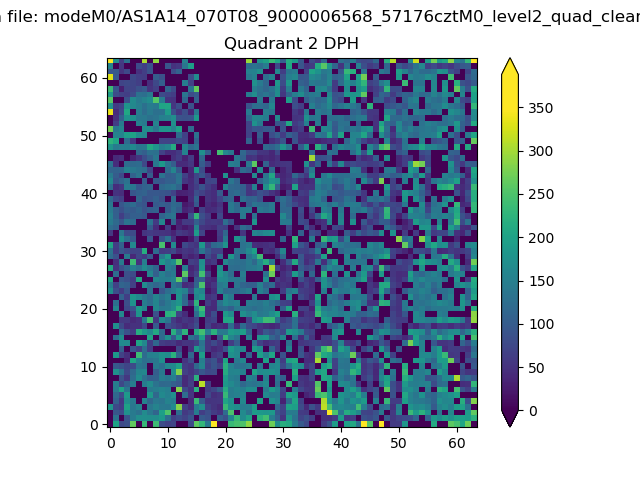 |
Quadrant C |
| Plot type | Count rate plots | Images |
|---|---|---|
| Comparison with Poisson distribution Blue bars denote a histogram of data divided into 1 sec bins. Red curve is a Poisson curve with rate = median count rate of data. |
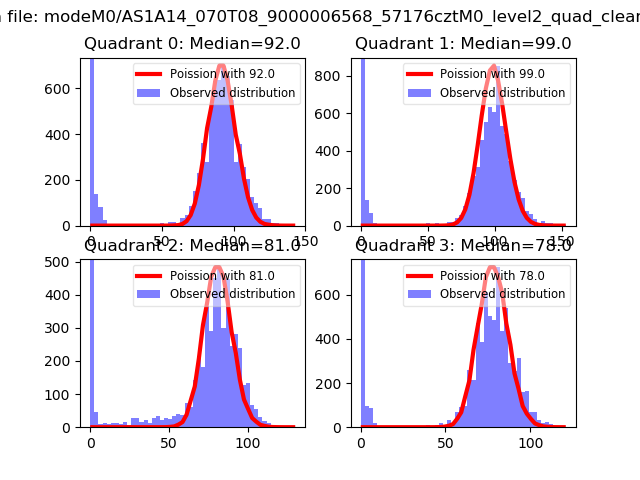 |
 |
| Quadrant-wise count rates Data is divided into 100 sec bins |
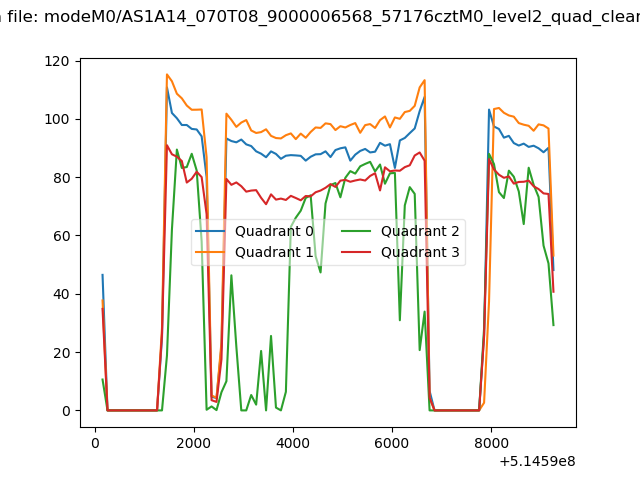 |
|
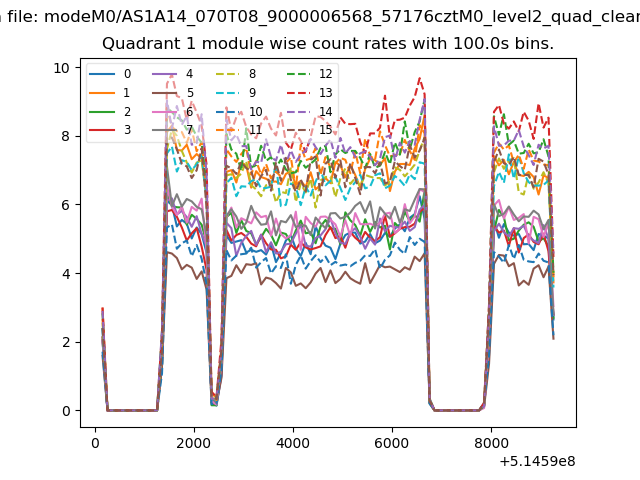
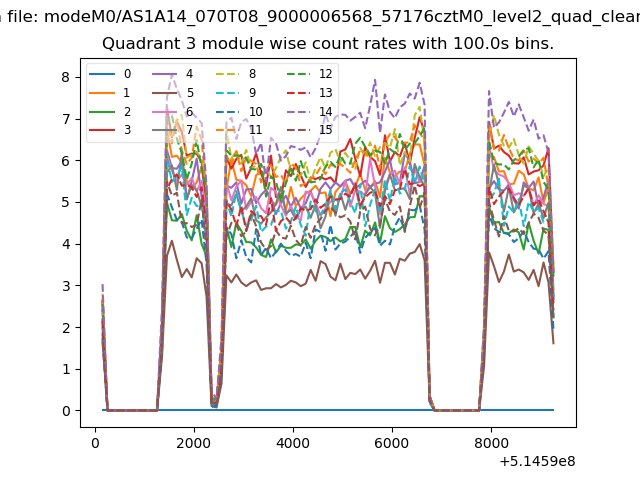
| Module-wise count rates for Quadrant A Data is divided into 100 sec bins |
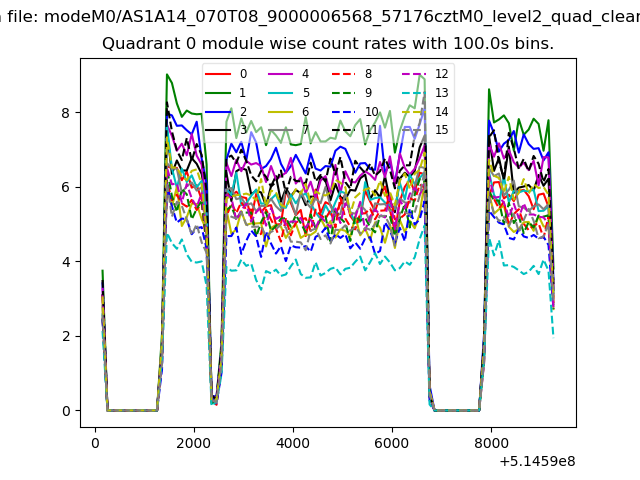 |
 |
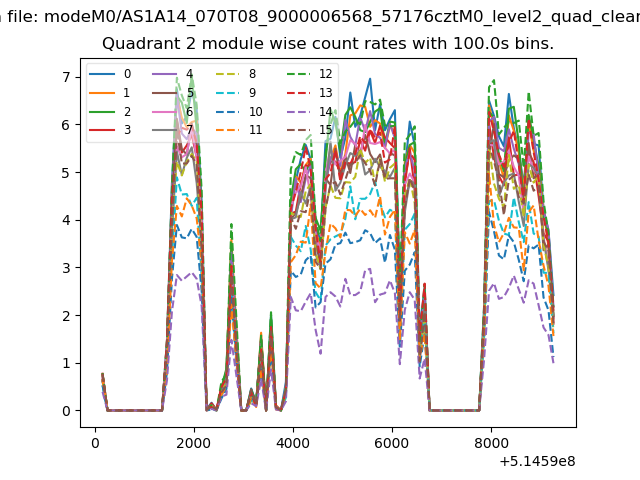
| Module-wise count rates for Quadrant B Data is divided into 100 sec bins |
 |
 |
| Module-wise count rates for Quadrant C Data is divided into 100 sec bins |
 |
 |
| Module-wise count rates for Quadrant D Data is divided into 100 sec bins |
 |
 |
| Parameter | Plot |
|---|---|
| CZT HV Monitor | 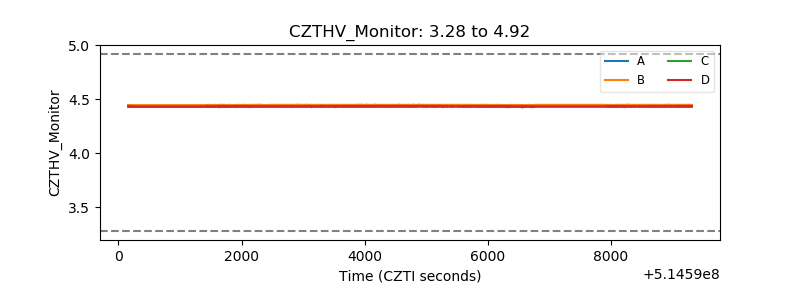 |
| D_VDD | 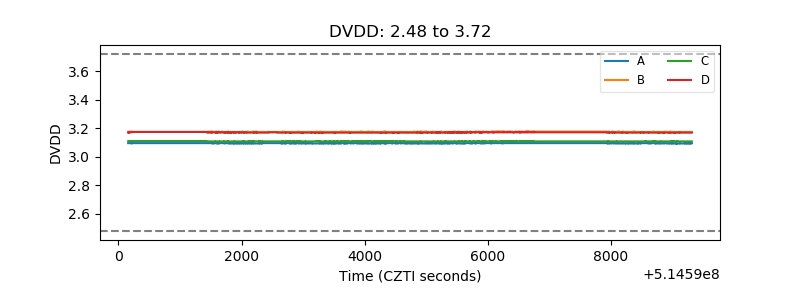 |
| Temperature 1 | 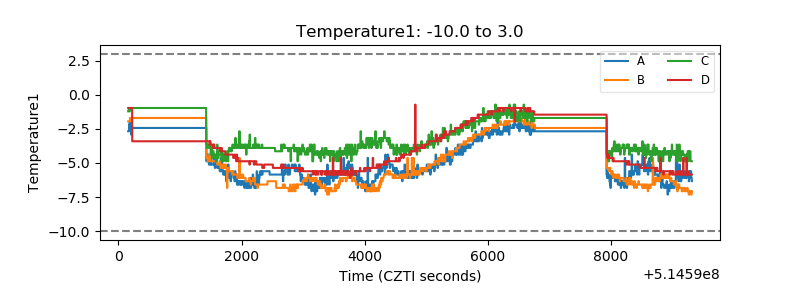 |
| Veto HV Monitor | 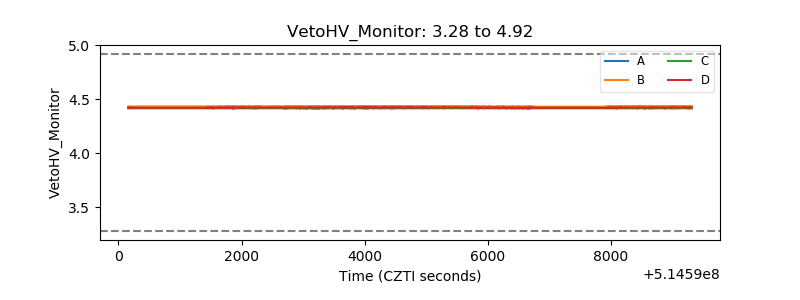 |
| Veto LLD | 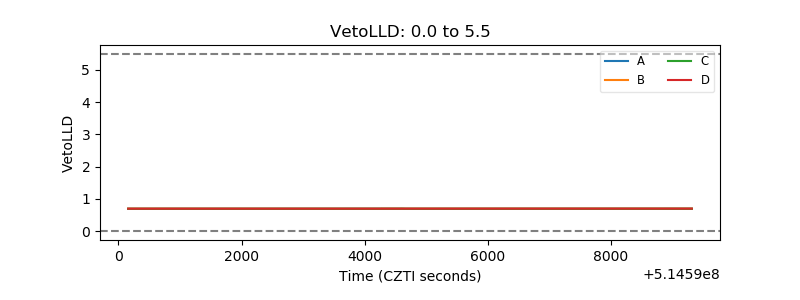 |
| Alpha Counter | 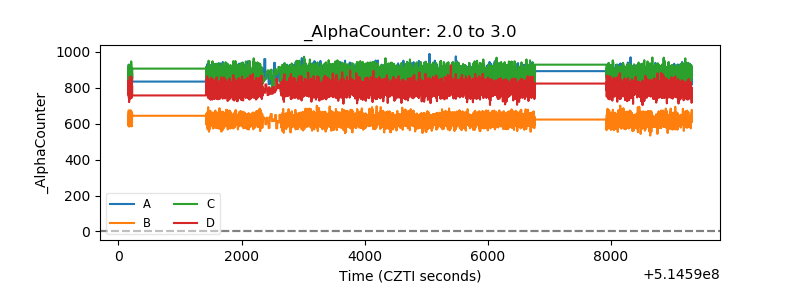 |
| _CPM_Rate | 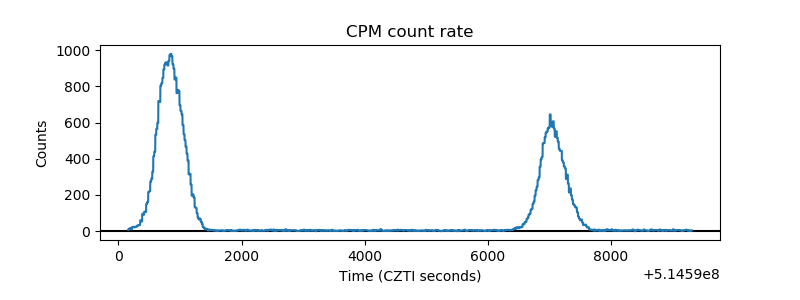 |
| CZT Counter | 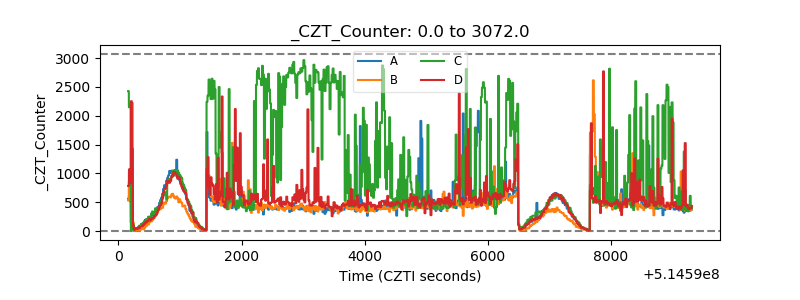 |
| +2.5 Volts monitor |  |
| +5 Volts monitor |  |
| _ROLL_ROT | 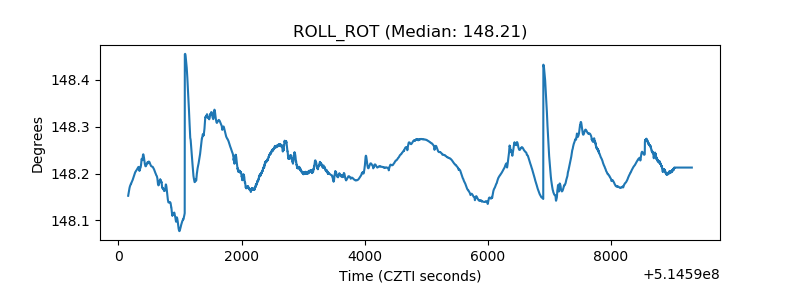 |
| _Roll_DEC | 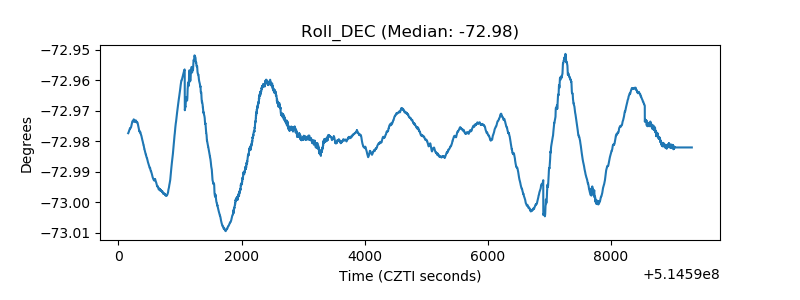 |
| _Roll_RA | 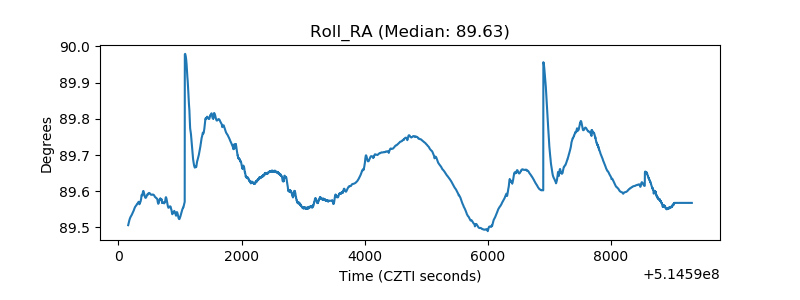 |
| Veto Counter | 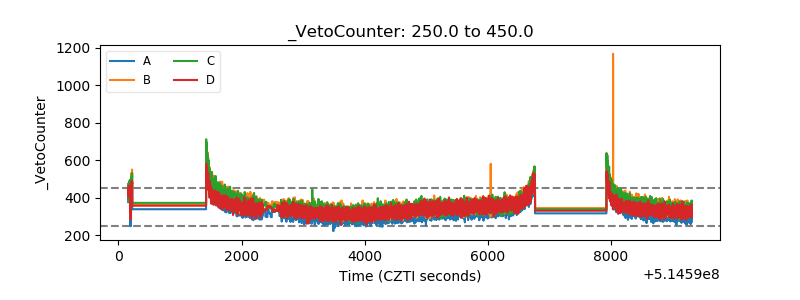 |