| Param | Original file | Final file |
|---|---|---|
| Filename | modeM0/AS1A14_070T08_9000006568_57177cztM0_level2.fits | modeM0/AS1A14_070T08_9000006568_57177cztM0_level2_quad_clean.evt |
| Size (bytes) | 486,907,200 | 92,350,080 |
| Size | 464.4 MB | 88.1 MB |
| Events in quadrant A | 3,321,867 | 606,384 |
| Events in quadrant B | 4,107,562 | 641,744 |
| Events in quadrant C | 5,720,989 | 539,141 |
| Events in quadrant D | 4,320,173 | 512,450 |
| Mode M9 | |||
|---|---|---|---|
| Quadrant | BADHDUFLAG | Total packets | Discarded packets |
| A | 0 | 21 | 0 |
| B | 0 | 21 | 0 |
| C | 0 | 21 | 0 |
| D | 0 | 21 | 0 |
| Mode SS | |||
|---|---|---|---|
| Quadrant | BADHDUFLAG | Total packets | Discarded packets |
| A | 0 | 150 | 0 |
| B | 0 | 150 | 0 |
| C | 0 | 150 | 0 |
| D | 0 | 150 | 0 |
| Mode M0 | |||
|---|---|---|---|
| Quadrant | BADHDUFLAG | Total packets | Discarded packets |
| A | 0 | 15206 | 2 |
| B | 0 | 17460 | 2 |
| C | 0 | 21981 | 2 |
| D | 0 | 17723 | 2 |
| Quadrant | Total seconds | Saturated seconds | Saturation percentage |
|---|---|---|---|
| A | 7115 | 72 | 1.011947% |
| B | 7115 | 407 | 5.720309% |
| C | 7115 | 672 | 9.444835% |
| D | 7115 | 206 | 2.895292% |
Noise dominated data is calculated using 1-second bins in cleaned event files. If a bin has >2000 counts, and if more than 50% of those come from <1% of pixels, then it is considered to be noise-dominated and hence unusable.
| Quadrant | # 1 sec bins | Bins with >0 counts | Bins with >2000 counts | High rate bins dominated by noise | Noise dominated (total time) | Noise dominated (detector-on time) | Marked lightcurve |
|---|---|---|---|---|---|---|---|
| A | 9597 | 7400 | 18 | 18 | 0.19% | 0.24% | 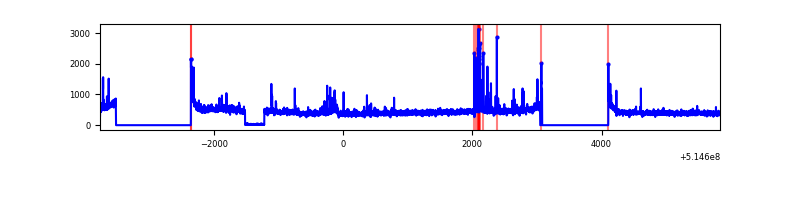 |
| B | 9597 | 7399 | 259 | 259 | 2.70% | 3.50% | 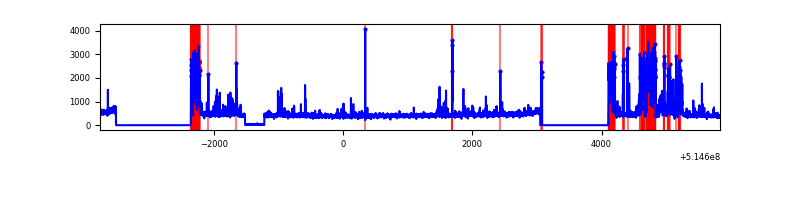 |
| C | 9597 | 7399 | 528 | 528 | 5.50% | 7.14% | 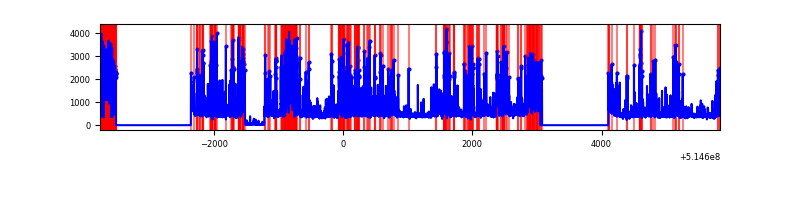 |
| D | 9597 | 7392 | 141 | 141 | 1.47% | 1.91% | 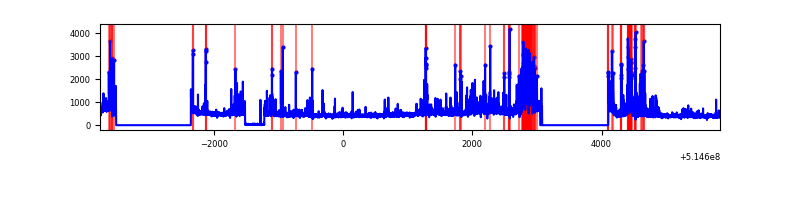 |
Top three noisy pixels from each quadrant. If the there are fewer than three noisy pixels in the level2.evt file, extra rows are filled as -1
| Pixel properties | Quadrant properties | ||||||
|---|---|---|---|---|---|---|---|
| Quadrant | DetID | PixID | Counts | Sigma | Mean | Median | Sigma |
| A | 3 | 14 | 204707 | 1081.43 | 760 | 740 | 188.6 |
| A | 13 | 248 | 118020 | 621.81 | 760 | 740 | 188.6 |
| A | 10 | 251 | 15609 | 78.83 | 760 | 740 | 188.6 |
| B | 10 | 16 | 1018900 | 6474.57 | 737 | 709 | 157.3 |
| B | 10 | 247 | 48109 | 301.41 | 737 | 709 | 157.3 |
| B | 2 | 249 | 43569 | 272.54 | 737 | 709 | 157.3 |
| C | 15 | 224 | 2683094 | 13863.12 | 709 | 703 | 193.5 |
| C | 14 | 254 | 82842 | 424.51 | 709 | 703 | 193.5 |
| C | 14 | 67 | 63121 | 322.59 | 709 | 703 | 193.5 |
| D | 2 | 249 | 567362 | 2737.35 | 727 | 694 | 207.0 |
| D | 5 | 113 | 300896 | 1450.16 | 727 | 694 | 207.0 |
| D | 12 | 33 | 201283 | 968.97 | 727 | 694 | 207.0 |
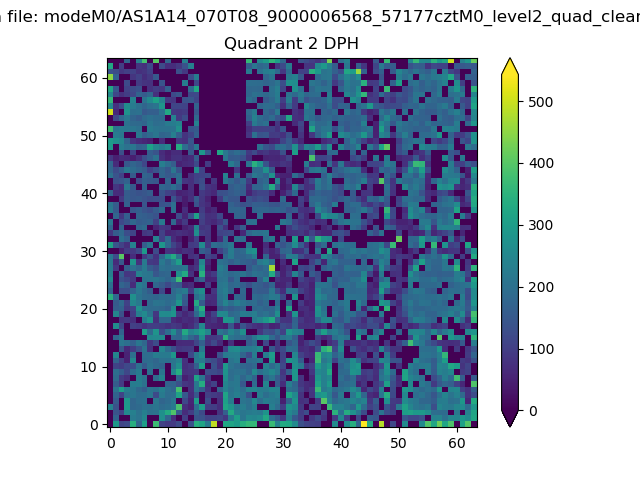
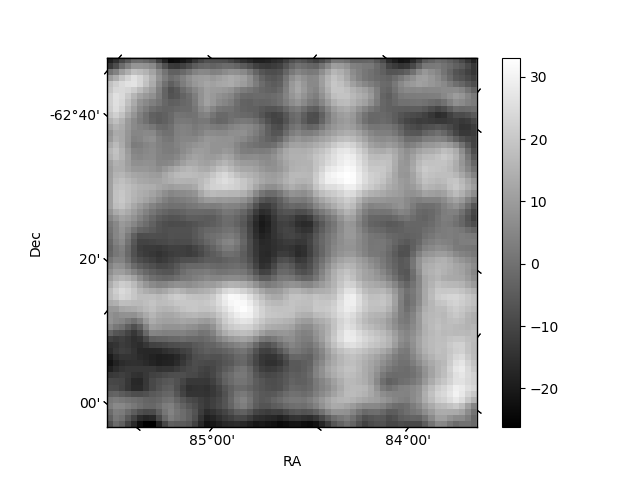
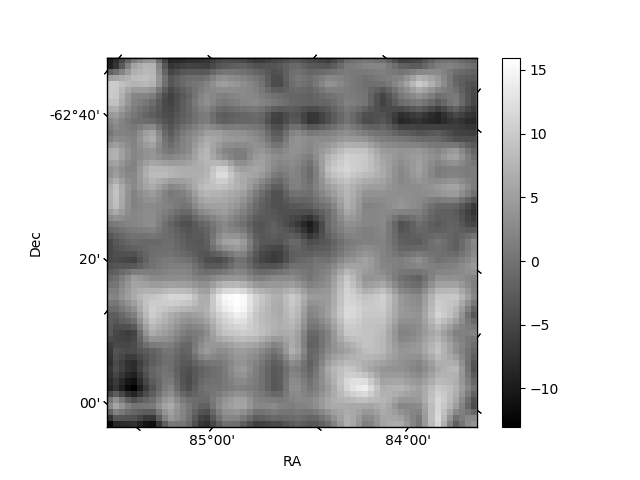
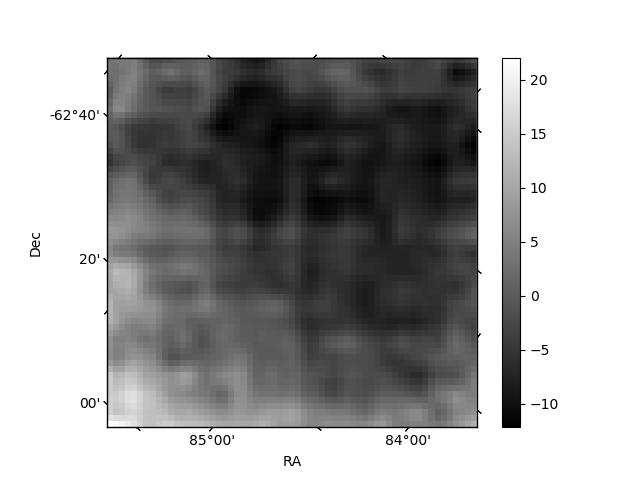
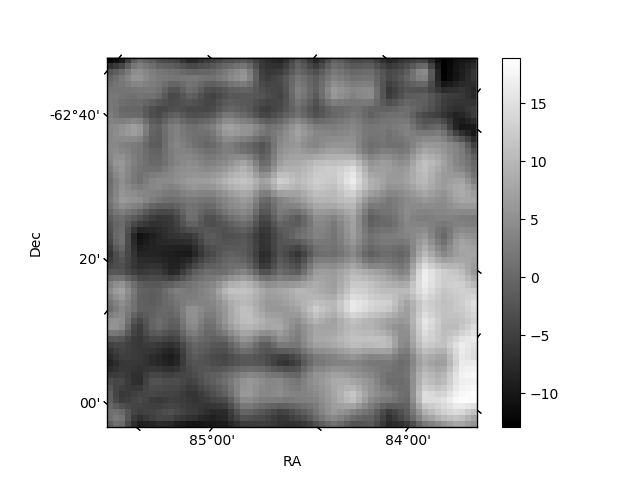
Histogram calculated using DETX and DETY for each event in the final _common_clean file
| Quadrant A | 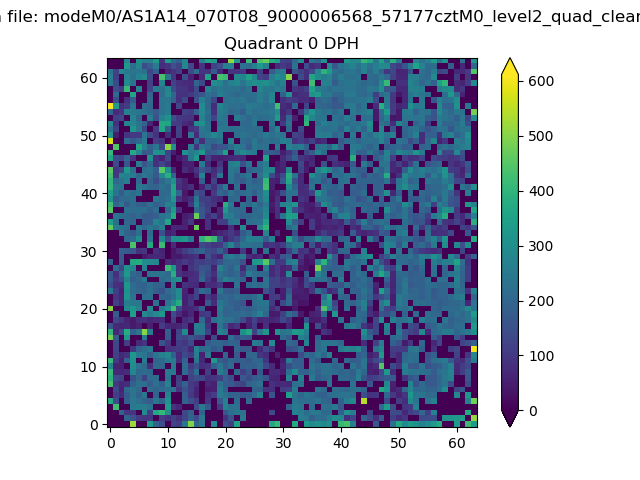 |
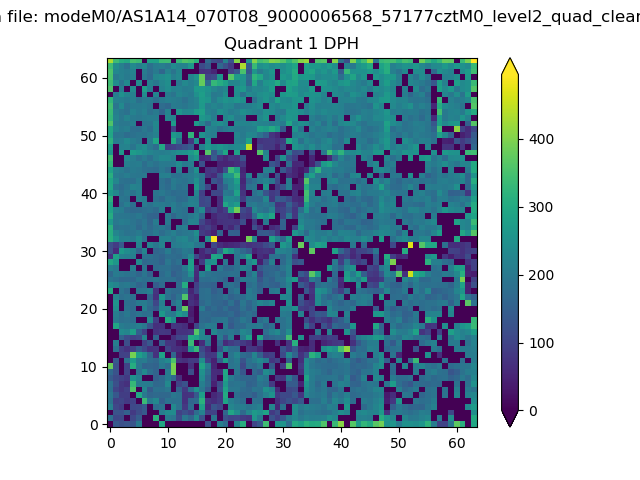 |
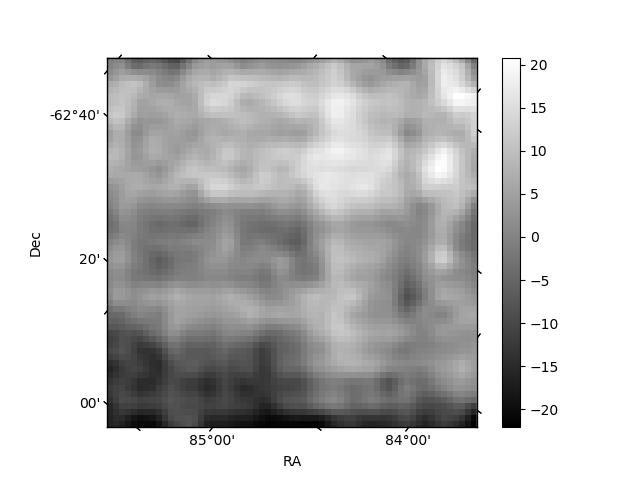
Quadrant B |
|---|---|---|---|
| Quadrant D | 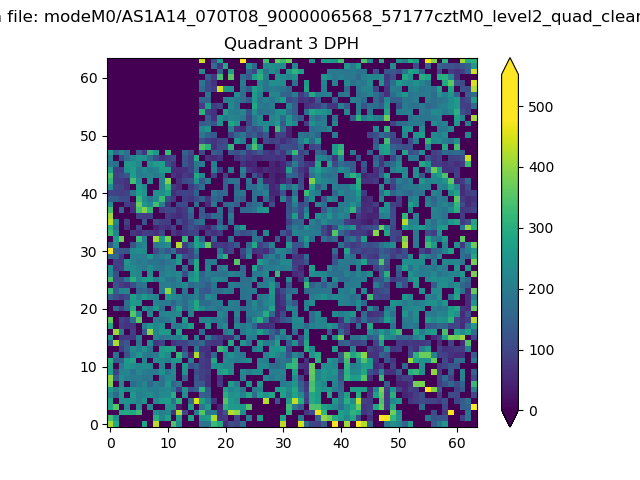 |
 |
Quadrant C |
| Plot type | Count rate plots | Images |
|---|---|---|
| Comparison with Poisson distribution Blue bars denote a histogram of data divided into 1 sec bins. Red curve is a Poisson curve with rate = median count rate of data. |
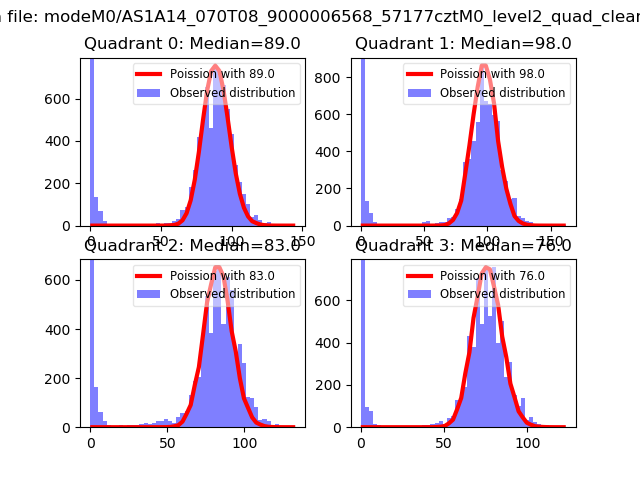 |
 |
| Quadrant-wise count rates Data is divided into 100 sec bins |
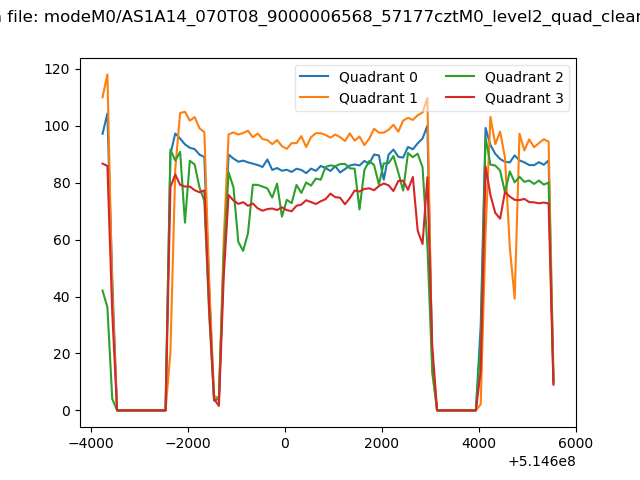 |
|
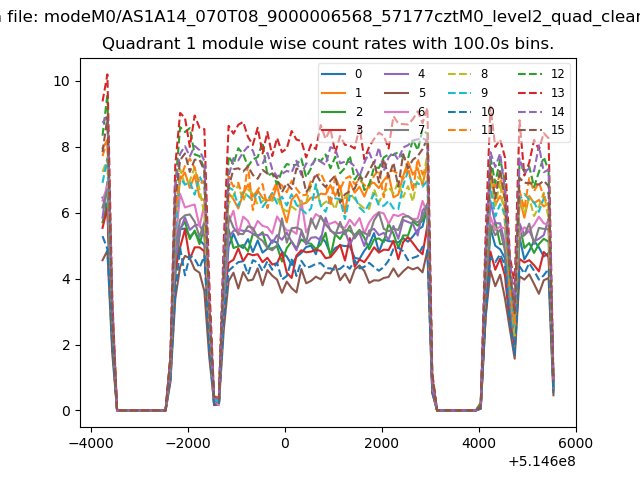
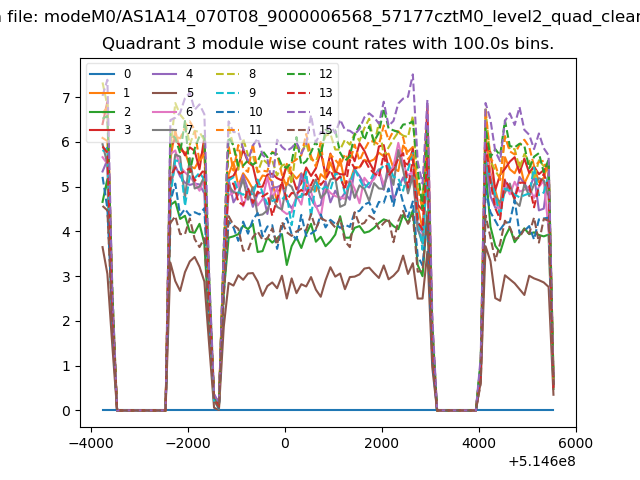
| Module-wise count rates for Quadrant A Data is divided into 100 sec bins |
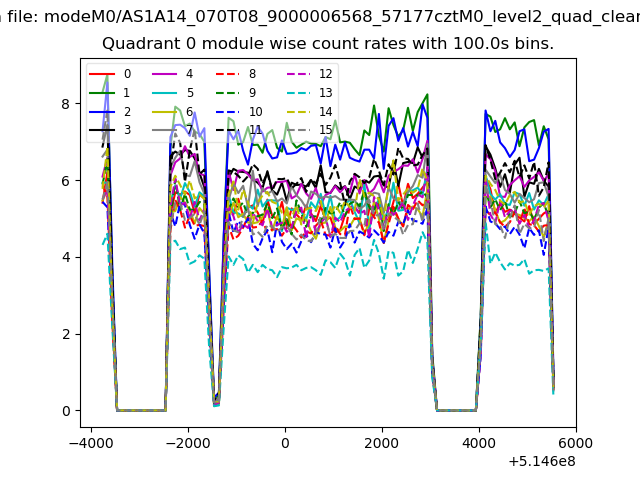 |
 |
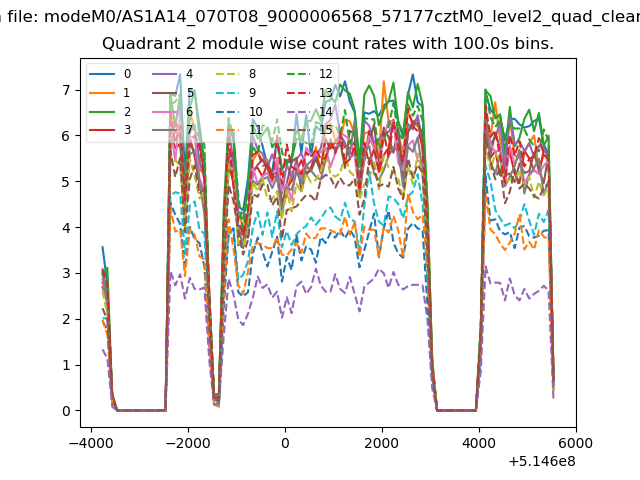
| Module-wise count rates for Quadrant B Data is divided into 100 sec bins |
 |
 |
| Module-wise count rates for Quadrant C Data is divided into 100 sec bins |
 |
 |
| Module-wise count rates for Quadrant D Data is divided into 100 sec bins |
 |
 |
| Parameter | Plot |
|---|---|
| CZT HV Monitor | 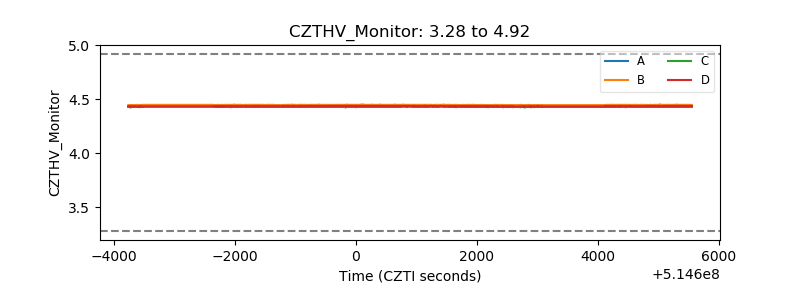 |
| D_VDD | 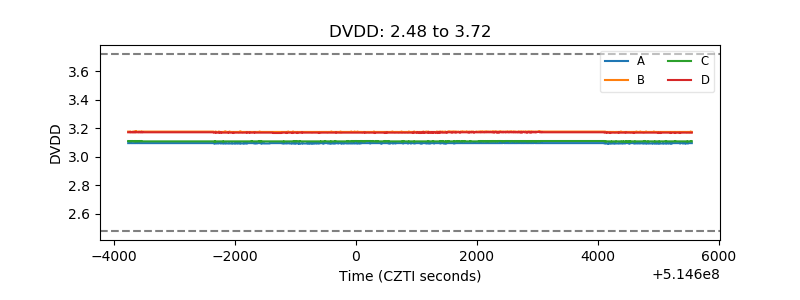 |
| Temperature 1 | 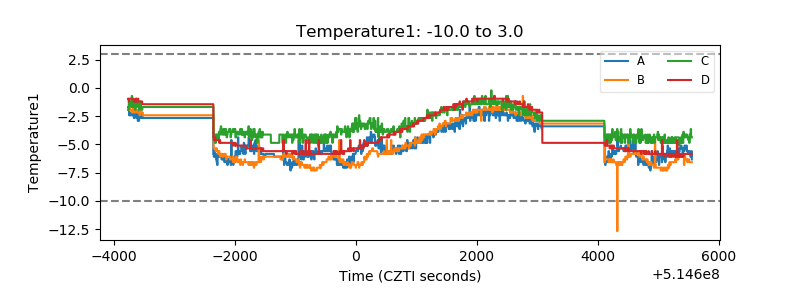 |
| Veto HV Monitor | 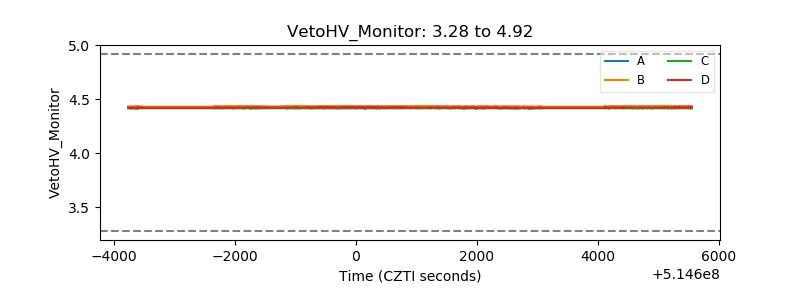 |
| Veto LLD | 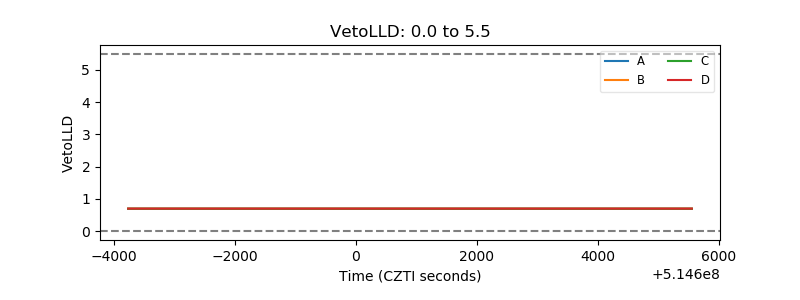 |
| Alpha Counter | 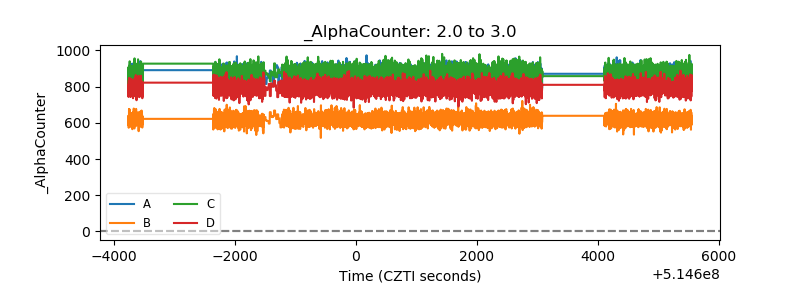 |
| _CPM_Rate | 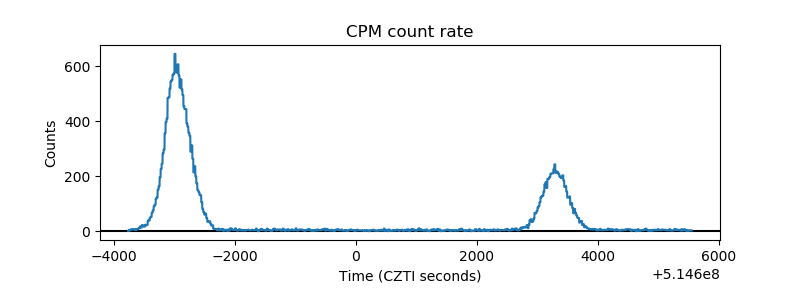 |
| CZT Counter | 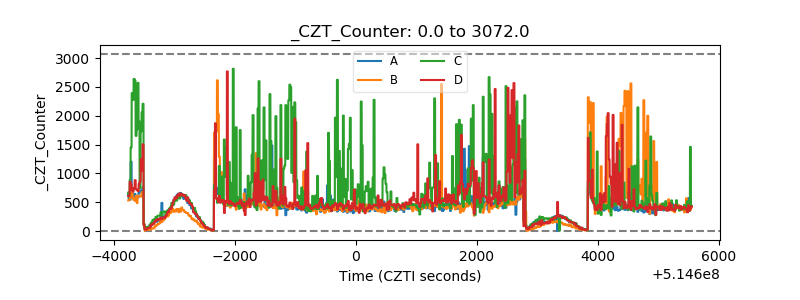 |
| +2.5 Volts monitor |  |
| +5 Volts monitor | 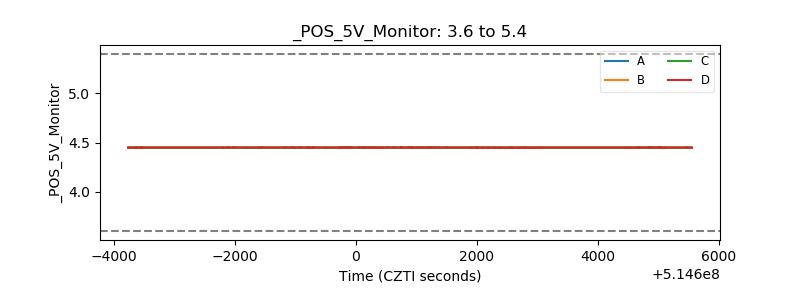 |
| _ROLL_ROT | 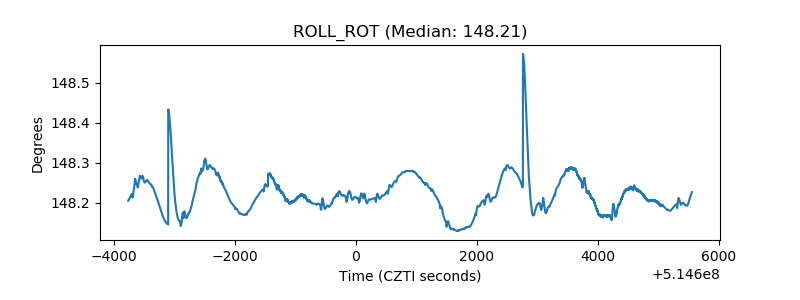 |
| _Roll_DEC | 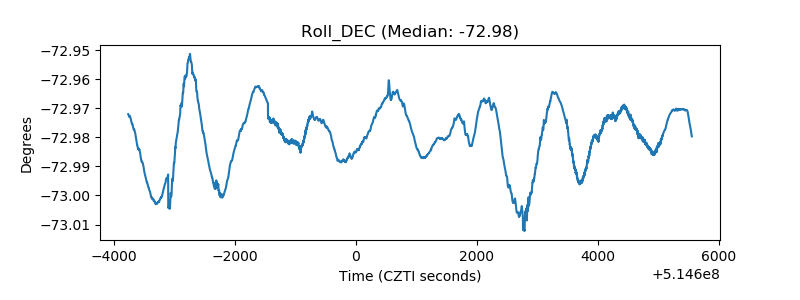 |
| _Roll_RA | 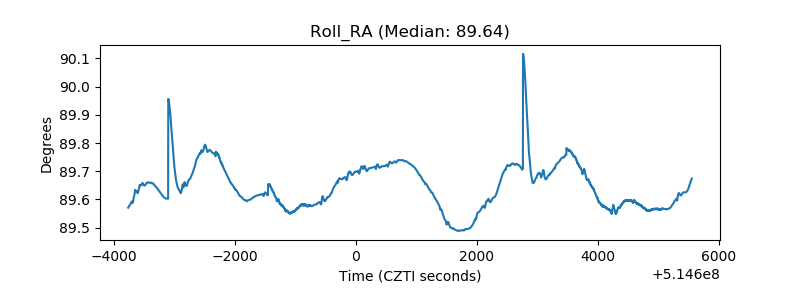 |
| Veto Counter | 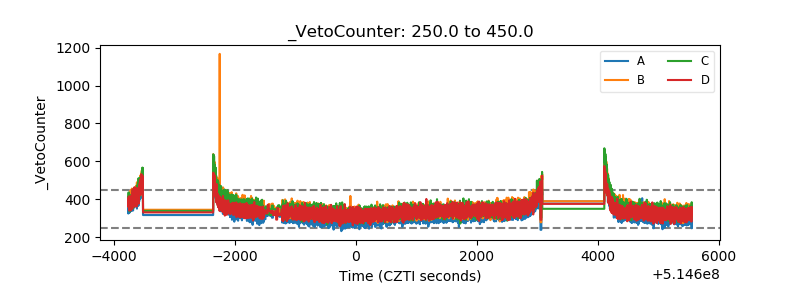 |