| Param | Original file | Final file |
|---|---|---|
| Filename | modeM0/AS1A14_070T08_9000006568_57178cztM0_level2.fits | modeM0/AS1A14_070T08_9000006568_57178cztM0_level2_quad_clean.evt |
| Size (bytes) | 464,253,120 | 93,306,240 |
| Size | 442.7 MB | 89.0 MB |
| Events in quadrant A | 2,819,861 | 628,666 |
| Events in quadrant B | 3,734,323 | 657,560 |
| Events in quadrant C | 6,502,373 | 525,017 |
| Events in quadrant D | 3,609,101 | 548,903 |
| Mode M9 | |||
|---|---|---|---|
| Quadrant | BADHDUFLAG | Total packets | Discarded packets |
| A | 0 | 7 | 0 |
| B | 0 | 7 | 0 |
| C | 0 | 7 | 0 |
| D | 0 | 7 | 0 |
| Mode SS | |||
|---|---|---|---|
| Quadrant | BADHDUFLAG | Total packets | Discarded packets |
| A | 0 | 134 | 0 |
| B | 0 | 134 | 0 |
| C | 0 | 134 | 0 |
| D | 0 | 134 | 0 |
| Mode M0 | |||
|---|---|---|---|
| Quadrant | BADHDUFLAG | Total packets | Discarded packets |
| A | 0 | 13687 | 1 |
| B | 0 | 16081 | 1 |
| C | 0 | 24033 | 1 |
| D | 0 | 15665 | 1 |
| Quadrant | Total seconds | Saturated seconds | Saturation percentage |
|---|---|---|---|
| A | 6674 | 89 | 1.333533% |
| B | 6675 | 346 | 5.183521% |
| C | 6675 | 1049 | 15.715356% |
| D | 6675 | 185 | 2.771536% |
Noise dominated data is calculated using 1-second bins in cleaned event files. If a bin has >2000 counts, and if more than 50% of those come from <1% of pixels, then it is considered to be noise-dominated and hence unusable.
| Quadrant | # 1 sec bins | Bins with >0 counts | Bins with >2000 counts | High rate bins dominated by noise | Noise dominated (total time) | Noise dominated (detector-on time) | Marked lightcurve |
|---|---|---|---|---|---|---|---|
| A | 7329 | 6675 | 2 | 2 | 0.03% | 0.03% | 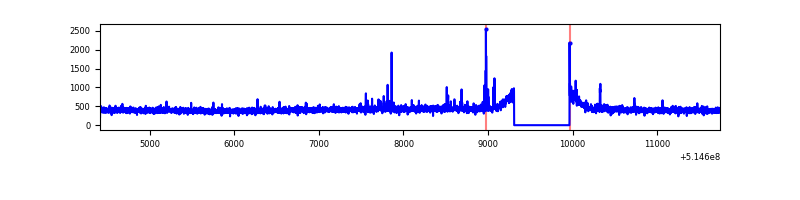 |
| B | 7330 | 6676 | 152 | 152 | 2.07% | 2.28% | 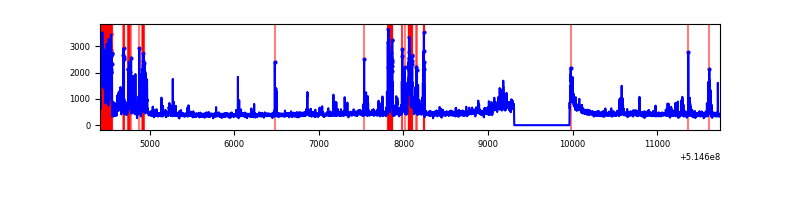 |
| C | 7330 | 6675 | 765 | 765 | 10.44% | 11.46% | 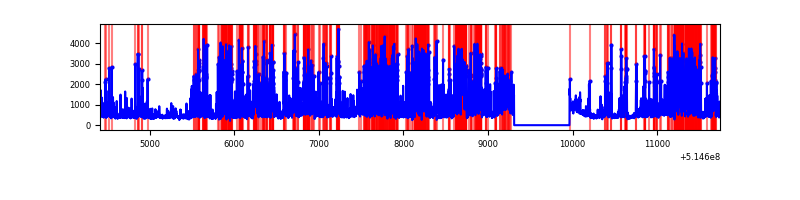 |
| D | 7330 | 6676 | 70 | 70 | 0.95% | 1.05% | 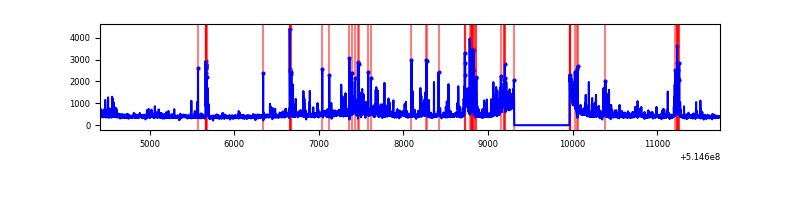 |
Top three noisy pixels from each quadrant. If the there are fewer than three noisy pixels in the level2.evt file, extra rows are filled as -1
| Pixel properties | Quadrant properties | ||||||
|---|---|---|---|---|---|---|---|
| Quadrant | DetID | PixID | Counts | Sigma | Mean | Median | Sigma |
| A | 3 | 14 | 30962 | 172.86 | 709 | 689 | 175.1 |
| A | 10 | 251 | 27352 | 152.24 | 709 | 689 | 175.1 |
| A | 13 | 254 | 12234 | 65.92 | 709 | 689 | 175.1 |
| B | 10 | 16 | 511178 | 3463.06 | 695 | 669 | 147.4 |
| B | 5 | 185 | 265275 | 1794.97 | 695 | 669 | 147.4 |
| B | 2 | 249 | 57156 | 383.18 | 695 | 669 | 147.4 |
| C | 15 | 224 | 3705388 | 21110.89 | 648 | 641 | 175.5 |
| C | 14 | 67 | 81525 | 460.9 | 648 | 641 | 175.5 |
| C | 14 | 254 | 77281 | 436.72 | 648 | 641 | 175.5 |
| D | 2 | 249 | 361958 | 1878.54 | 680 | 648 | 192.3 |
| D | 8 | 240 | 181258 | 939.04 | 680 | 648 | 192.3 |
| D | 15 | 142 | 107993 | 558.11 | 680 | 648 | 192.3 |
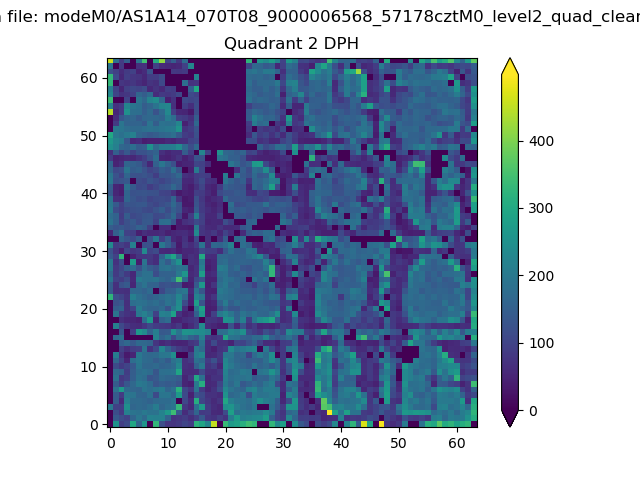
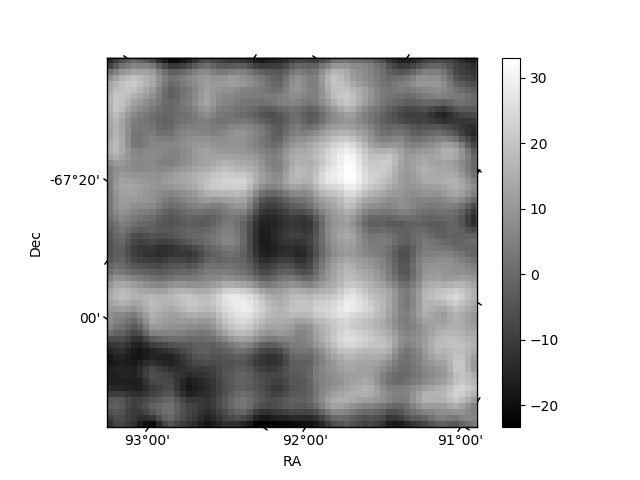
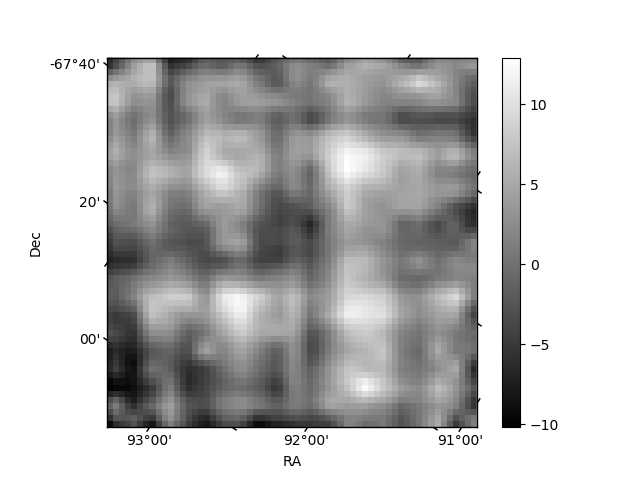
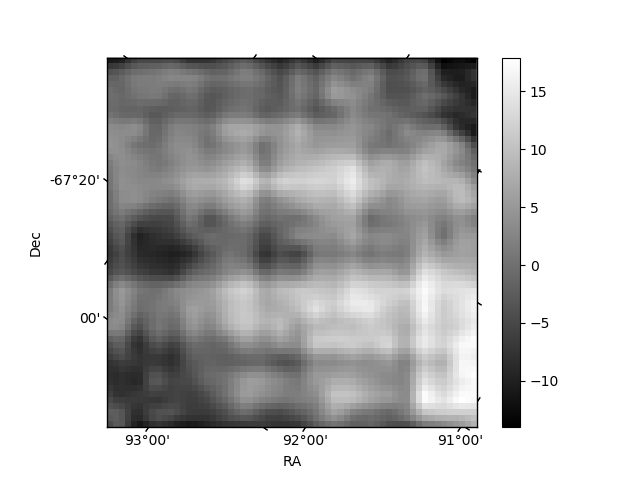
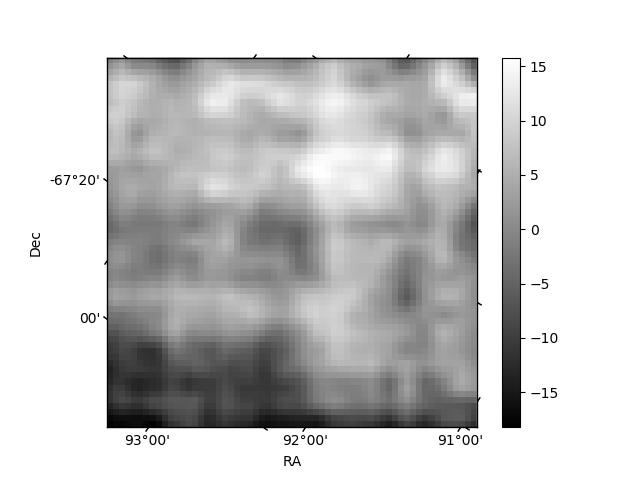
Histogram calculated using DETX and DETY for each event in the final _common_clean file
| Quadrant A | 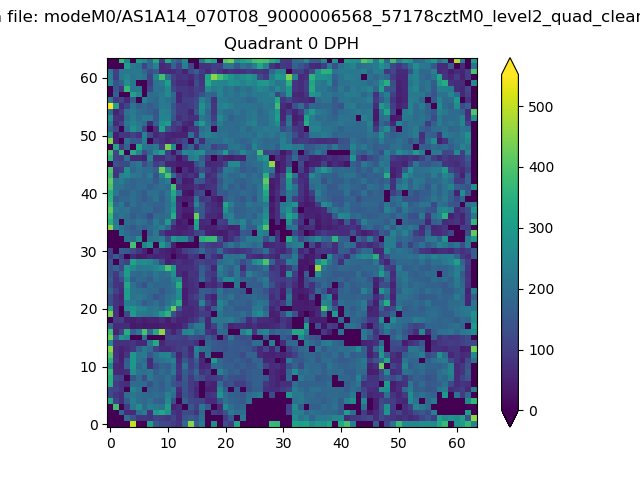 |
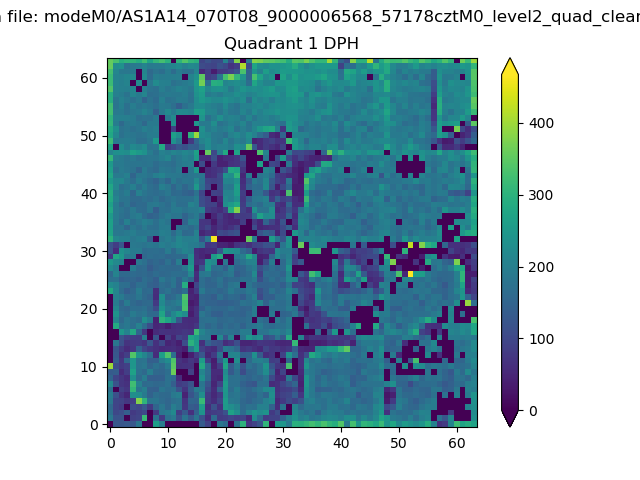 |
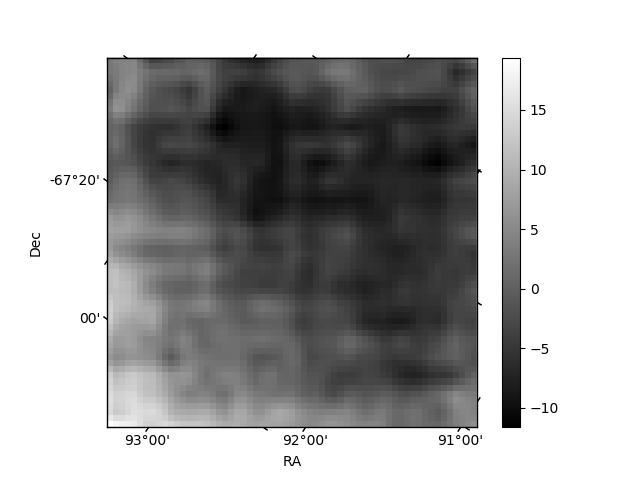
Quadrant B |
|---|---|---|---|
| Quadrant D | 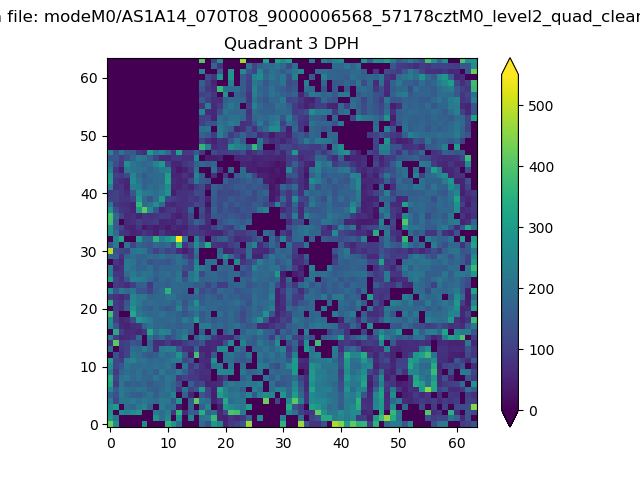 |
 |
Quadrant C |
| Plot type | Count rate plots | Images |
|---|---|---|
| Comparison with Poisson distribution Blue bars denote a histogram of data divided into 1 sec bins. Red curve is a Poisson curve with rate = median count rate of data. |
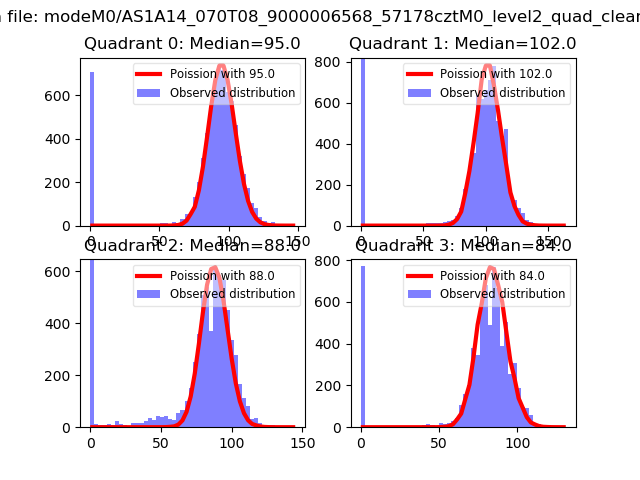 |
 |
| Quadrant-wise count rates Data is divided into 100 sec bins |
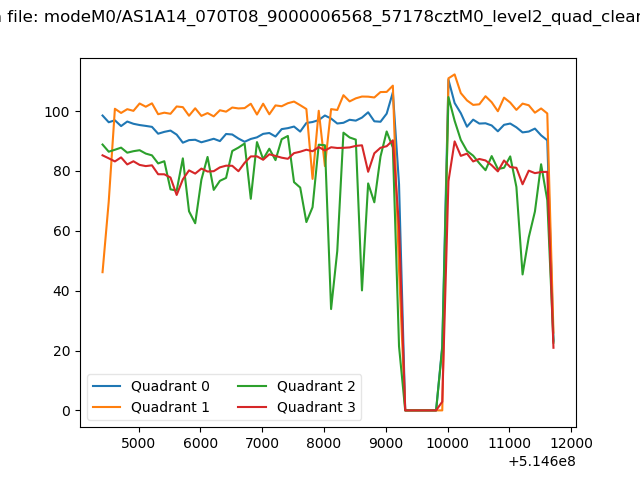 |
|
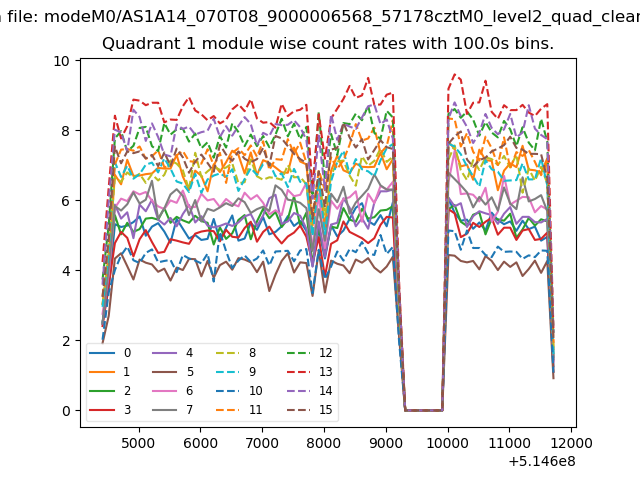
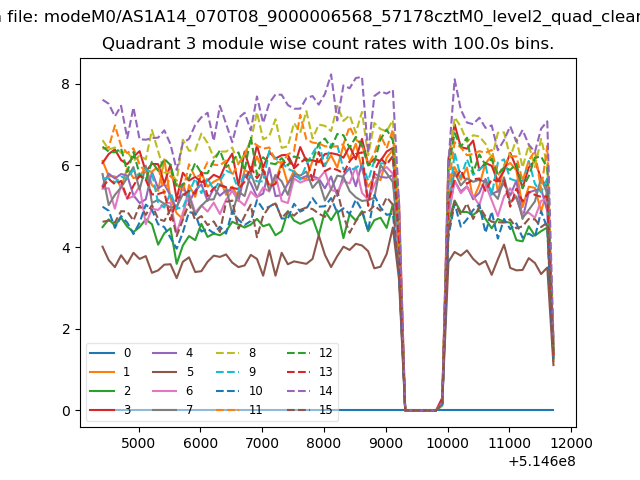
| Module-wise count rates for Quadrant A Data is divided into 100 sec bins |
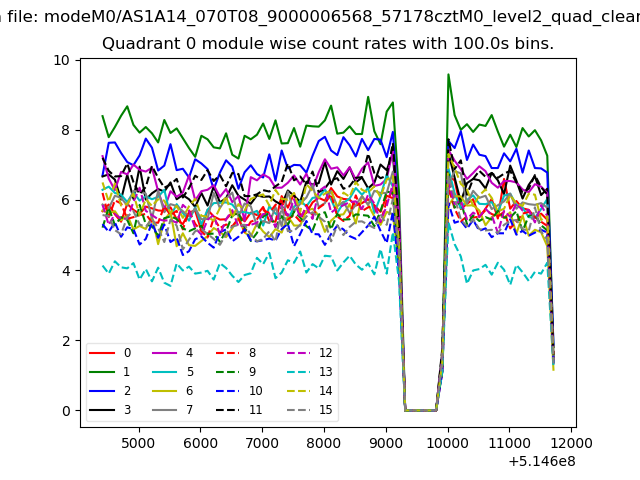 |
 |
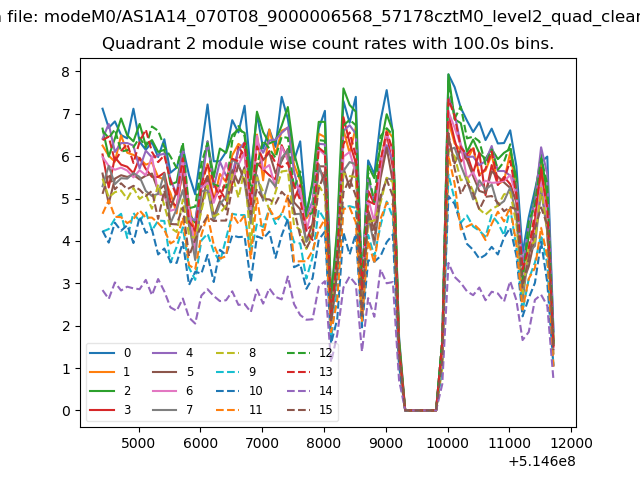
| Module-wise count rates for Quadrant B Data is divided into 100 sec bins |
 |
 |
| Module-wise count rates for Quadrant C Data is divided into 100 sec bins |
 |
 |
| Module-wise count rates for Quadrant D Data is divided into 100 sec bins |
 |
 |
| Parameter | Plot |
|---|---|
| CZT HV Monitor |  |
| D_VDD | 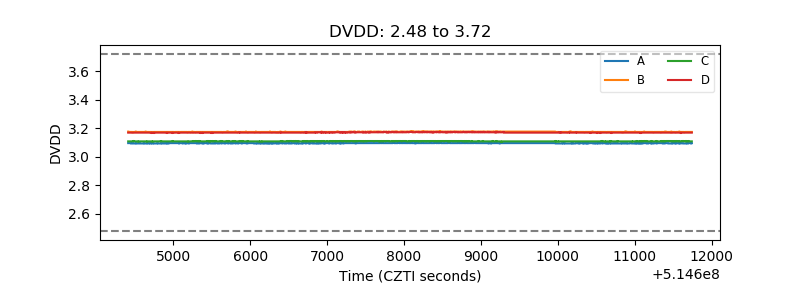 |
| Temperature 1 | 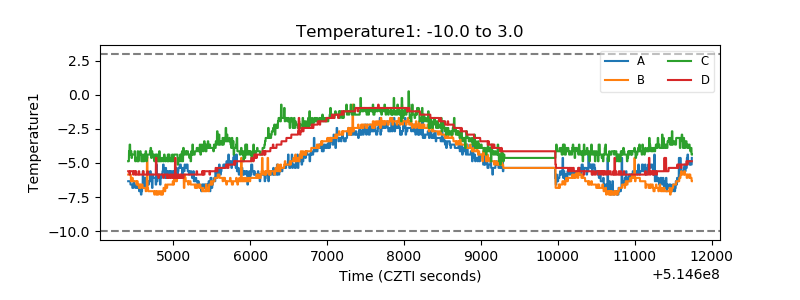 |
| Veto HV Monitor | 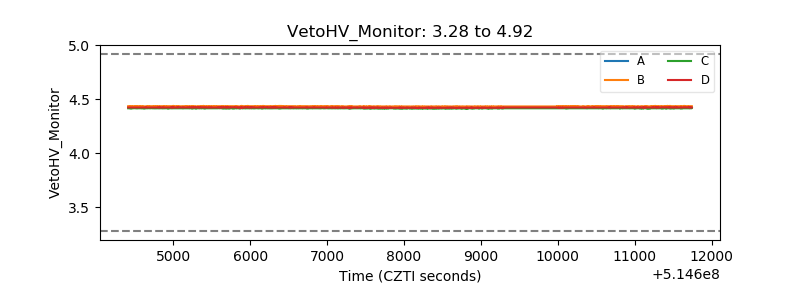 |
| Veto LLD | 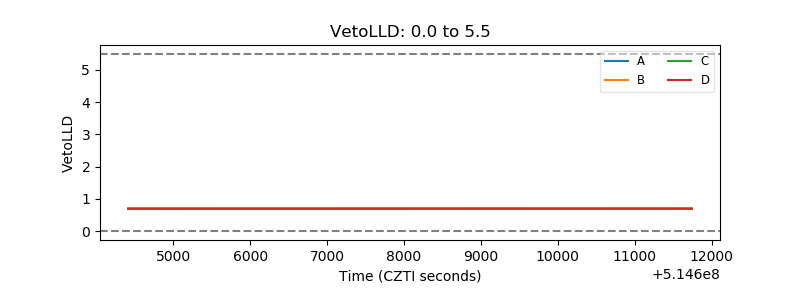 |
| Alpha Counter | 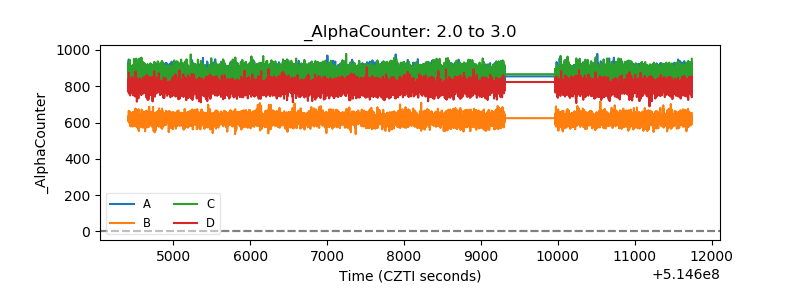 |
| _CPM_Rate | 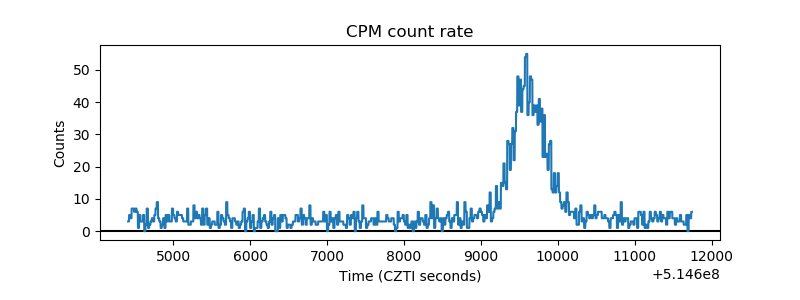 |
| CZT Counter | 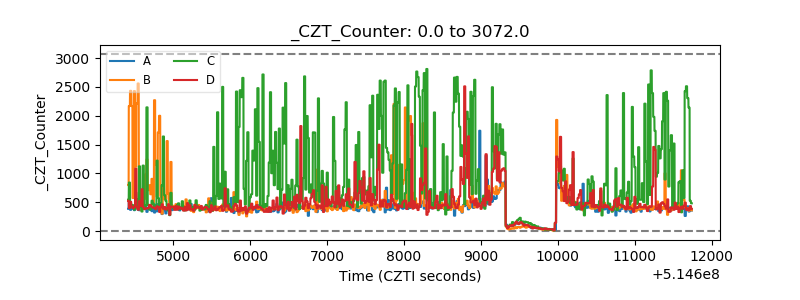 |
| +2.5 Volts monitor | 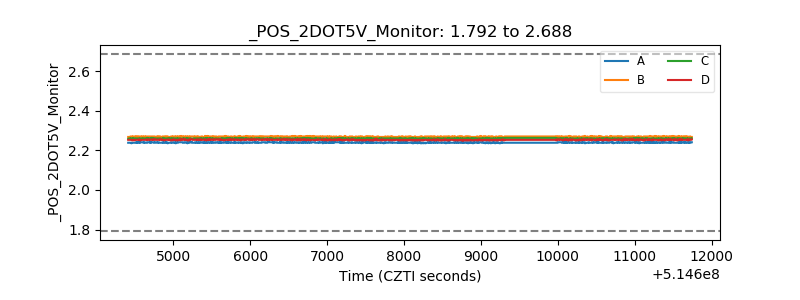 |
| +5 Volts monitor |  |
| _ROLL_ROT | 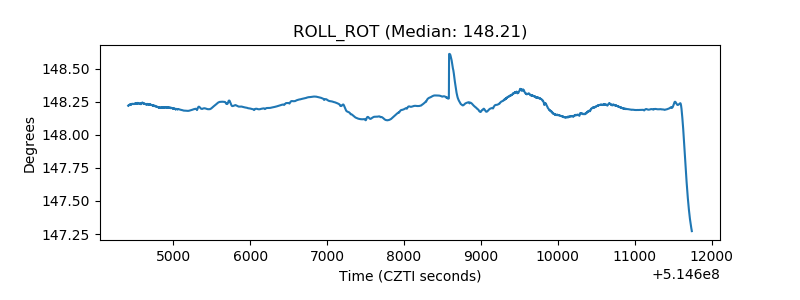 |
| _Roll_DEC | 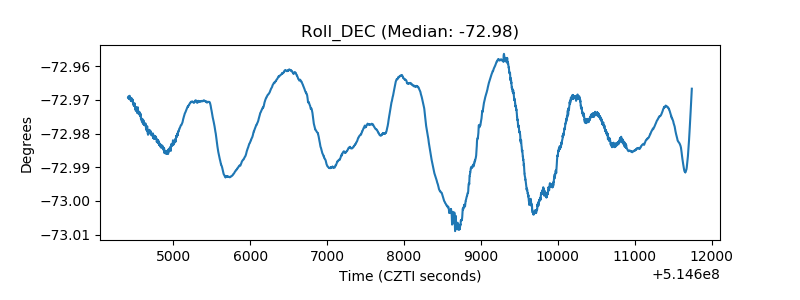 |
| _Roll_RA | 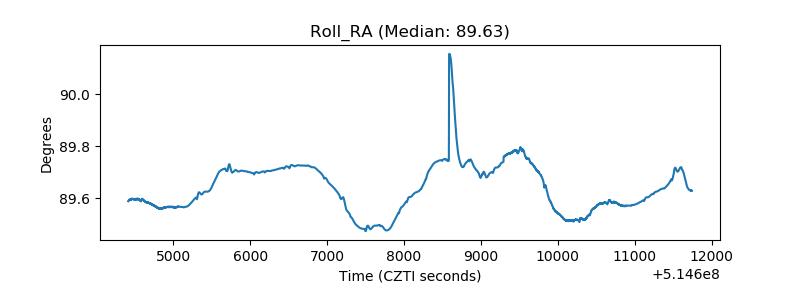 |
| Veto Counter | 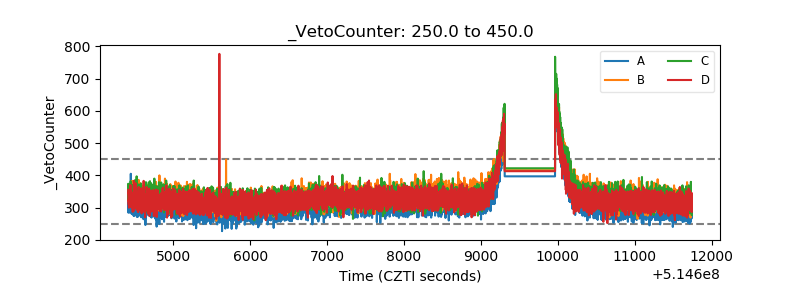 |