| Param | Original file | Final file |
|---|---|---|
| Filename | modeM0/AS1A14_070T08_9000006568_57179cztM0_level2.fits | modeM0/AS1A14_070T08_9000006568_57179cztM0_level2_quad_clean.evt |
| Size (bytes) | 486,132,480 | 101,171,520 |
| Size | 463.6 MB | 96.5 MB |
| Events in quadrant A | 3,156,814 | 675,515 |
| Events in quadrant B | 4,334,088 | 687,626 |
| Events in quadrant C | 5,784,165 | 600,058 |
| Events in quadrant D | 4,155,477 | 594,678 |
| Mode SS | |||
|---|---|---|---|
| Quadrant | BADHDUFLAG | Total packets | Discarded packets |
| A | 0 | 146 | 0 |
| B | 0 | 146 | 0 |
| C | 0 | 146 | 0 |
| D | 0 | 146 | 0 |
| Mode M0 | |||
|---|---|---|---|
| Quadrant | BADHDUFLAG | Total packets | Discarded packets |
| A | 0 | 15107 | 1 |
| B | 0 | 18099 | 1 |
| C | 0 | 22246 | 1 |
| D | 0 | 17687 | 1 |
| Quadrant | Total seconds | Saturated seconds | Saturation percentage |
|---|---|---|---|
| A | 7255 | 153 | 2.108890% |
| B | 7255 | 577 | 7.953136% |
| C | 7255 | 715 | 9.855272% |
| D | 7255 | 283 | 3.900758% |
Noise dominated data is calculated using 1-second bins in cleaned event files. If a bin has >2000 counts, and if more than 50% of those come from <1% of pixels, then it is considered to be noise-dominated and hence unusable.
| Quadrant | # 1 sec bins | Bins with >0 counts | Bins with >2000 counts | High rate bins dominated by noise | Noise dominated (total time) | Noise dominated (detector-on time) | Marked lightcurve |
|---|---|---|---|---|---|---|---|
| A | 7305 | 7256 | 8 | 8 | 0.11% | 0.11% | 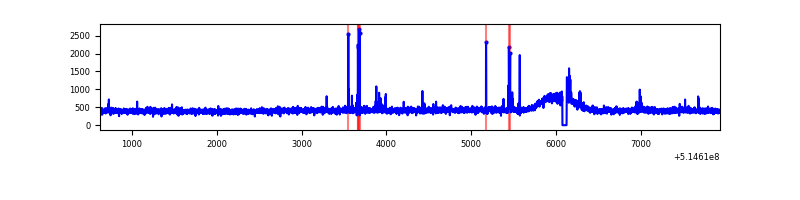 |
| B | 7305 | 7256 | 223 | 223 | 3.05% | 3.07% | 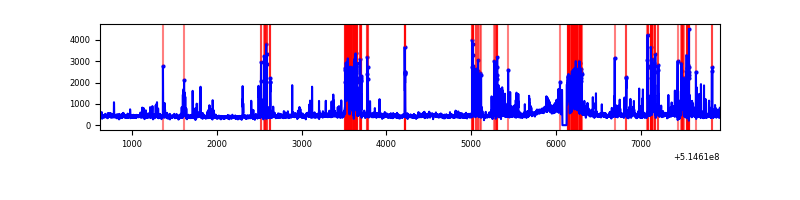 |
| C | 7305 | 7256 | 459 | 459 | 6.28% | 6.33% | 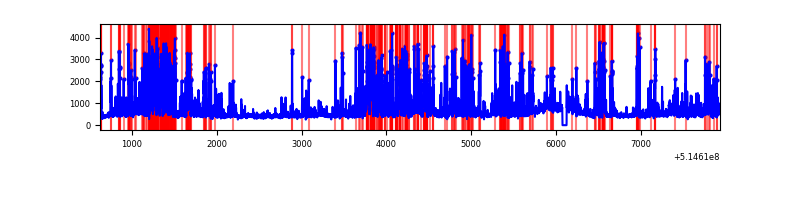 |
| D | 7305 | 7256 | 152 | 152 | 2.08% | 2.09% | 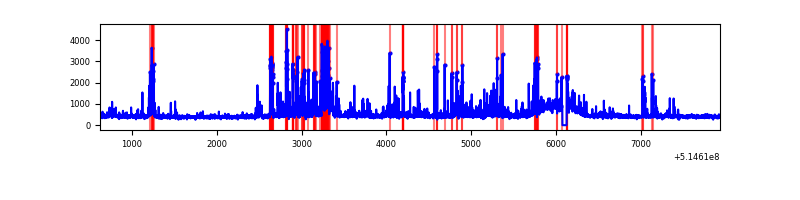 |
Top three noisy pixels from each quadrant. If the there are fewer than three noisy pixels in the level2.evt file, extra rows are filled as -1
| Pixel properties | Quadrant properties | ||||||
|---|---|---|---|---|---|---|---|
| Quadrant | DetID | PixID | Counts | Sigma | Mean | Median | Sigma |
| A | 3 | 14 | 39944 | 201.01 | 783 | 762 | 194.9 |
| A | 13 | 248 | 27400 | 136.66 | 783 | 762 | 194.9 |
| A | 4 | 3 | 21339 | 105.56 | 783 | 762 | 194.9 |
| B | 5 | 185 | 482069 | 2988.06 | 754 | 724 | 161.1 |
| B | 2 | 249 | 330894 | 2049.6 | 754 | 724 | 161.1 |
| B | 10 | 16 | 223363 | 1382.08 | 754 | 724 | 161.1 |
| C | 15 | 224 | 2501120 | 12438.89 | 743 | 734 | 201.0 |
| C | 14 | 67 | 151278 | 748.92 | 743 | 734 | 201.0 |
| C | 13 | 3 | 103563 | 511.55 | 743 | 734 | 201.0 |
| D | 12 | 33 | 481139 | 2284.36 | 754 | 720 | 210.3 |
| D | 2 | 249 | 213872 | 1013.52 | 754 | 720 | 210.3 |
| D | 8 | 240 | 123216 | 582.46 | 754 | 720 | 210.3 |
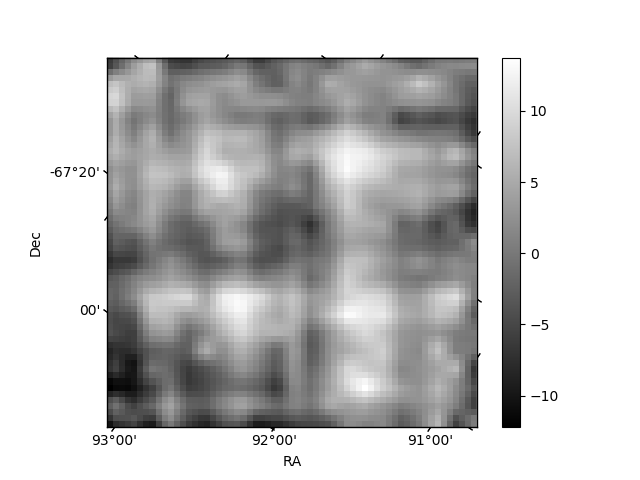
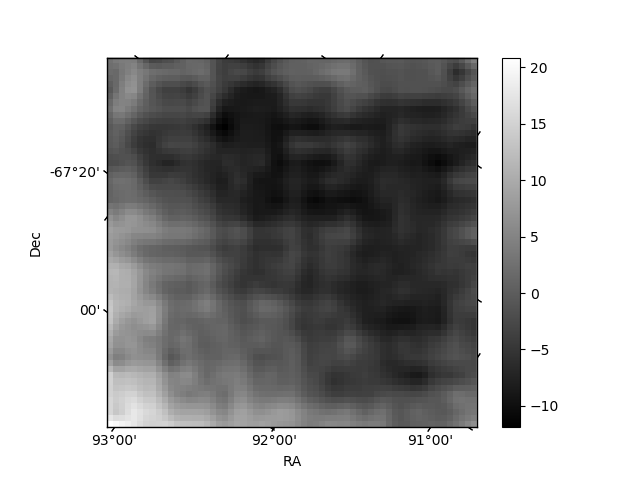
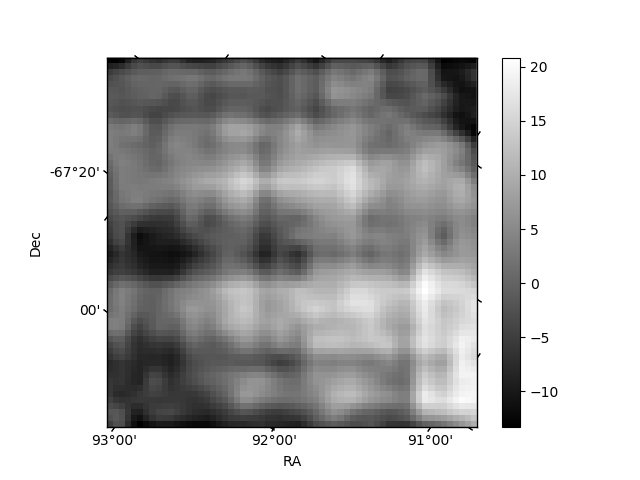
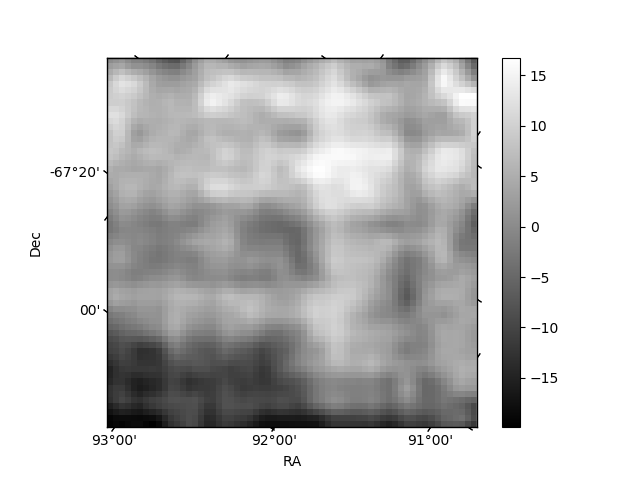
Histogram calculated using DETX and DETY for each event in the final _common_clean file
| Quadrant A | 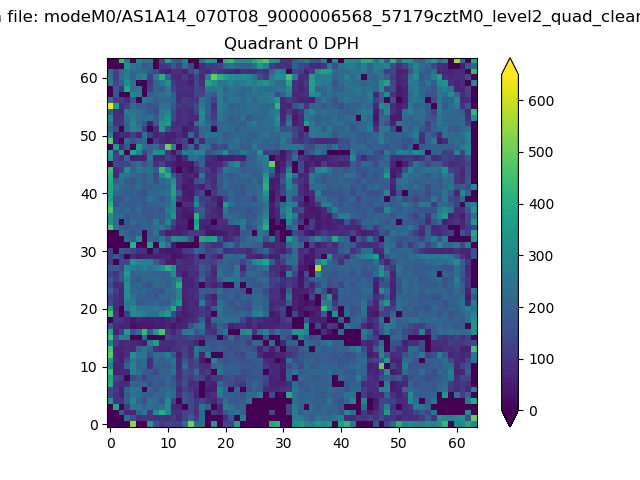 |
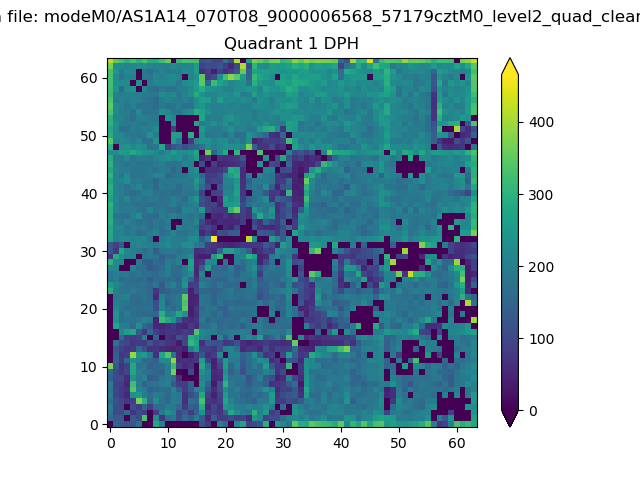 |
Quadrant B |
|---|---|---|---|
| Quadrant D | 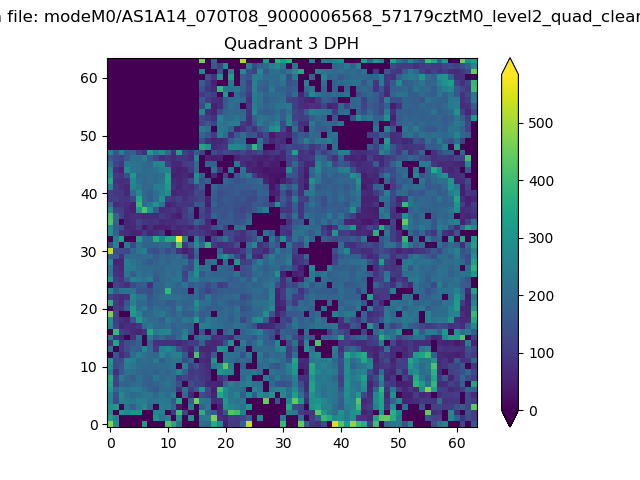 |
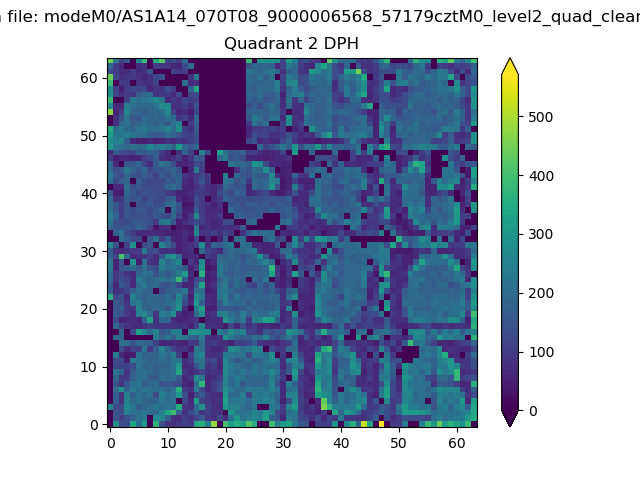 |
Quadrant C |
| Plot type | Count rate plots | Images |
|---|---|---|
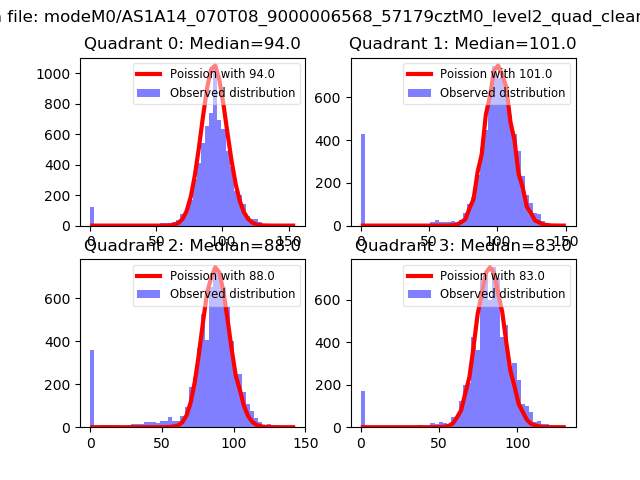
| Comparison with Poisson distribution Blue bars denote a histogram of data divided into 1 sec bins. Red curve is a Poisson curve with rate = median count rate of data. |
 |
 |
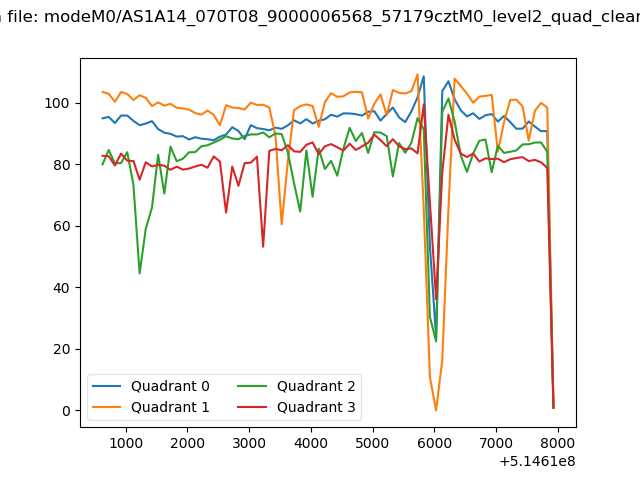
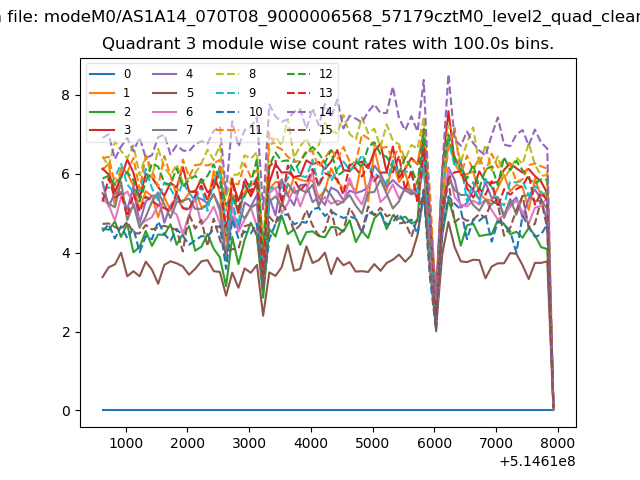
| Quadrant-wise count rates Data is divided into 100 sec bins |
 |
|
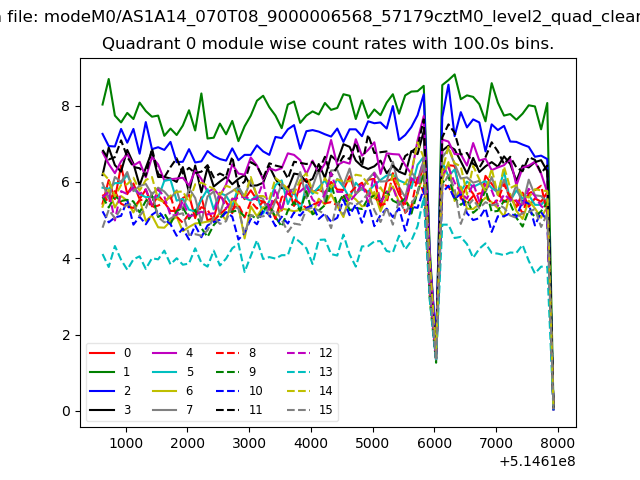
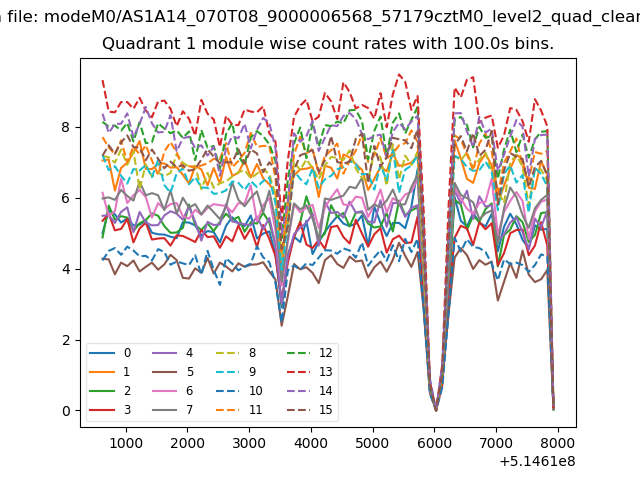
| Module-wise count rates for Quadrant A Data is divided into 100 sec bins |
 |
 |
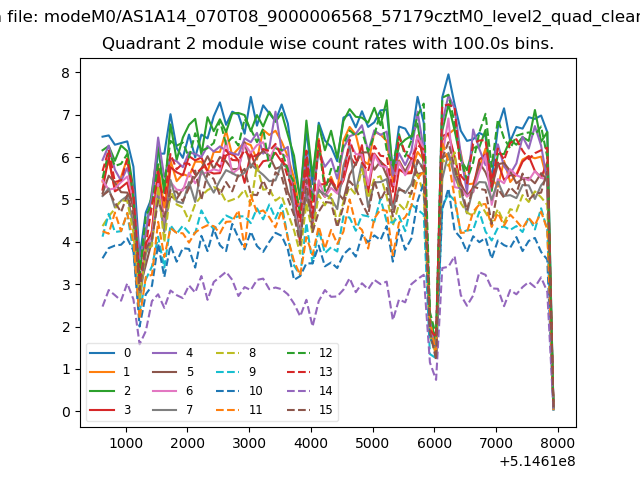
| Module-wise count rates for Quadrant B Data is divided into 100 sec bins |
 |
 |
| Module-wise count rates for Quadrant C Data is divided into 100 sec bins |
 |
 |
| Module-wise count rates for Quadrant D Data is divided into 100 sec bins |
 |
 |
| Parameter | Plot |
|---|---|
| CZT HV Monitor | 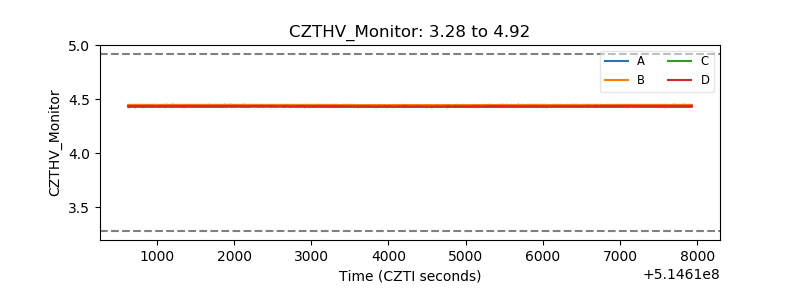 |
| D_VDD | 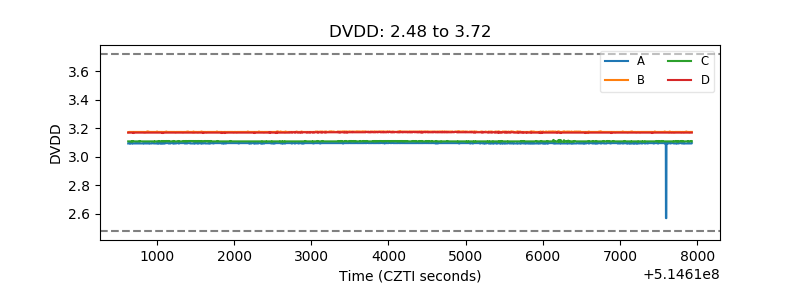 |
| Temperature 1 | 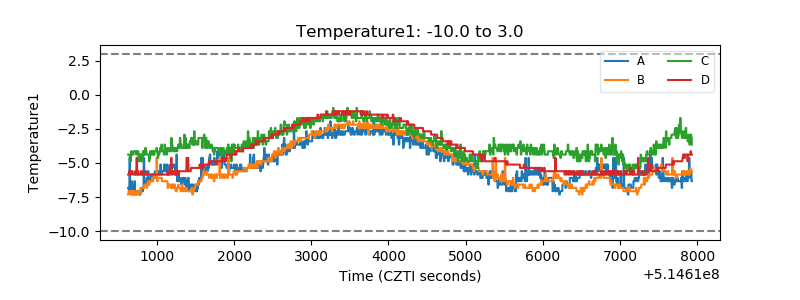 |
| Veto HV Monitor | 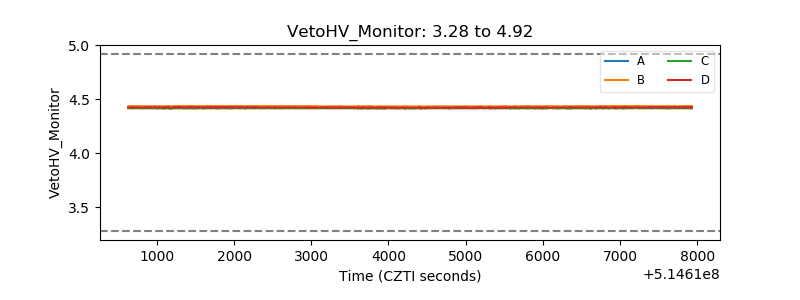 |
| Veto LLD | 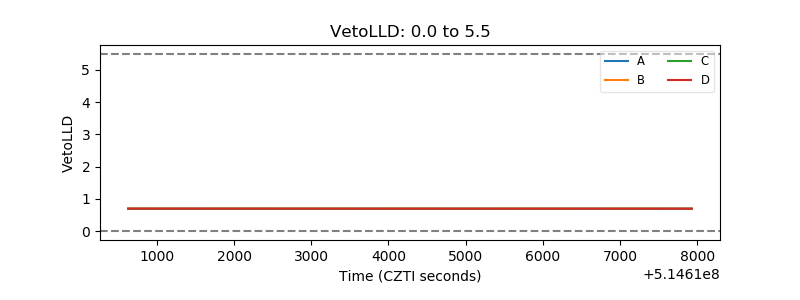 |
| Alpha Counter | 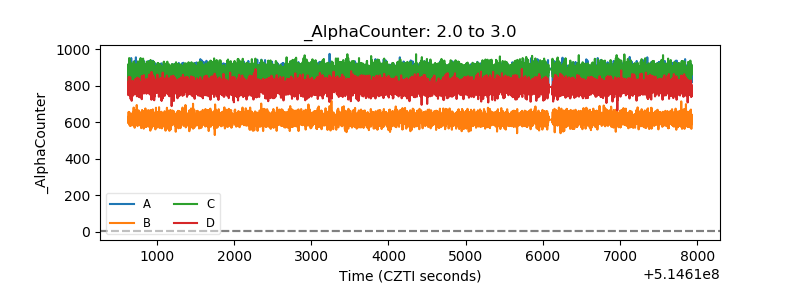 |
| _CPM_Rate | 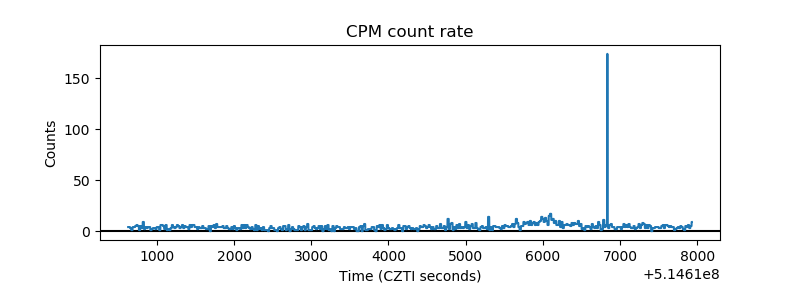 |
| CZT Counter | 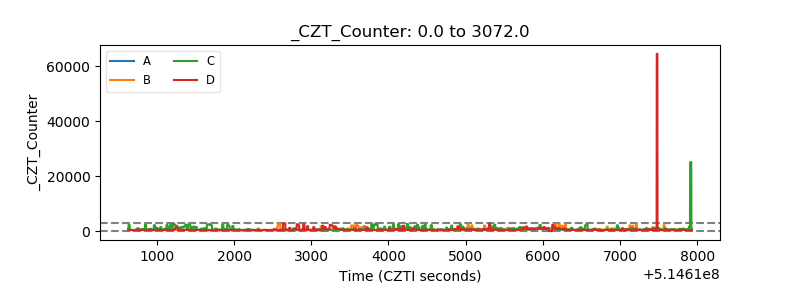 |
| +2.5 Volts monitor |  |
| +5 Volts monitor |  |
| _ROLL_ROT | 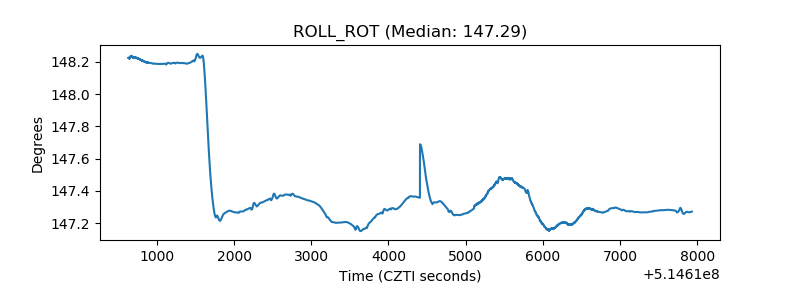 |
| _Roll_DEC | 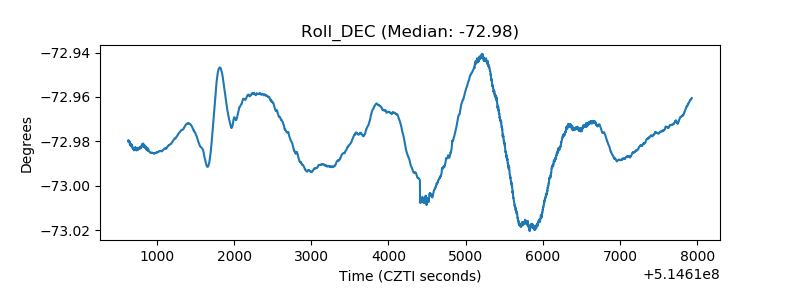 |
| _Roll_RA | 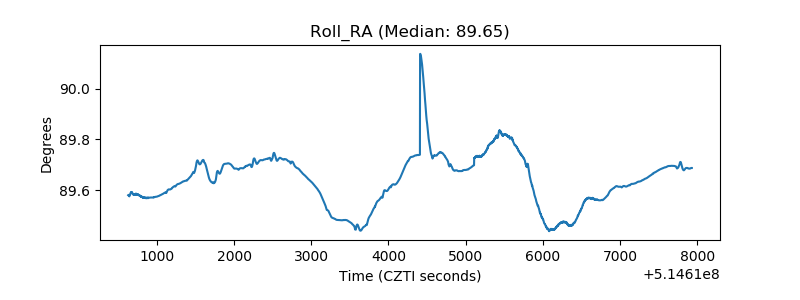 |
| Veto Counter | 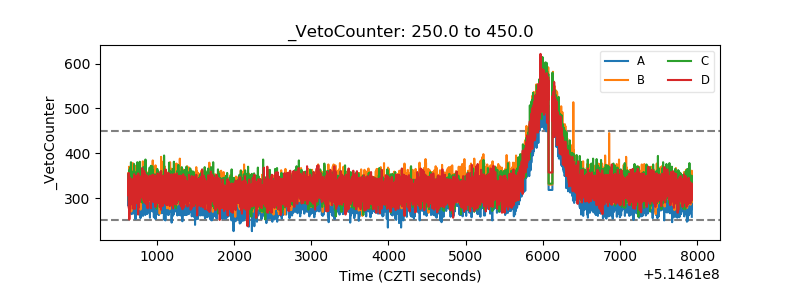 |