| Param | Original file | Final file |
|---|---|---|
| Filename | modeM0/AS1A14_070T08_9000006568_57180cztM0_level2.fits | modeM0/AS1A14_070T08_9000006568_57180cztM0_level2_quad_clean.evt |
| Size (bytes) | 503,305,920 | 107,795,520 |
| Size | 480.0 MB | 102.8 MB |
| Events in quadrant A | 3,272,827 | 712,910 |
| Events in quadrant B | 4,028,054 | 762,252 |
| Events in quadrant C | 5,734,057 | 642,423 |
| Events in quadrant D | 5,006,285 | 618,265 |
| Mode SS | |||
|---|---|---|---|
| Quadrant | BADHDUFLAG | Total packets | Discarded packets |
| A | 0 | 152 | 0 |
| B | 0 | 152 | 0 |
| C | 0 | 152 | 0 |
| D | 0 | 152 | 0 |
| Mode M0 | |||
|---|---|---|---|
| Quadrant | BADHDUFLAG | Total packets | Discarded packets |
| A | 0 | 15579 | 0 |
| B | 0 | 17414 | 0 |
| C | 0 | 22230 | 0 |
| D | 0 | 20341 | 0 |
| Quadrant | Total seconds | Saturated seconds | Saturation percentage |
|---|---|---|---|
| A | 7588 | 9 | 0.118608% |
| B | 7588 | 154 | 2.029520% |
| C | 7588 | 509 | 6.707960% |
| D | 7588 | 286 | 3.769109% |
Noise dominated data is calculated using 1-second bins in cleaned event files. If a bin has >2000 counts, and if more than 50% of those come from <1% of pixels, then it is considered to be noise-dominated and hence unusable.
| Quadrant | # 1 sec bins | Bins with >0 counts | Bins with >2000 counts | High rate bins dominated by noise | Noise dominated (total time) | Noise dominated (detector-on time) | Marked lightcurve |
|---|---|---|---|---|---|---|---|
| A | 7588 | 7588 | 4 | 4 | 0.05% | 0.05% | 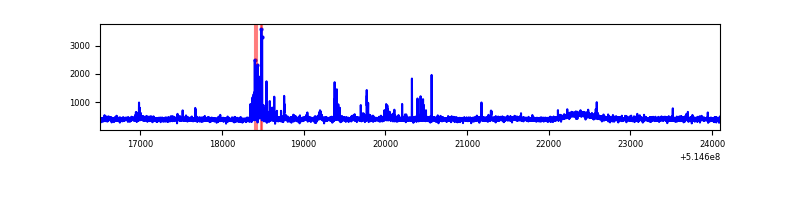 |
| B | 7588 | 7588 | 86 | 86 | 1.13% | 1.13% | 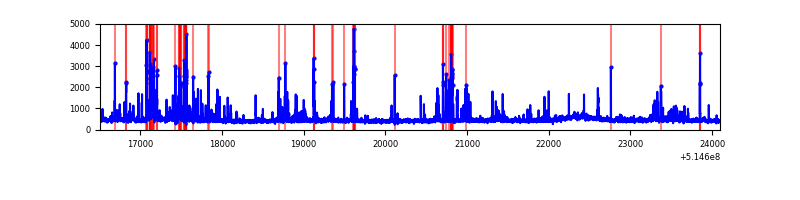 |
| C | 7588 | 7588 | 409 | 409 | 5.39% | 5.39% | 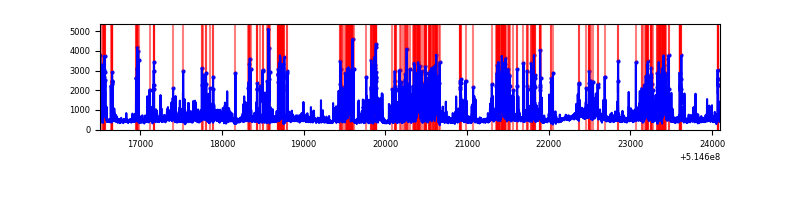 |
| D | 7588 | 7588 | 268 | 268 | 3.53% | 3.53% | 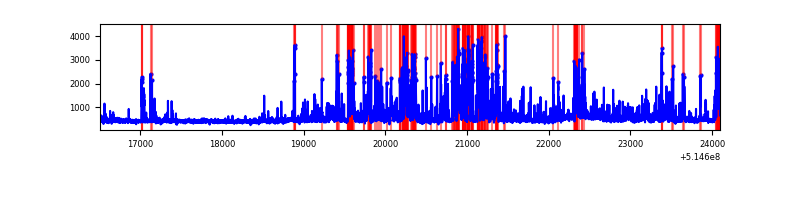 |
Top three noisy pixels from each quadrant. If the there are fewer than three noisy pixels in the level2.evt file, extra rows are filled as -1
| Pixel properties | Quadrant properties | ||||||
|---|---|---|---|---|---|---|---|
| Quadrant | DetID | PixID | Counts | Sigma | Mean | Median | Sigma |
| A | 3 | 95 | 139701 | 705.64 | 797 | 779 | 196.9 |
| A | 3 | 14 | 22873 | 112.22 | 797 | 779 | 196.9 |
| A | 10 | 251 | 14428 | 69.33 | 797 | 779 | 196.9 |
| B | 5 | 185 | 317961 | 1870.57 | 789 | 755 | 169.6 |
| B | 2 | 249 | 175747 | 1031.93 | 789 | 755 | 169.6 |
| B | 0 | 245 | 62962 | 366.83 | 789 | 755 | 169.6 |
| C | 15 | 224 | 2318671 | 11177.57 | 760 | 749 | 207.4 |
| C | 1 | 16 | 131773 | 631.83 | 760 | 749 | 207.4 |
| C | 14 | 246 | 67652 | 322.62 | 760 | 749 | 207.4 |
| D | 12 | 33 | 1215006 | 5637.98 | 763 | 727 | 215.4 |
| D | 8 | 240 | 427357 | 1980.87 | 763 | 727 | 215.4 |
| D | 2 | 249 | 215967 | 999.37 | 763 | 727 | 215.4 |
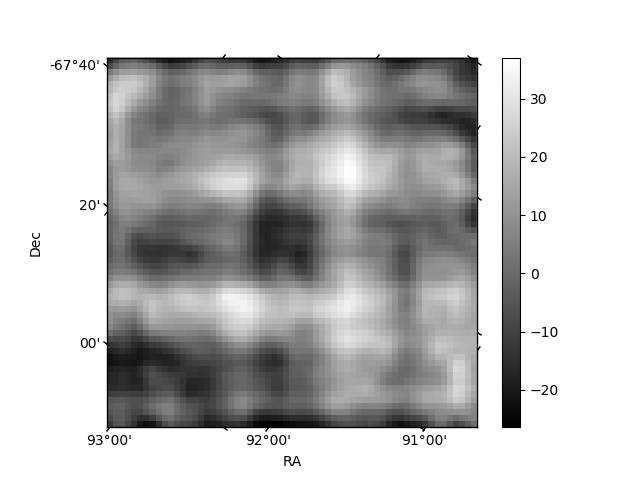
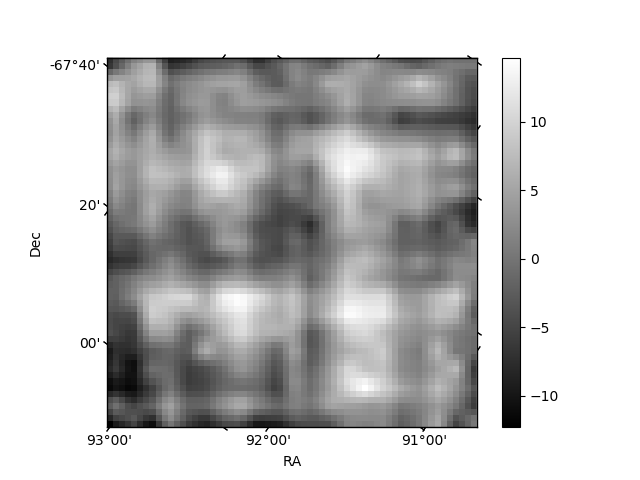
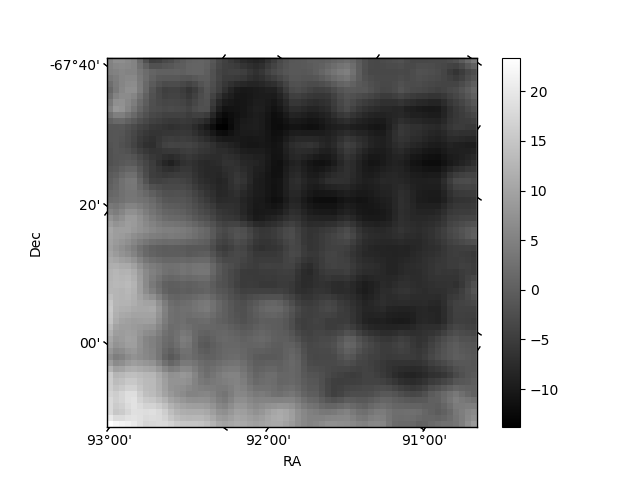
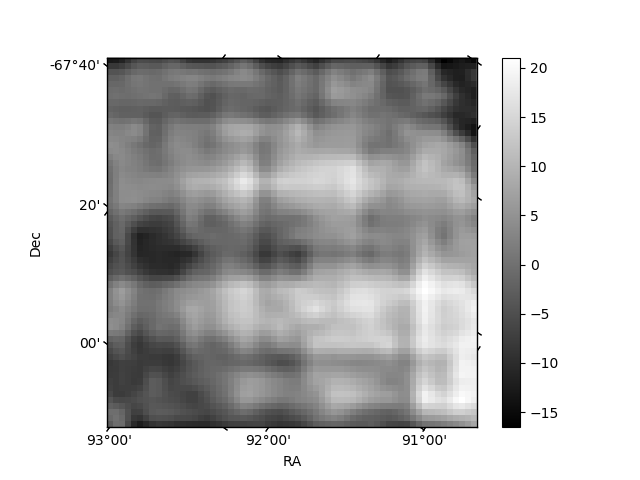
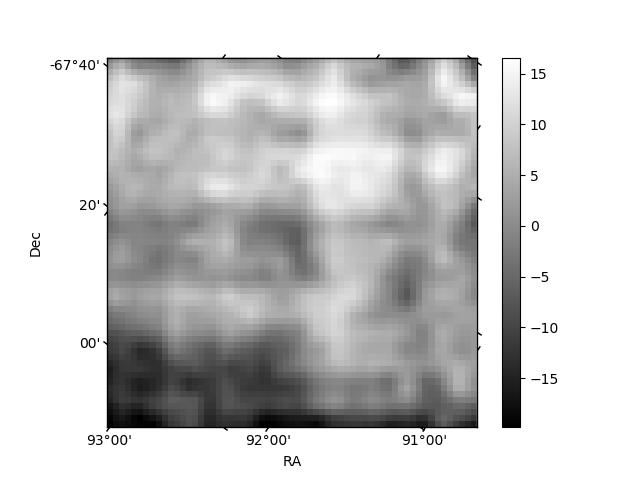
Histogram calculated using DETX and DETY for each event in the final _common_clean file
| Quadrant A | 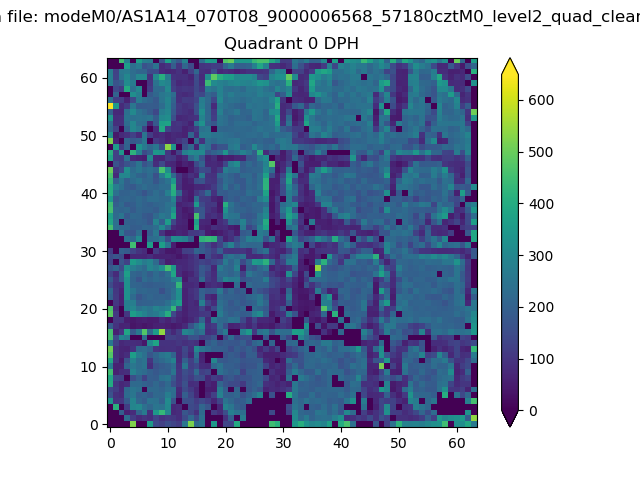 |
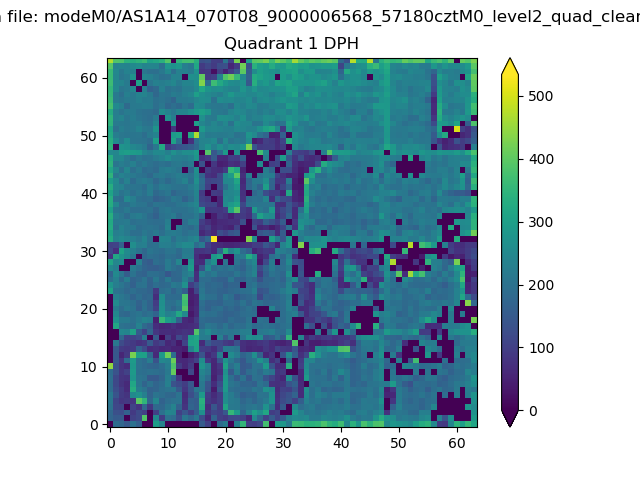 |
Quadrant B |
|---|---|---|---|
| Quadrant D | 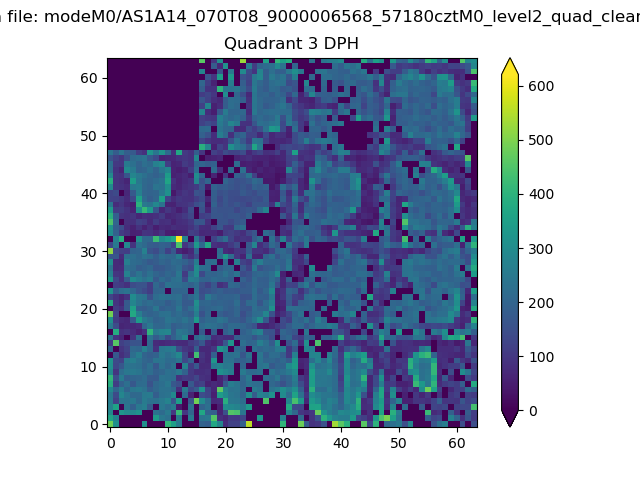 |
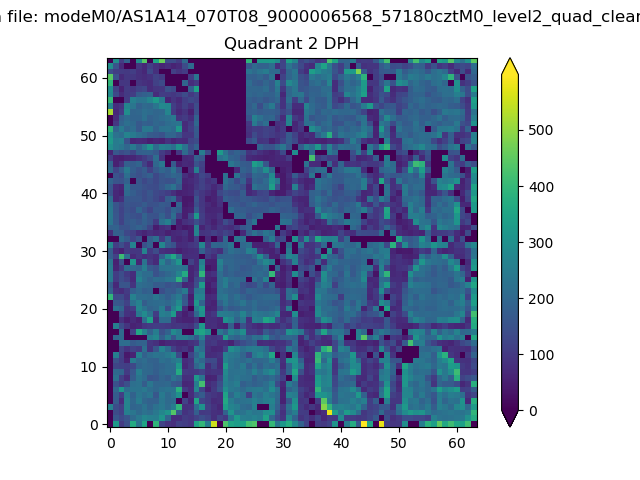 |
Quadrant C |
| Plot type | Count rate plots | Images |
|---|---|---|
| Comparison with Poisson distribution Blue bars denote a histogram of data divided into 1 sec bins. Red curve is a Poisson curve with rate = median count rate of data. |
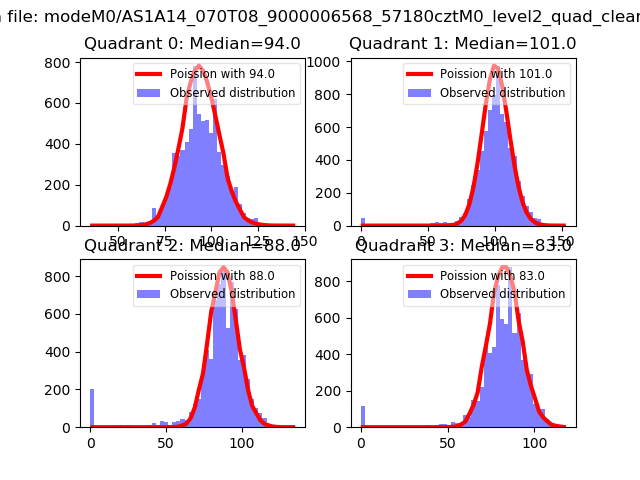 |
 |
| Quadrant-wise count rates Data is divided into 100 sec bins |
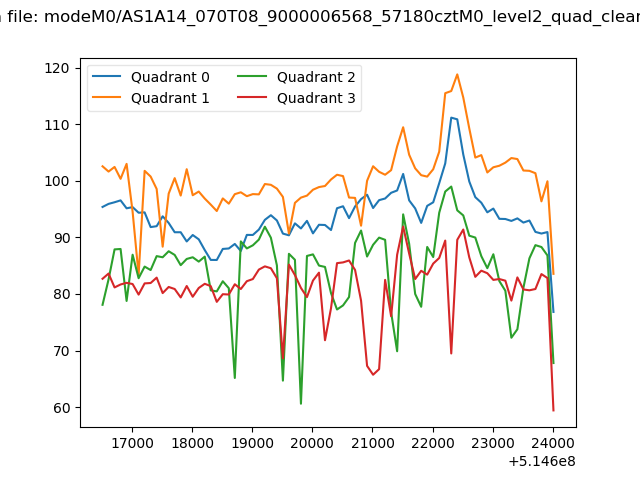 |
|
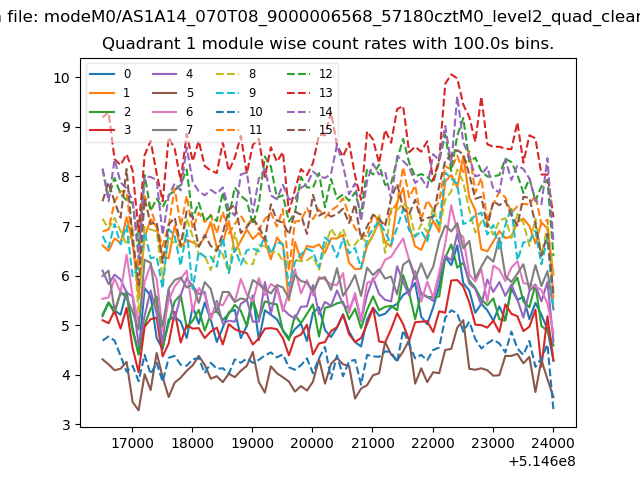
| Module-wise count rates for Quadrant A Data is divided into 100 sec bins |
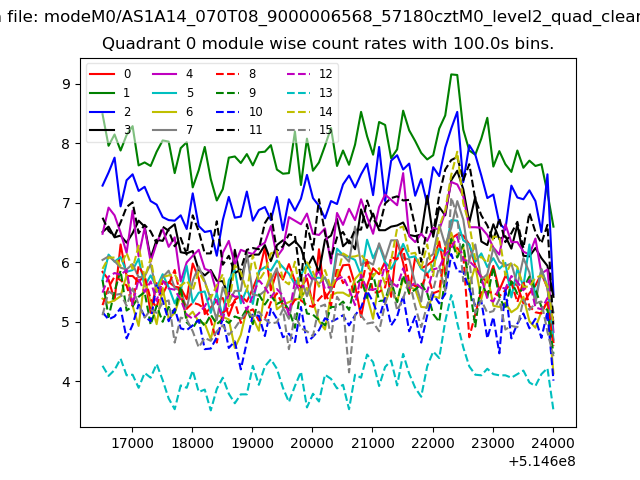 |
 |
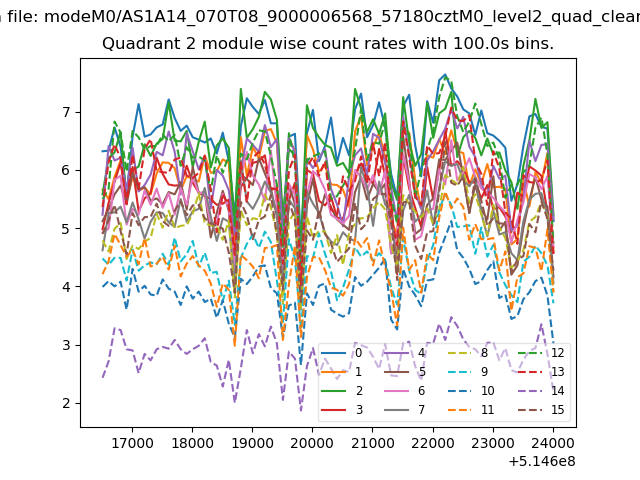
| Module-wise count rates for Quadrant B Data is divided into 100 sec bins |
 |
 |
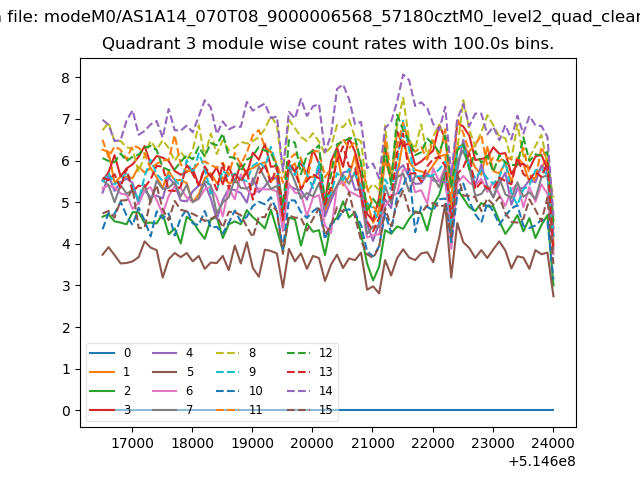
| Module-wise count rates for Quadrant C Data is divided into 100 sec bins |
 |
 |
| Module-wise count rates for Quadrant D Data is divided into 100 sec bins |
 |
 |
| Parameter | Plot |
|---|---|
| CZT HV Monitor |  |
| D_VDD | 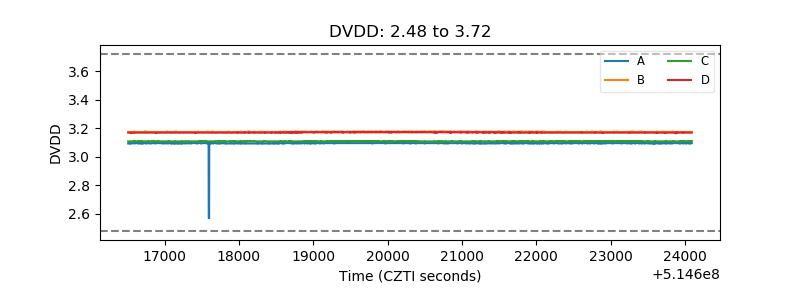 |
| Temperature 1 | 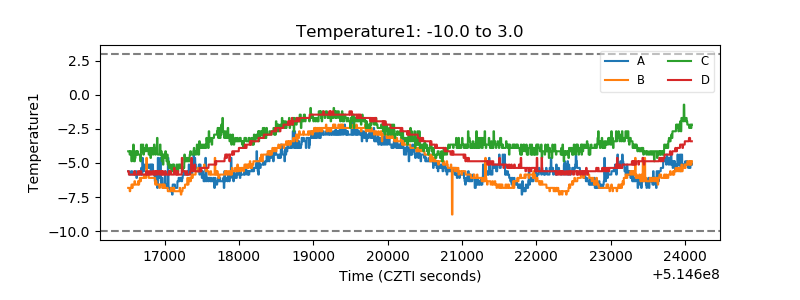 |
| Veto HV Monitor | 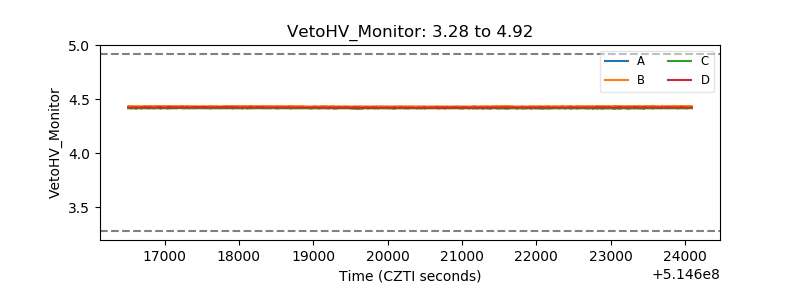 |
| Veto LLD | 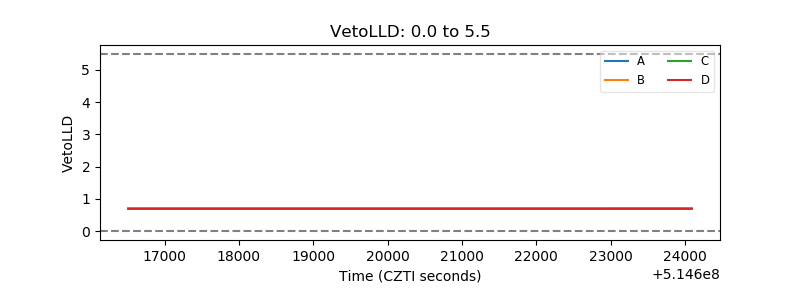 |
| Alpha Counter | 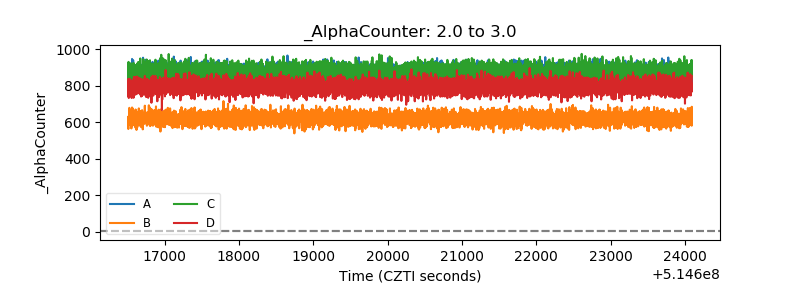 |
| _CPM_Rate | 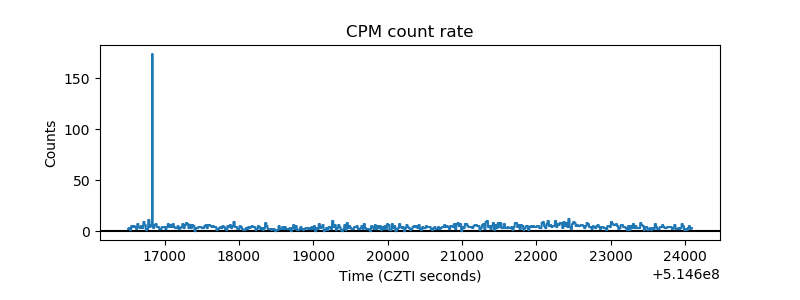 |
| CZT Counter | 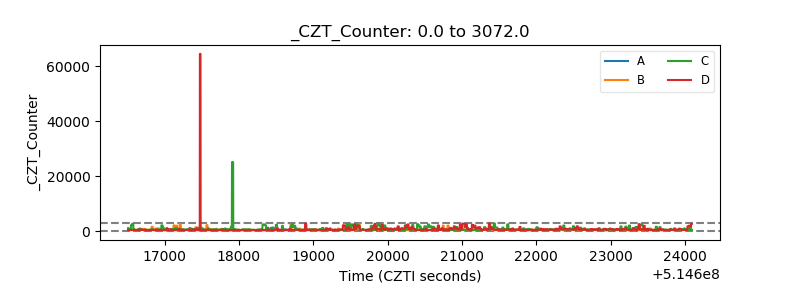 |
| +2.5 Volts monitor |  |
| +5 Volts monitor |  |
| _ROLL_ROT | 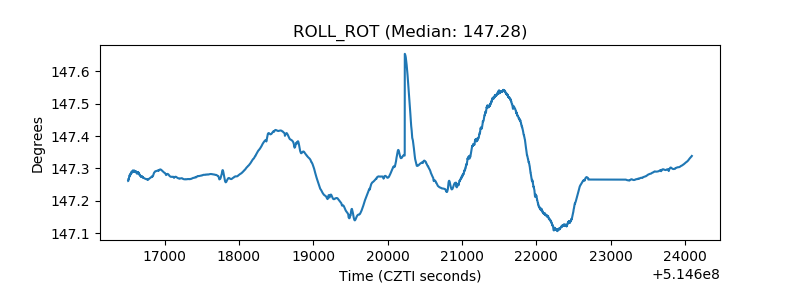 |
| _Roll_DEC | 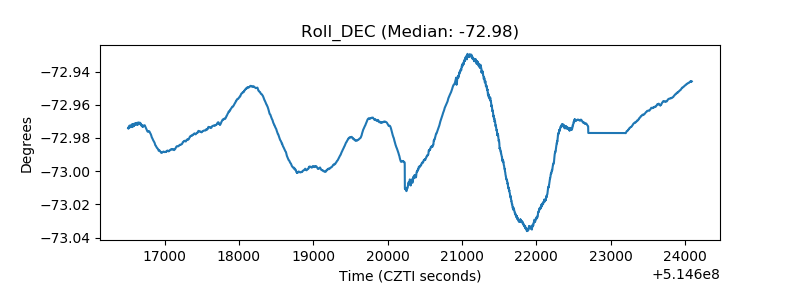 |
| _Roll_RA | 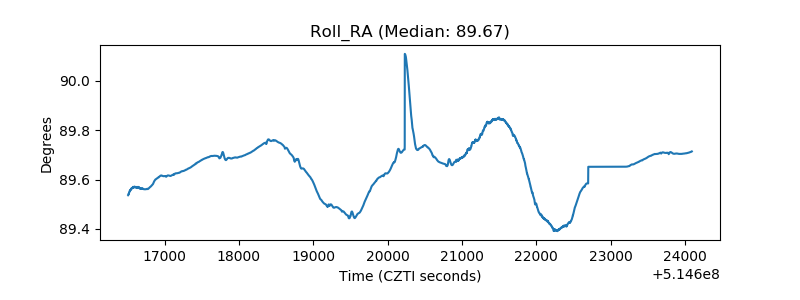 |
| Veto Counter | 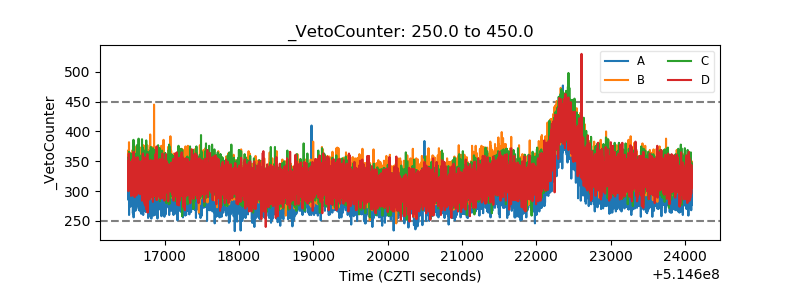 |