| Param | Original file | Final file |
|---|---|---|
| Filename | modeM0/AS1A14_070T08_9000006568_57181cztM0_level2.fits | modeM0/AS1A14_070T08_9000006568_57181cztM0_level2_quad_clean.evt |
| Size (bytes) | 599,788,800 | 99,115,200 |
| Size | 572.0 MB | 94.5 MB |
| Events in quadrant A | 3,067,100 | 682,981 |
| Events in quadrant B | 3,500,419 | 736,093 |
| Events in quadrant C | 7,041,480 | 565,828 |
| Events in quadrant D | 8,029,145 | 510,174 |
| Mode SS | |||
|---|---|---|---|
| Quadrant | BADHDUFLAG | Total packets | Discarded packets |
| A | 0 | 146 | 0 |
| B | 0 | 146 | 0 |
| C | 0 | 146 | 0 |
| D | 0 | 146 | 0 |
| Mode M0 | |||
|---|---|---|---|
| Quadrant | BADHDUFLAG | Total packets | Discarded packets |
| A | 0 | 14790 | 0 |
| B | 0 | 15699 | 0 |
| C | 0 | 26100 | 0 |
| D | 0 | 28830 | 0 |
| Quadrant | Total seconds | Saturated seconds | Saturation percentage |
|---|---|---|---|
| A | 7263 | 19 | 0.261600% |
| B | 7263 | 102 | 1.404378% |
| C | 7263 | 1197 | 16.480793% |
| D | 7263 | 1380 | 19.000413% |
Noise dominated data is calculated using 1-second bins in cleaned event files. If a bin has >2000 counts, and if more than 50% of those come from <1% of pixels, then it is considered to be noise-dominated and hence unusable.
| Quadrant | # 1 sec bins | Bins with >0 counts | Bins with >2000 counts | High rate bins dominated by noise | Noise dominated (total time) | Noise dominated (detector-on time) | Marked lightcurve |
|---|---|---|---|---|---|---|---|
| A | 7263 | 7263 | 4 | 4 | 0.06% | 0.06% | 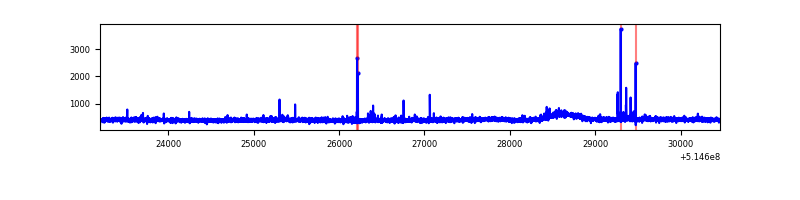 |
| B | 7263 | 7263 | 36 | 36 | 0.50% | 0.50% | 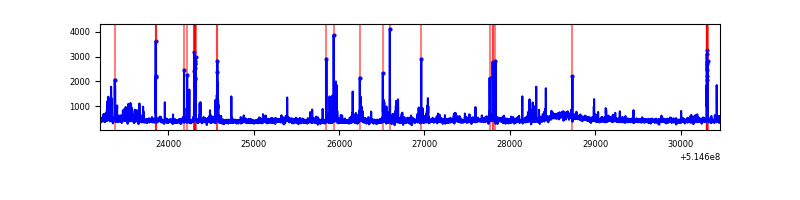 |
| C | 7263 | 7263 | 938 | 938 | 12.91% | 12.91% | 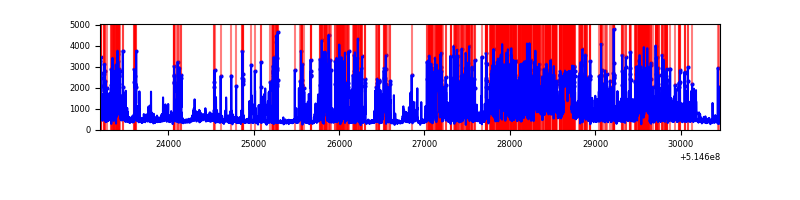 |
| D | 7263 | 7263 | 1310 | 1310 | 18.04% | 18.04% | 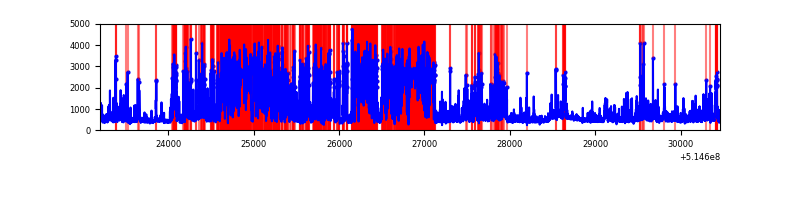 |
Top three noisy pixels from each quadrant. If the there are fewer than three noisy pixels in the level2.evt file, extra rows are filled as -1
| Pixel properties | Quadrant properties | ||||||
|---|---|---|---|---|---|---|---|
| Quadrant | DetID | PixID | Counts | Sigma | Mean | Median | Sigma |
| A | 3 | 62 | 26518 | 133.62 | 772 | 752 | 192.8 |
| A | 10 | 251 | 23410 | 117.5 | 772 | 752 | 192.8 |
| A | 3 | 14 | 17763 | 88.22 | 772 | 752 | 192.8 |
| B | 5 | 185 | 129700 | 798.89 | 763 | 734 | 161.4 |
| B | 2 | 249 | 86668 | 532.32 | 763 | 734 | 161.4 |
| B | 0 | 213 | 72976 | 447.51 | 763 | 734 | 161.4 |
| C | 15 | 224 | 4158984 | 21781.05 | 698 | 690 | 190.9 |
| C | 14 | 246 | 58521 | 302.92 | 698 | 690 | 190.9 |
| C | 14 | 254 | 27505 | 140.46 | 698 | 690 | 190.9 |
| D | 12 | 33 | 4034031 | 20703.73 | 686 | 651 | 194.8 |
| D | 2 | 249 | 857817 | 4399.92 | 686 | 651 | 194.8 |
| D | 8 | 240 | 312568 | 1601.1 | 686 | 651 | 194.8 |
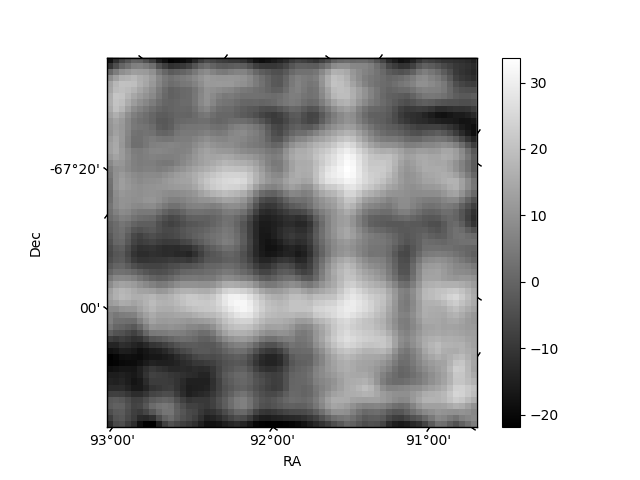
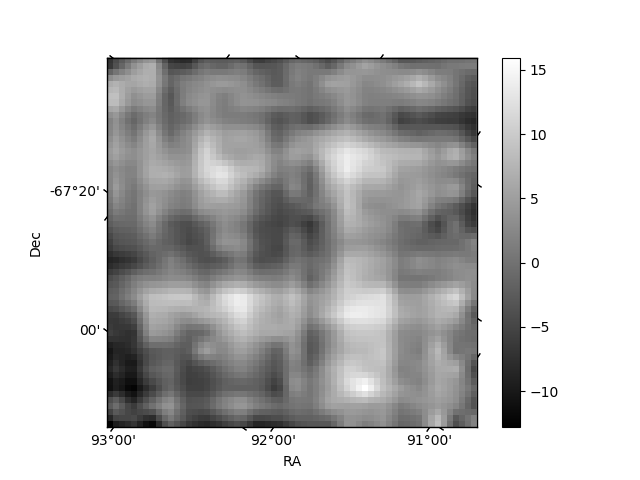
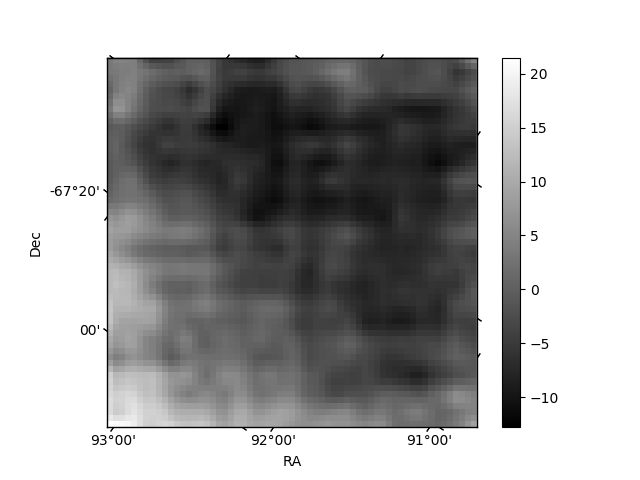
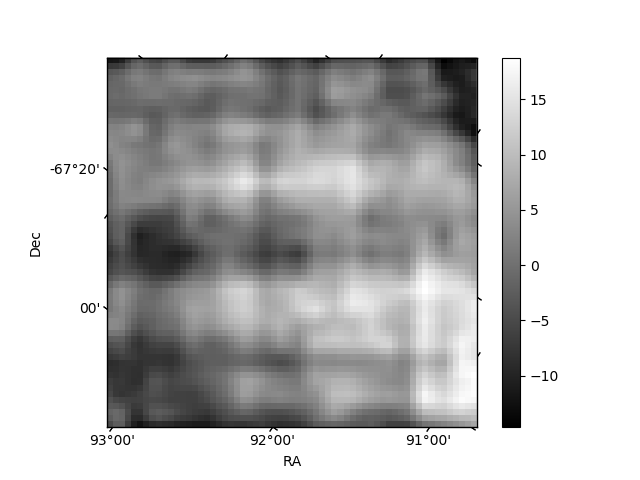
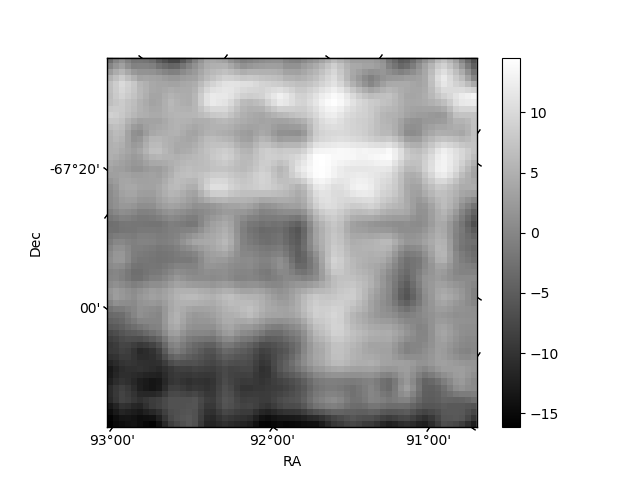
Histogram calculated using DETX and DETY for each event in the final _common_clean file
| Quadrant A | 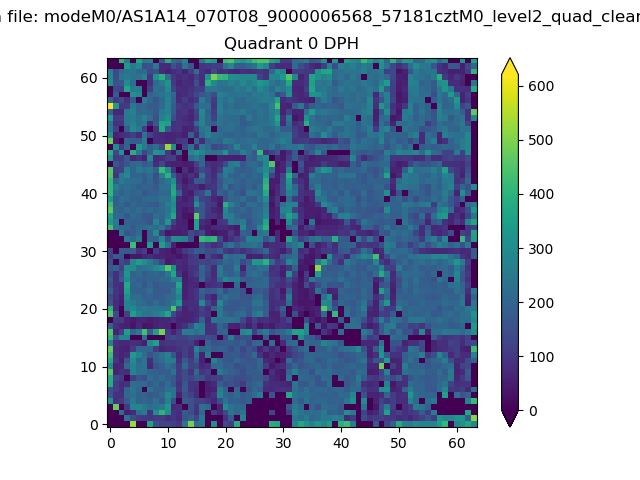 |
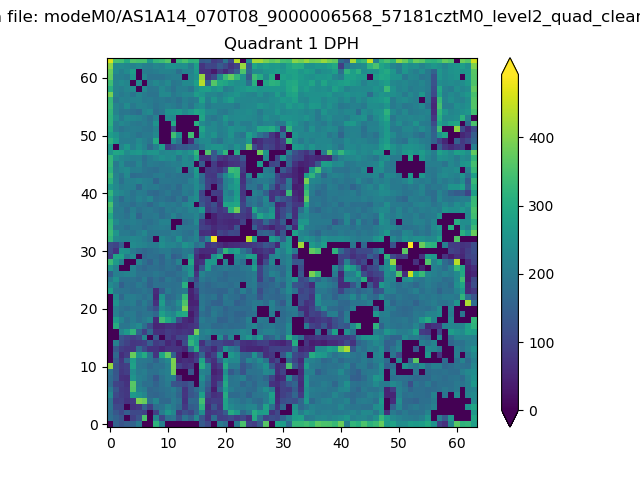 |
Quadrant B |
|---|---|---|---|
| Quadrant D | 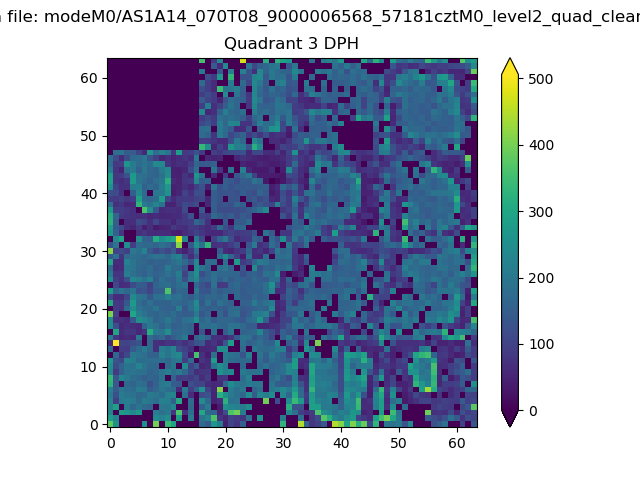 |
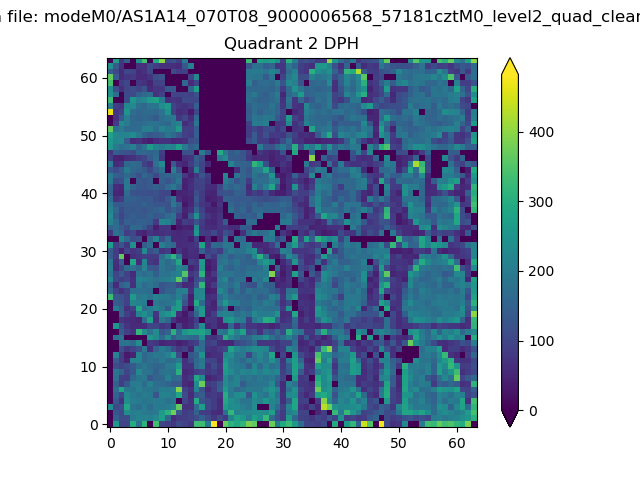 |
Quadrant C |
| Plot type | Count rate plots | Images |
|---|---|---|
| Comparison with Poisson distribution Blue bars denote a histogram of data divided into 1 sec bins. Red curve is a Poisson curve with rate = median count rate of data. |
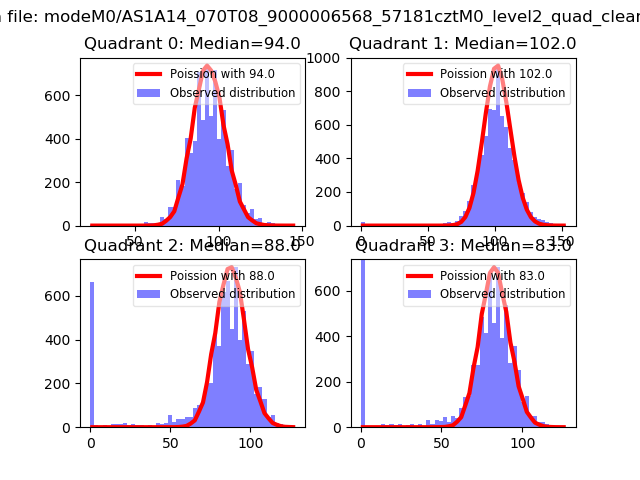 |
 |
| Quadrant-wise count rates Data is divided into 100 sec bins |
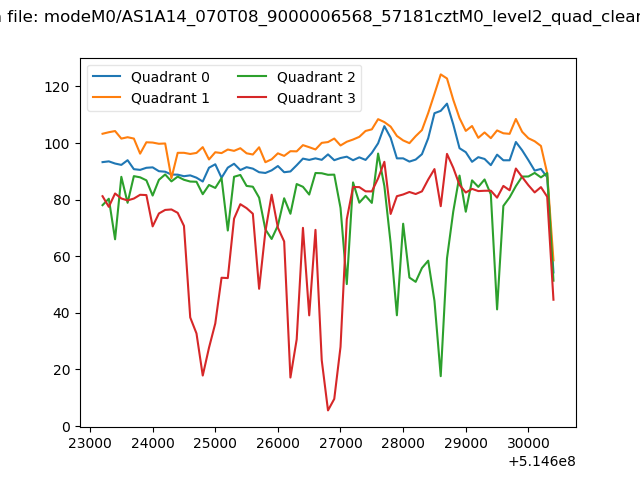 |
|
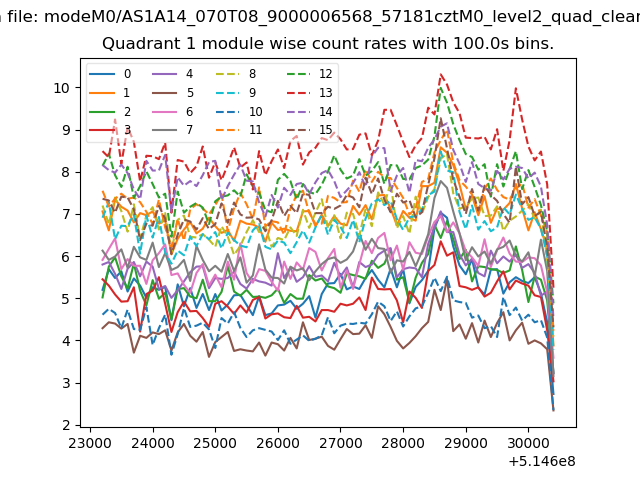
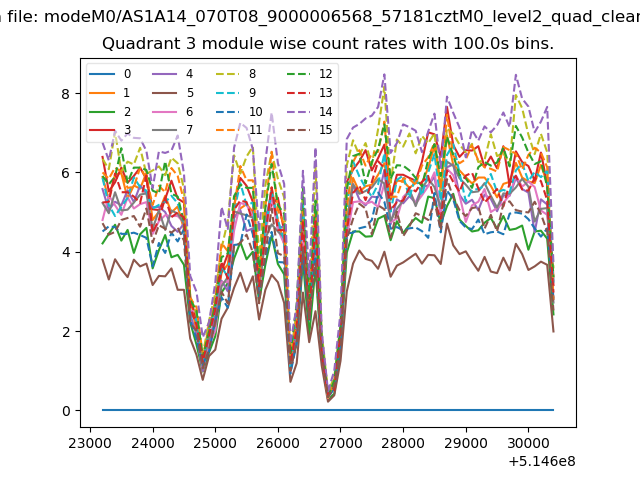
| Module-wise count rates for Quadrant A Data is divided into 100 sec bins |
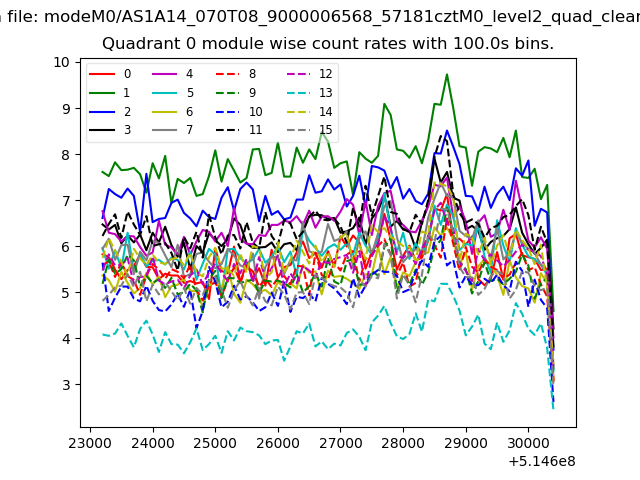 |
 |
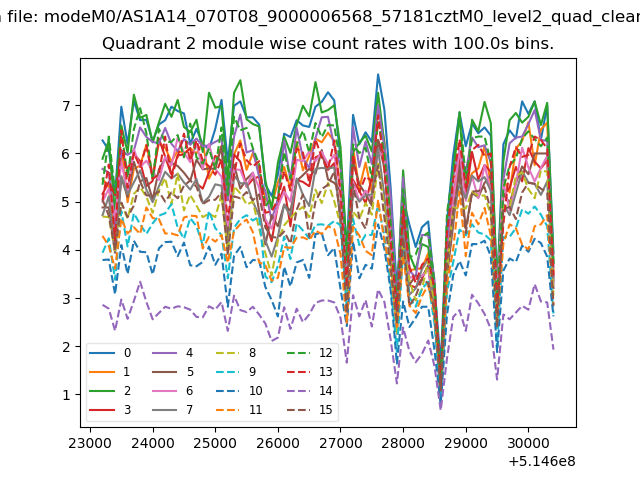
| Module-wise count rates for Quadrant B Data is divided into 100 sec bins |
 |
 |
| Module-wise count rates for Quadrant C Data is divided into 100 sec bins |
 |
 |
| Module-wise count rates for Quadrant D Data is divided into 100 sec bins |
 |
 |
| Parameter | Plot |
|---|---|
| CZT HV Monitor | 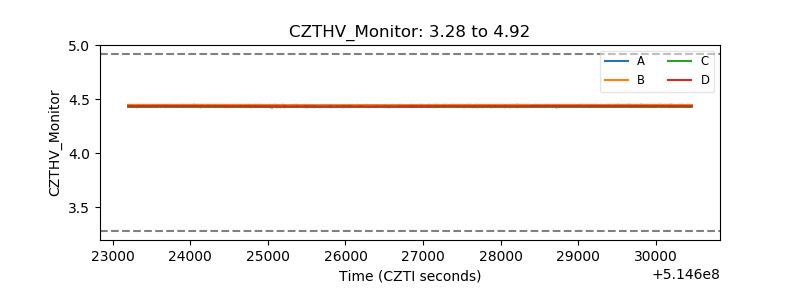 |
| D_VDD | 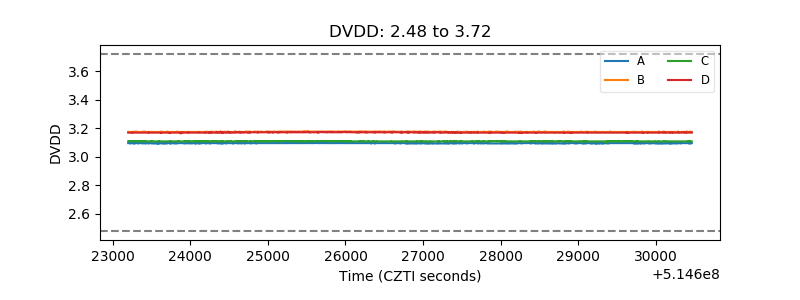 |
| Temperature 1 | 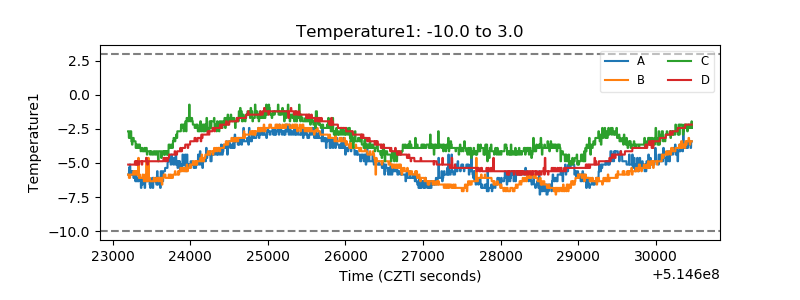 |
| Veto HV Monitor |  |
| Veto LLD | 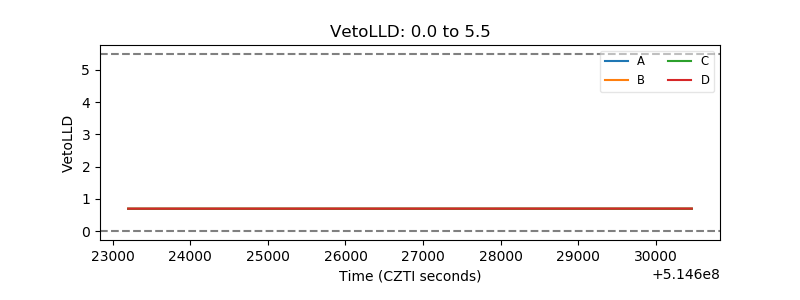 |
| Alpha Counter | 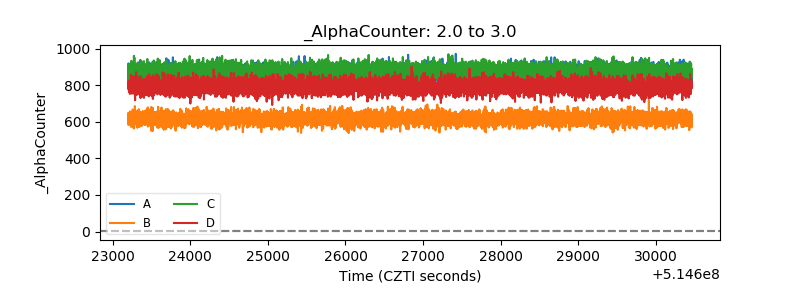 |
| _CPM_Rate | 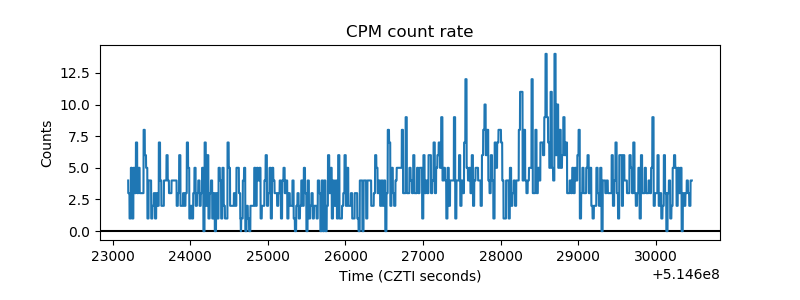 |
| CZT Counter | 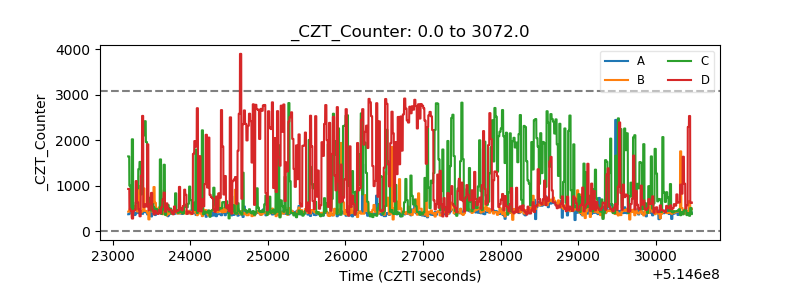 |
| +2.5 Volts monitor | 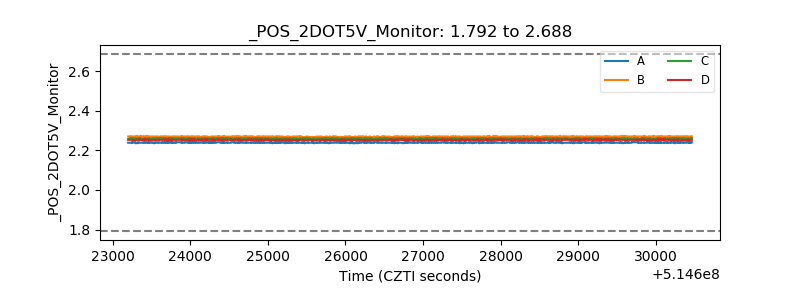 |
| +5 Volts monitor | 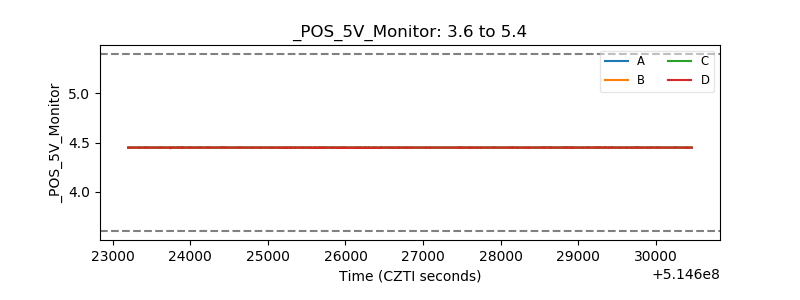 |
| _ROLL_ROT | 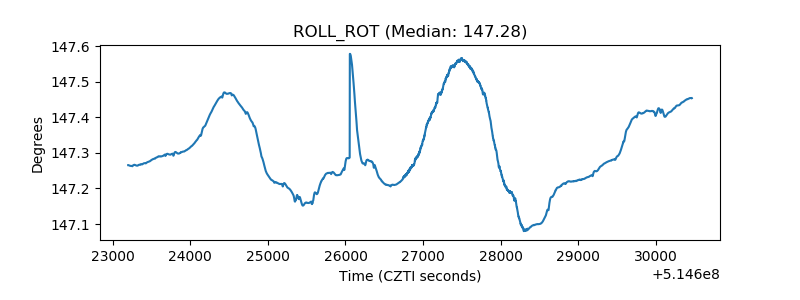 |
| _Roll_DEC | 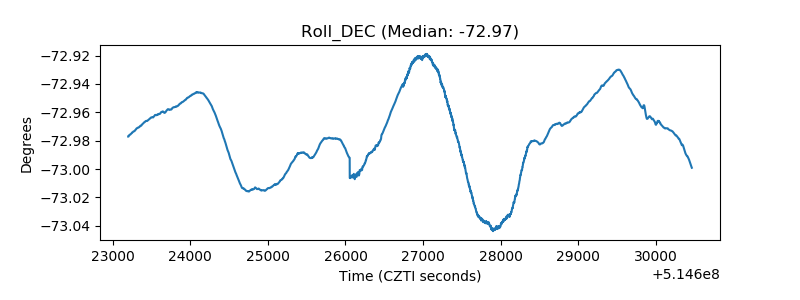 |
| _Roll_RA | 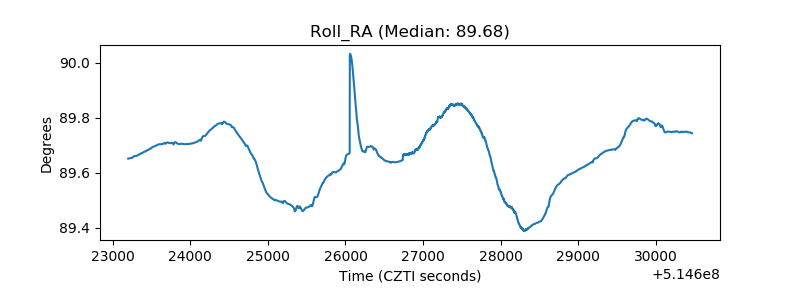 |
| Veto Counter | 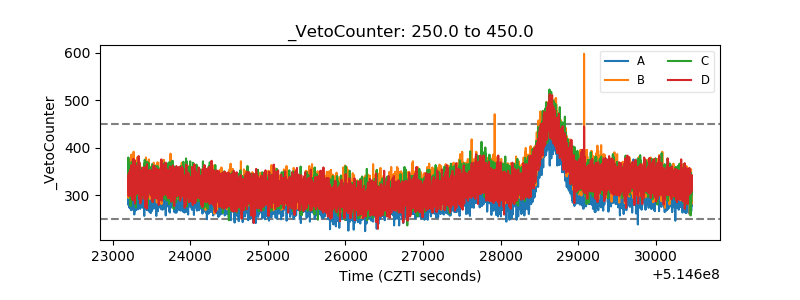 |