| Param | Original file | Final file |
|---|---|---|
| Filename | modeM0/AS1A14_070T08_9000006568_57184cztM0_level2.fits | modeM0/AS1A14_070T08_9000006568_57184cztM0_level2_quad_clean.evt |
| Size (bytes) | 1,318,639,680 | 248,552,640 |
| Size | 1.2 GB | 237.0 MB |
| Events in quadrant A | 7,781,263 | 1,698,938 |
| Events in quadrant B | 9,507,033 | 1,795,338 |
| Events in quadrant C | 15,869,089 | 1,453,426 |
| Events in quadrant D | 14,235,696 | 1,315,056 |
| Mode M9 | |||
|---|---|---|---|
| Quadrant | BADHDUFLAG | Total packets | Discarded packets |
| A | 0 | 13 | 0 |
| B | 0 | 13 | 0 |
| C | 0 | 13 | 0 |
| D | 0 | 13 | 0 |
| Mode SS | |||
|---|---|---|---|
| Quadrant | BADHDUFLAG | Total packets | Discarded packets |
| A | 0 | 372 | 0 |
| B | 0 | 372 | 0 |
| C | 0 | 372 | 0 |
| D | 0 | 372 | 0 |
| Mode M0 | |||
|---|---|---|---|
| Quadrant | BADHDUFLAG | Total packets | Discarded packets |
| A | 0 | 37378 | 3 |
| B | 0 | 41311 | 4 |
| C | 0 | 60037 | 3 |
| D | 0 | 55016 | 3 |
| Quadrant | Total seconds | Saturated seconds | Saturation percentage |
|---|---|---|---|
| A | 18320 | 316 | 1.724891% |
| B | 18320 | 654 | 3.569869% |
| C | 18320 | 2315 | 12.636463% |
| D | 18320 | 1933 | 10.551310% |
Noise dominated data is calculated using 1-second bins in cleaned event files. If a bin has >2000 counts, and if more than 50% of those come from <1% of pixels, then it is considered to be noise-dominated and hence unusable.
| Quadrant | # 1 sec bins | Bins with >0 counts | Bins with >2000 counts | High rate bins dominated by noise | Noise dominated (total time) | Noise dominated (detector-on time) | Marked lightcurve |
|---|---|---|---|---|---|---|---|
| A | 19555 | 18322 | 5 | 5 | 0.03% | 0.03% | 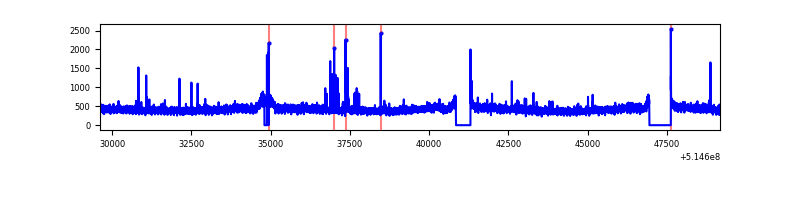 |
| B | 19555 | 18321 | 182 | 182 | 0.93% | 0.99% | 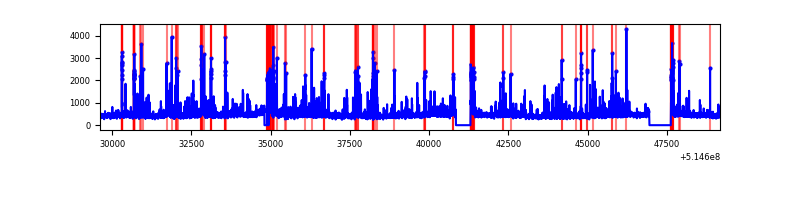 |
| C | 19555 | 18322 | 1841 | 1841 | 9.41% | 10.05% | 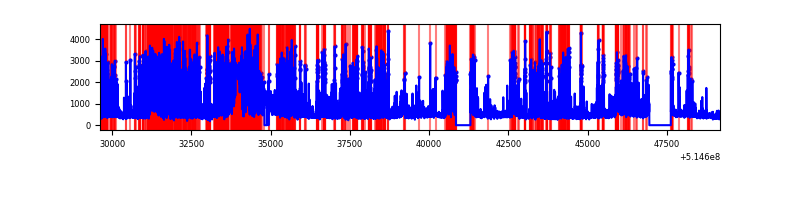 |
| D | 19555 | 18324 | 1646 | 1646 | 8.42% | 8.98% | 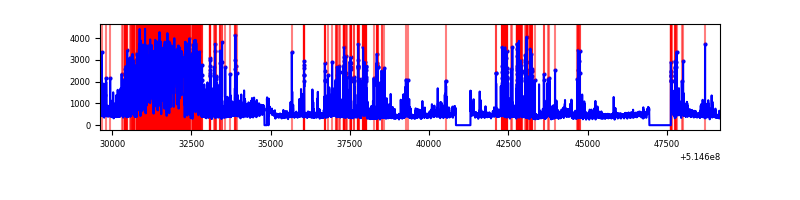 |
Top three noisy pixels from each quadrant. If the there are fewer than three noisy pixels in the level2.evt file, extra rows are filled as -1
| Pixel properties | Quadrant properties | ||||||
|---|---|---|---|---|---|---|---|
| Quadrant | DetID | PixID | Counts | Sigma | Mean | Median | Sigma |
| A | 3 | 14 | 67274 | 135.17 | 1962 | 1909 | 483.6 |
| A | 10 | 251 | 58186 | 116.38 | 1962 | 1909 | 483.6 |
| A | 13 | 254 | 29874 | 57.83 | 1962 | 1909 | 483.6 |
| B | 10 | 16 | 489736 | 1207.46 | 1907 | 1832 | 404.1 |
| B | 0 | 213 | 356781 | 878.42 | 1907 | 1832 | 404.1 |
| B | 2 | 249 | 339578 | 835.85 | 1907 | 1832 | 404.1 |
| C | 15 | 224 | 8316986 | 17152.38 | 1785 | 1761 | 484.8 |
| C | 9 | 38 | 224141 | 458.72 | 1785 | 1761 | 484.8 |
| C | 2 | 12 | 77654 | 156.55 | 1785 | 1761 | 484.8 |
| D | 12 | 33 | 4800773 | 9317.53 | 1822 | 1740 | 515.1 |
| D | 2 | 249 | 1232956 | 2390.46 | 1822 | 1740 | 515.1 |
| D | 8 | 240 | 355630 | 687.09 | 1822 | 1740 | 515.1 |
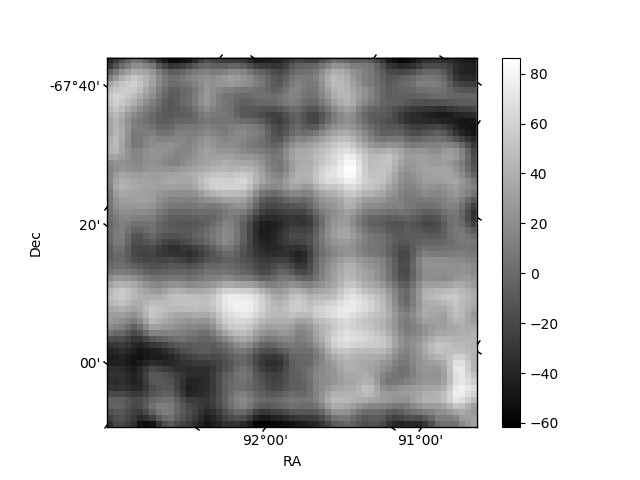
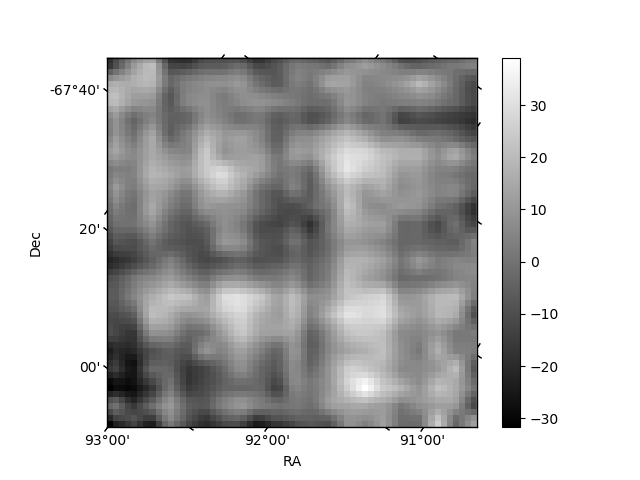
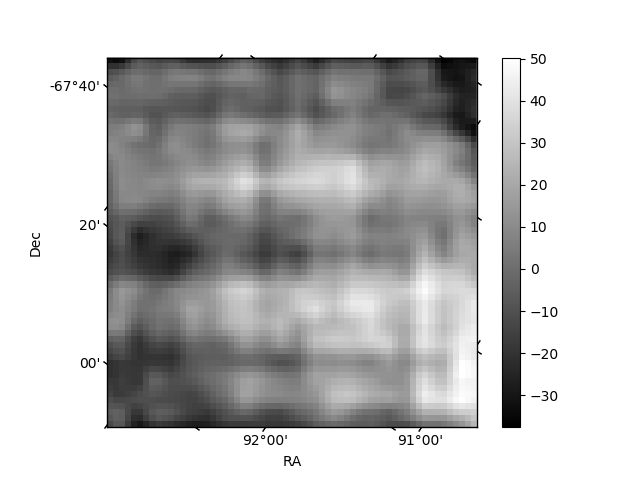
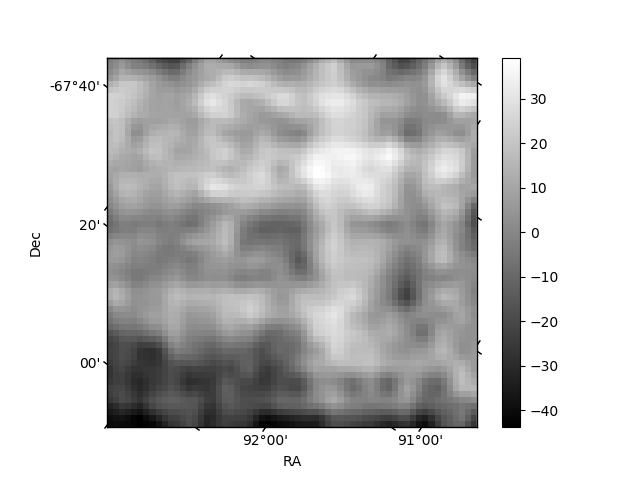
Histogram calculated using DETX and DETY for each event in the final _common_clean file
| Quadrant A | 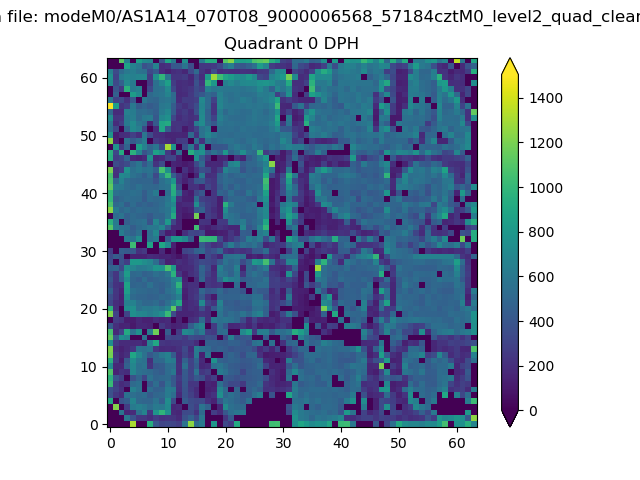 |
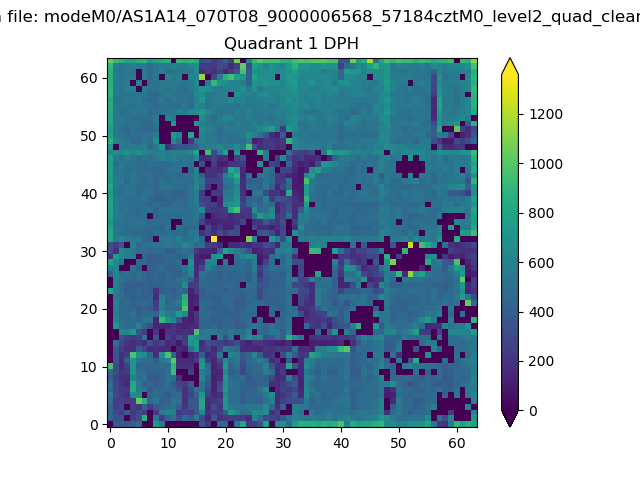 |
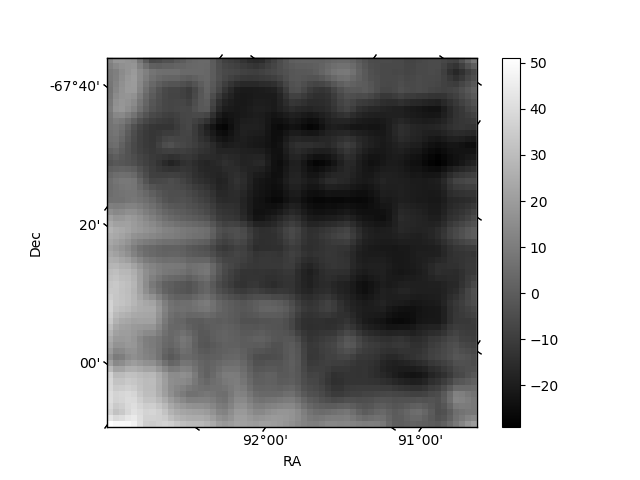
Quadrant B |
|---|---|---|---|
| Quadrant D | 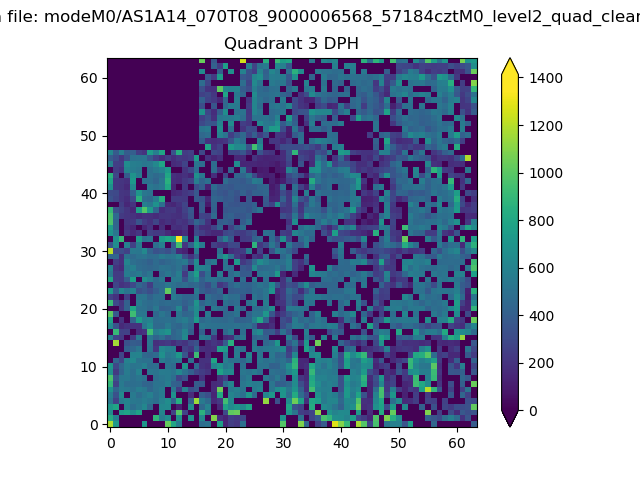 |
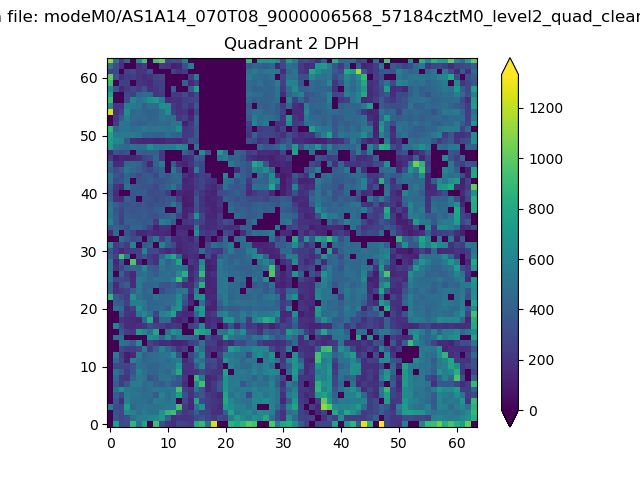 |
Quadrant C |
| Plot type | Count rate plots | Images |
|---|---|---|
| Comparison with Poisson distribution Blue bars denote a histogram of data divided into 1 sec bins. Red curve is a Poisson curve with rate = median count rate of data. |
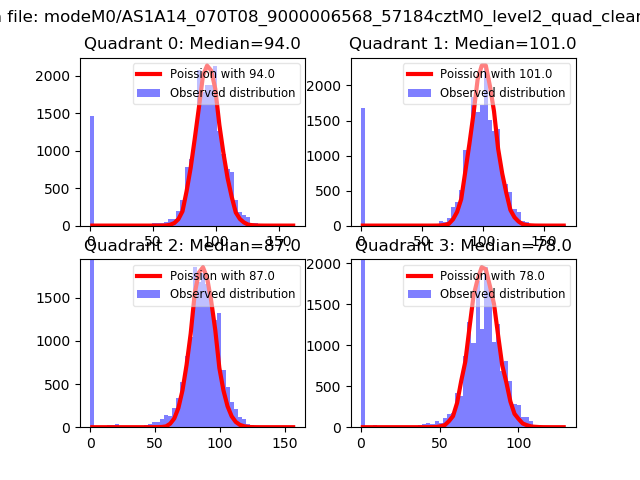 |
 |
| Quadrant-wise count rates Data is divided into 100 sec bins |
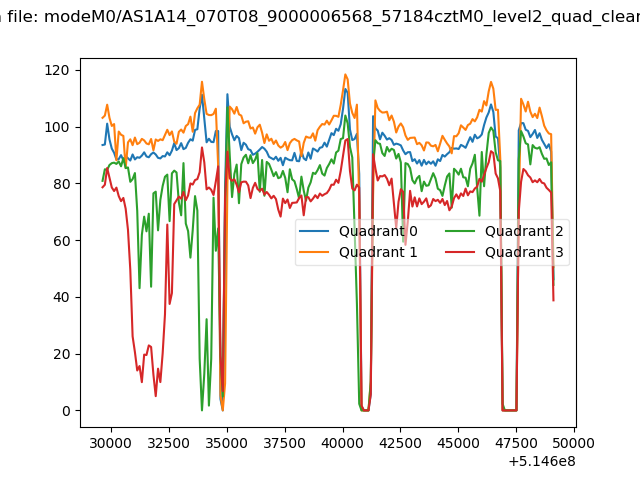 |
|
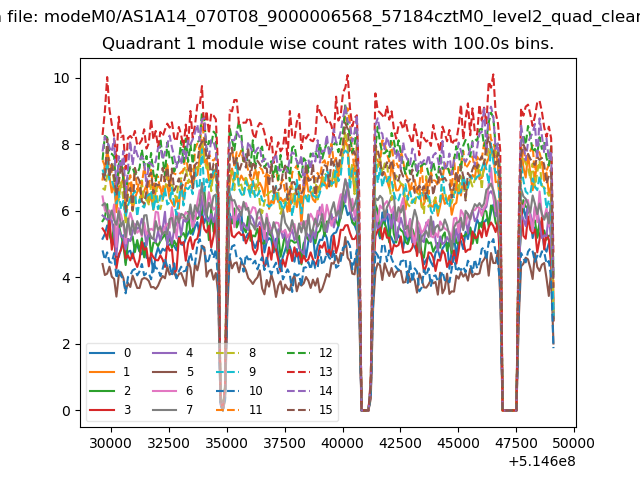
| Module-wise count rates for Quadrant A Data is divided into 100 sec bins |
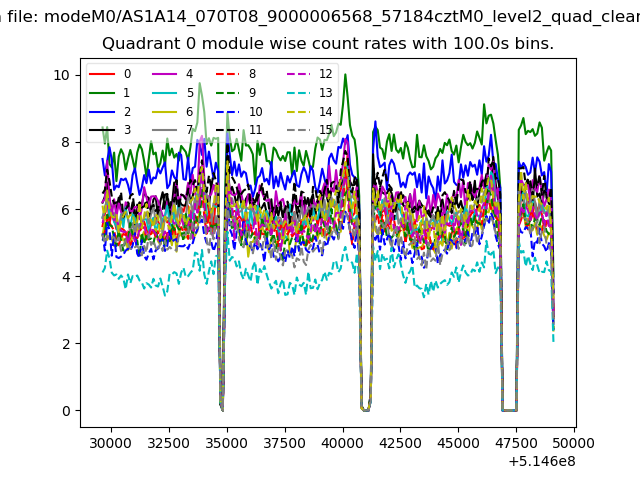 |
 |
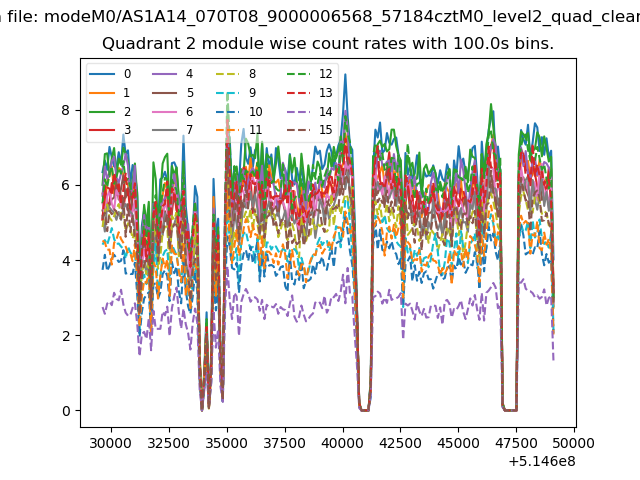
| Module-wise count rates for Quadrant B Data is divided into 100 sec bins |
 |
 |
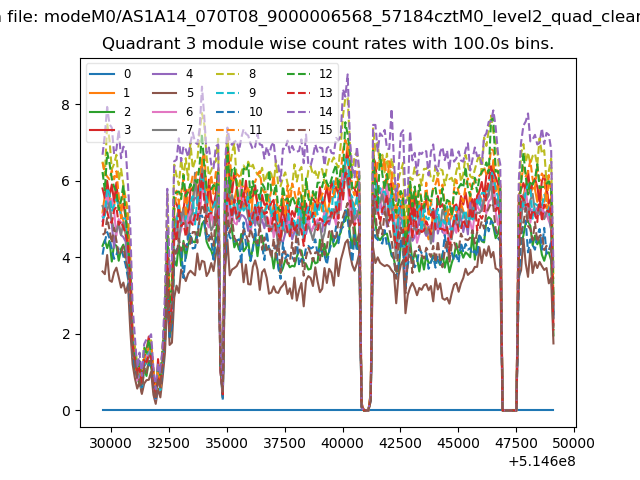
| Module-wise count rates for Quadrant C Data is divided into 100 sec bins |
 |
 |
| Module-wise count rates for Quadrant D Data is divided into 100 sec bins |
 |
 |
| Parameter | Plot |
|---|---|
| CZT HV Monitor | 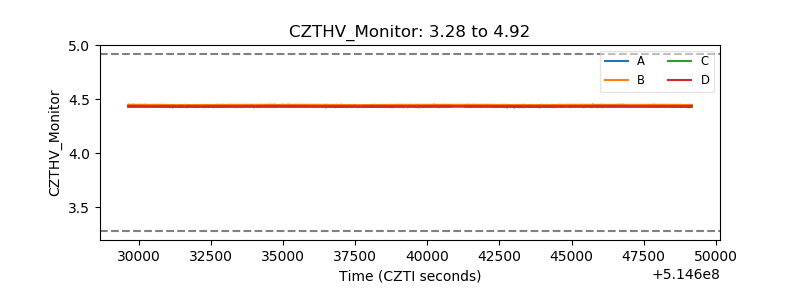 |
| D_VDD | 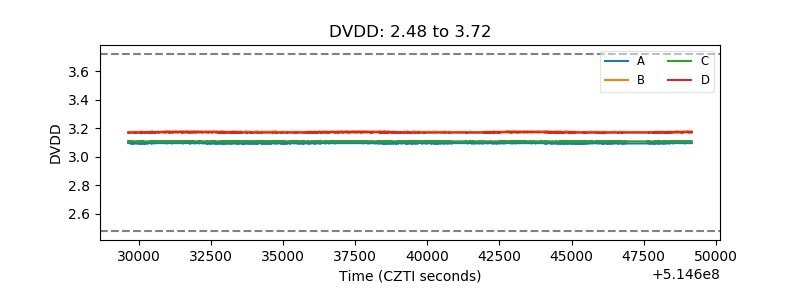 |
| Temperature 1 | 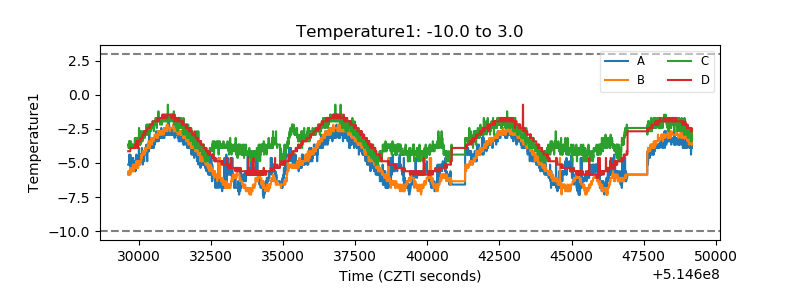 |
| Veto HV Monitor | 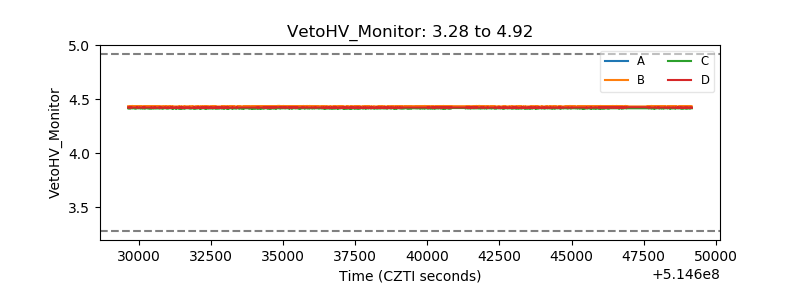 |
| Veto LLD | 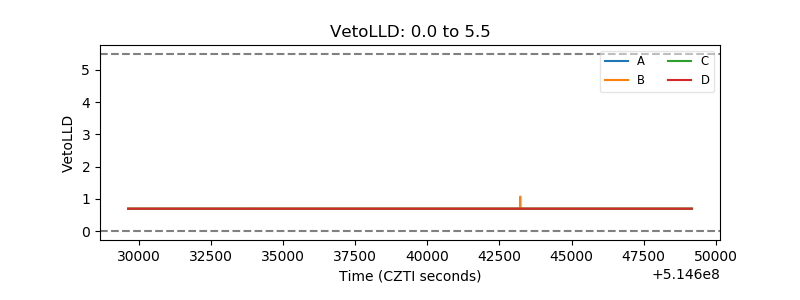 |
| Alpha Counter | 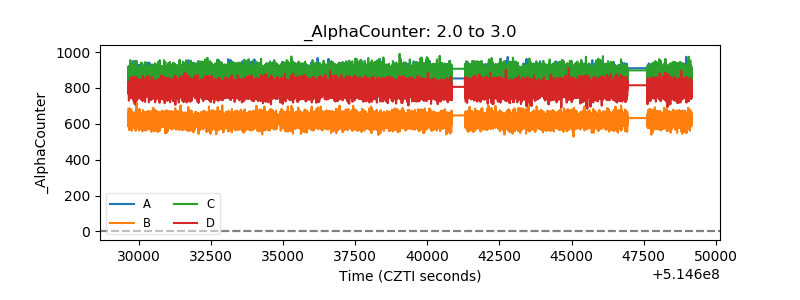 |
| _CPM_Rate | 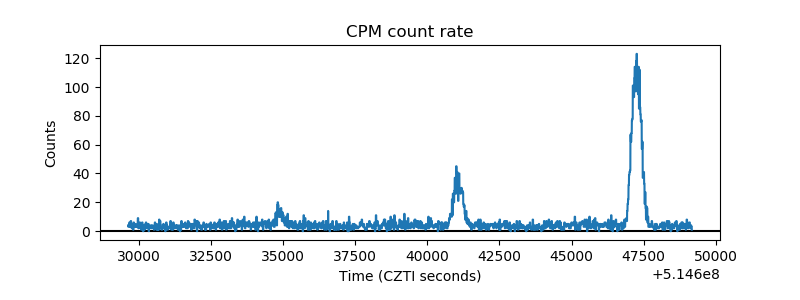 |
| CZT Counter | 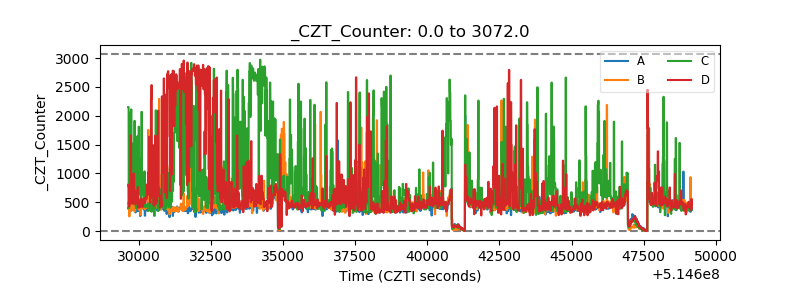 |
| +2.5 Volts monitor |  |
| +5 Volts monitor |  |
| _ROLL_ROT | 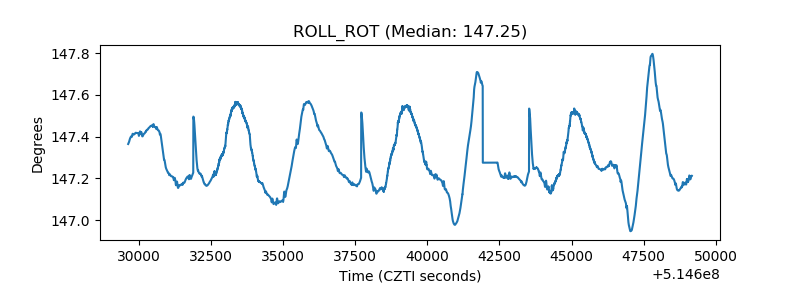 |
| _Roll_DEC | 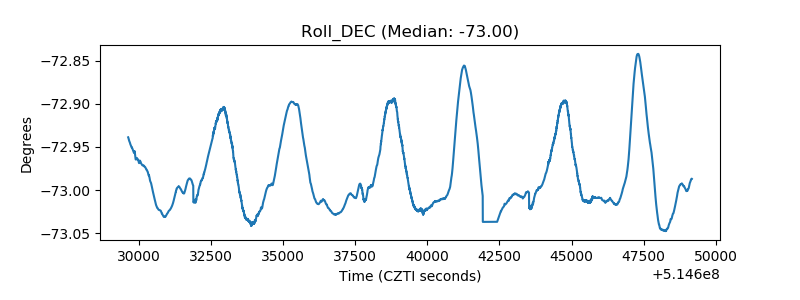 |
| _Roll_RA | 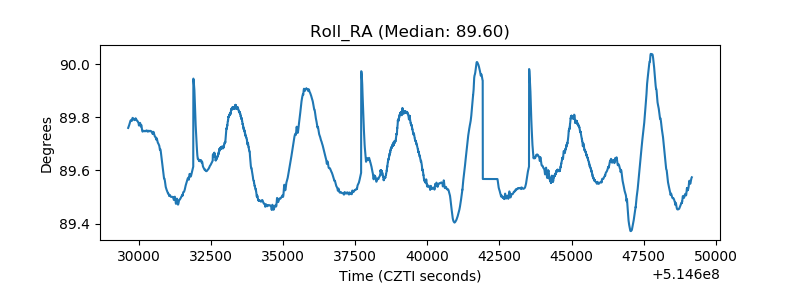 |
| Veto Counter | 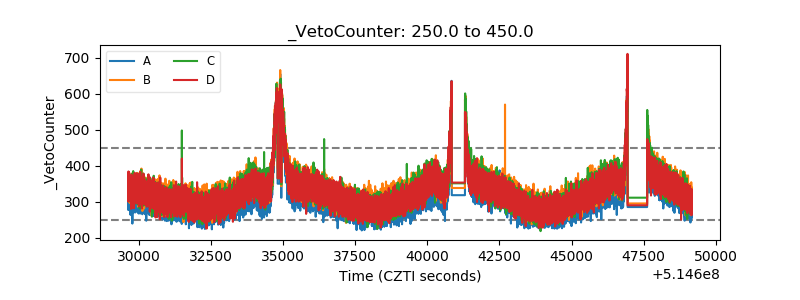 |