| Param | Original file | Final file |
|---|---|---|
| Filename | modeM0/AS1A14_070T08_9000006568_57185cztM0_level2.fits | modeM0/AS1A14_070T08_9000006568_57185cztM0_level2_quad_clean.evt |
| Size (bytes) | 413,758,080 | 86,083,200 |
| Size | 394.6 MB | 82.1 MB |
| Events in quadrant A | 2,722,604 | 578,999 |
| Events in quadrant B | 4,320,188 | 576,770 |
| Events in quadrant C | 4,619,191 | 505,101 |
| Events in quadrant D | 3,179,116 | 519,574 |
| Mode M9 | |||
|---|---|---|---|
| Quadrant | BADHDUFLAG | Total packets | Discarded packets |
| A | 0 | 9 | 0 |
| B | 0 | 9 | 0 |
| C | 0 | 9 | 0 |
| D | 0 | 9 | 0 |
| Mode SS | |||
|---|---|---|---|
| Quadrant | BADHDUFLAG | Total packets | Discarded packets |
| A | 0 | 124 | 0 |
| B | 0 | 124 | 0 |
| C | 0 | 124 | 0 |
| D | 0 | 124 | 0 |
| Mode M0 | |||
|---|---|---|---|
| Quadrant | BADHDUFLAG | Total packets | Discarded packets |
| A | 0 | 12829 | 1 |
| B | 0 | 17141 | 1 |
| C | 0 | 18106 | 1 |
| D | 0 | 13756 | 1 |
| Quadrant | Total seconds | Saturated seconds | Saturation percentage |
|---|---|---|---|
| A | 6101 | 53 | 0.868710% |
| B | 6101 | 536 | 8.785445% |
| C | 6101 | 515 | 8.441239% |
| D | 6101 | 44 | 0.721193% |
Noise dominated data is calculated using 1-second bins in cleaned event files. If a bin has >2000 counts, and if more than 50% of those come from <1% of pixels, then it is considered to be noise-dominated and hence unusable.
| Quadrant | # 1 sec bins | Bins with >0 counts | Bins with >2000 counts | High rate bins dominated by noise | Noise dominated (total time) | Noise dominated (detector-on time) | Marked lightcurve |
|---|---|---|---|---|---|---|---|
| A | 6996 | 6102 | 31 | 31 | 0.44% | 0.51% | 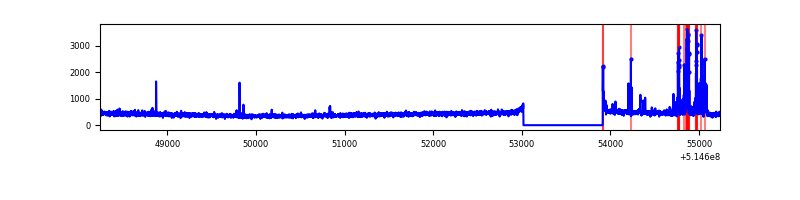 |
| B | 6996 | 6102 | 334 | 334 | 4.77% | 5.47% | 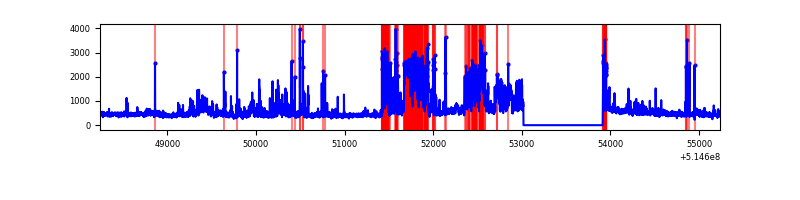 |
| C | 6996 | 6101 | 475 | 475 | 6.79% | 7.79% | 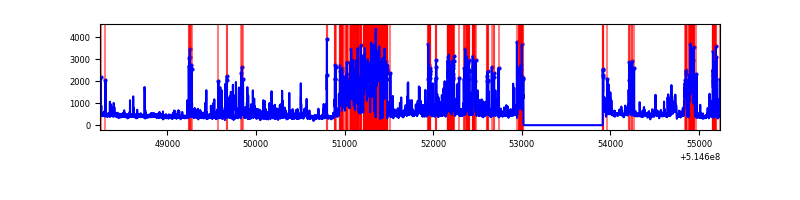 |
| D | 6996 | 6102 | 45 | 45 | 0.64% | 0.74% | 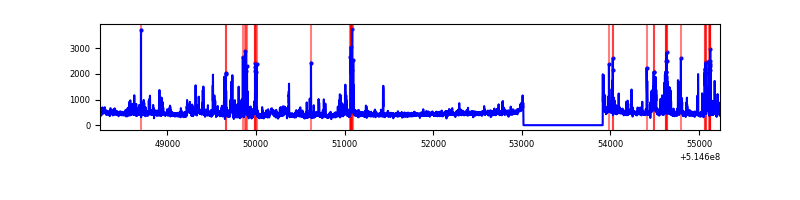 |
Top three noisy pixels from each quadrant. If the there are fewer than three noisy pixels in the level2.evt file, extra rows are filled as -1
| Pixel properties | Quadrant properties | ||||||
|---|---|---|---|---|---|---|---|
| Quadrant | DetID | PixID | Counts | Sigma | Mean | Median | Sigma |
| A | 10 | 251 | 179998 | 1122.56 | 644 | 627 | 159.8 |
| A | 3 | 14 | 14142 | 84.58 | 644 | 627 | 159.8 |
| A | 13 | 248 | 11462 | 67.81 | 644 | 627 | 159.8 |
| B | 5 | 185 | 1228647 | 9268.27 | 614 | 592 | 132.5 |
| B | 10 | 16 | 227157 | 1709.91 | 614 | 592 | 132.5 |
| B | 0 | 199 | 109548 | 822.3 | 614 | 592 | 132.5 |
| C | 15 | 224 | 2013602 | 12226.72 | 595 | 589 | 164.6 |
| C | 2 | 12 | 119555 | 722.58 | 595 | 589 | 164.6 |
| C | 12 | 2 | 50608 | 303.81 | 595 | 589 | 164.6 |
| D | 2 | 249 | 288697 | 1648.68 | 617 | 588 | 174.8 |
| D | 12 | 33 | 150104 | 855.6 | 617 | 588 | 174.8 |
| D | 8 | 240 | 107999 | 614.65 | 617 | 588 | 174.8 |
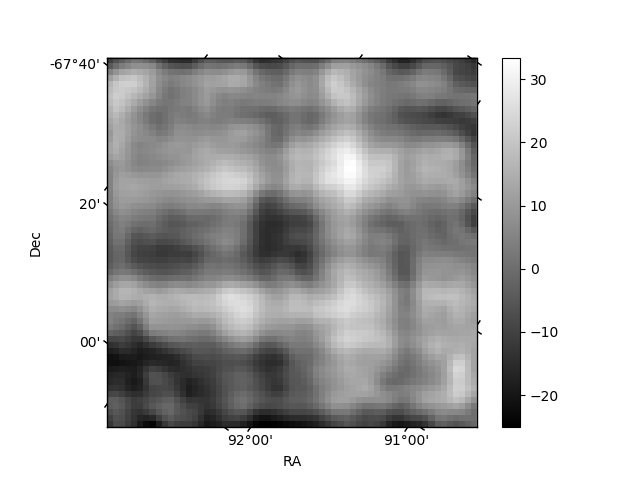
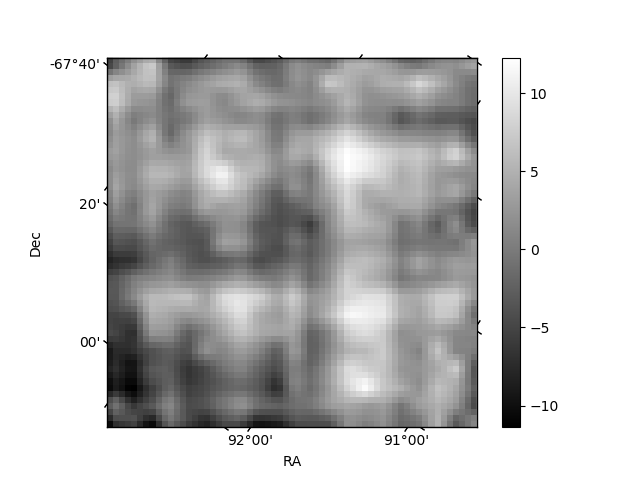
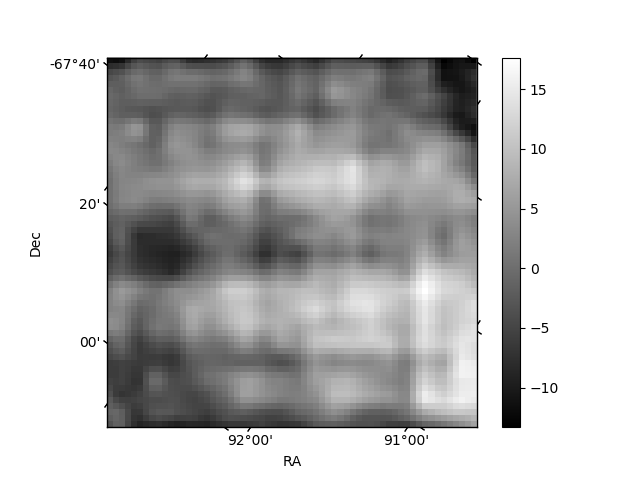
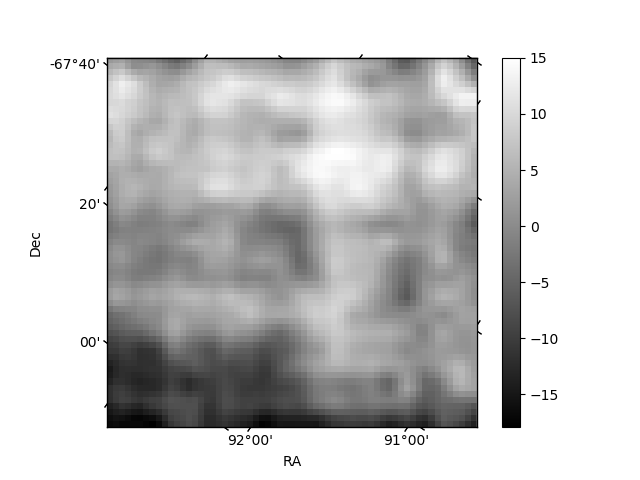
Histogram calculated using DETX and DETY for each event in the final _common_clean file
| Quadrant A | 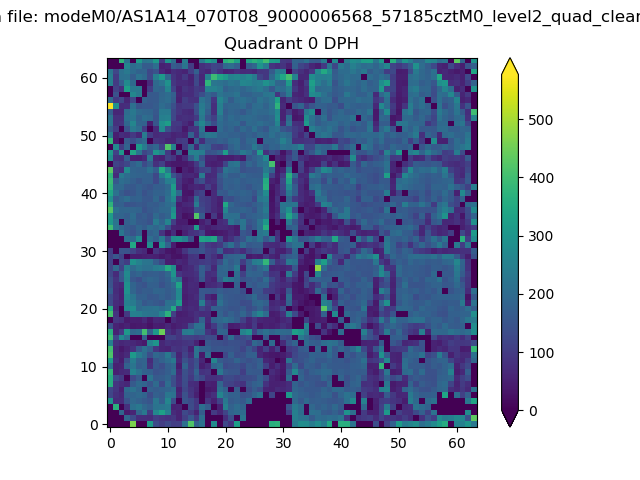 |
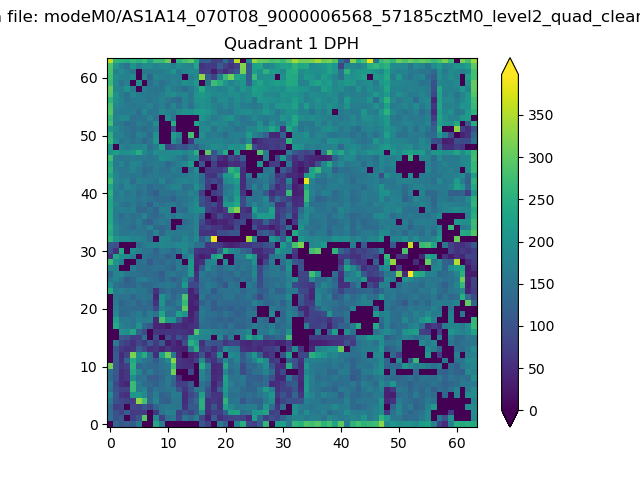 |
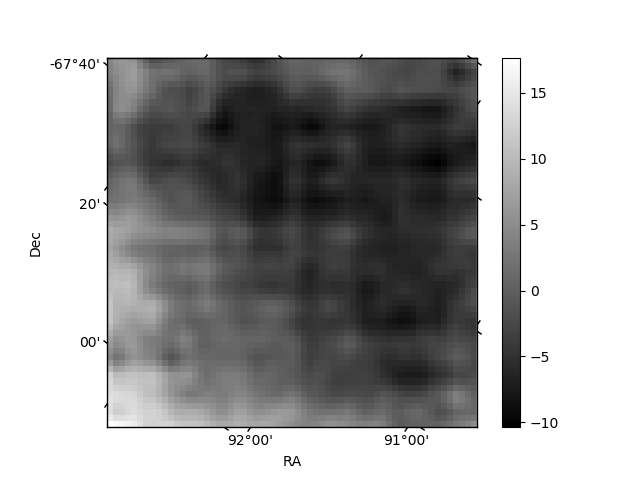
Quadrant B |
|---|---|---|---|
| Quadrant D | 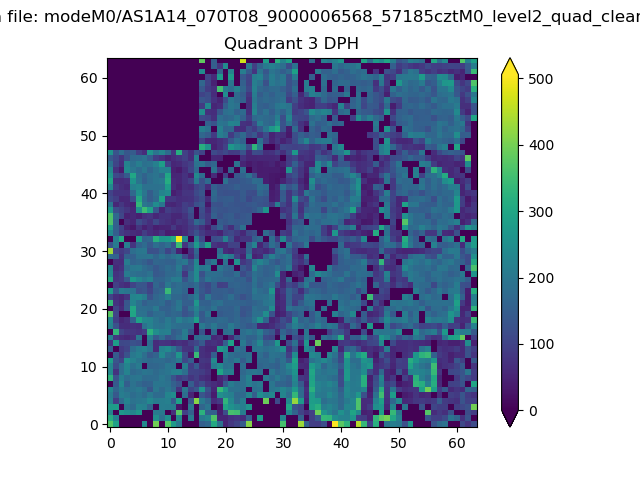 |
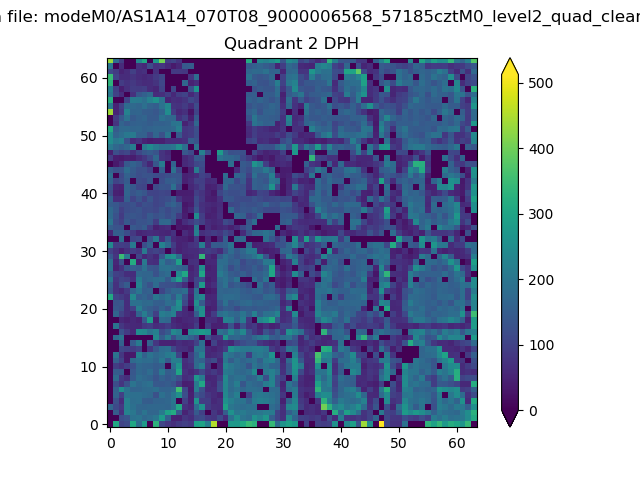 |
Quadrant C |
| Plot type | Count rate plots | Images |
|---|---|---|
| Comparison with Poisson distribution Blue bars denote a histogram of data divided into 1 sec bins. Red curve is a Poisson curve with rate = median count rate of data. |
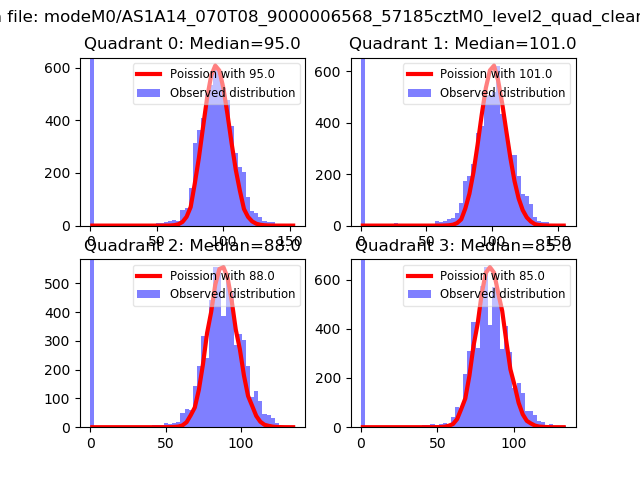 |
 |
| Quadrant-wise count rates Data is divided into 100 sec bins |
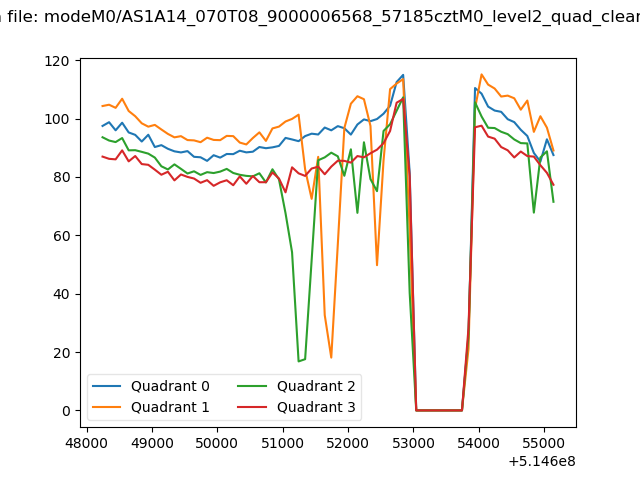 |
|
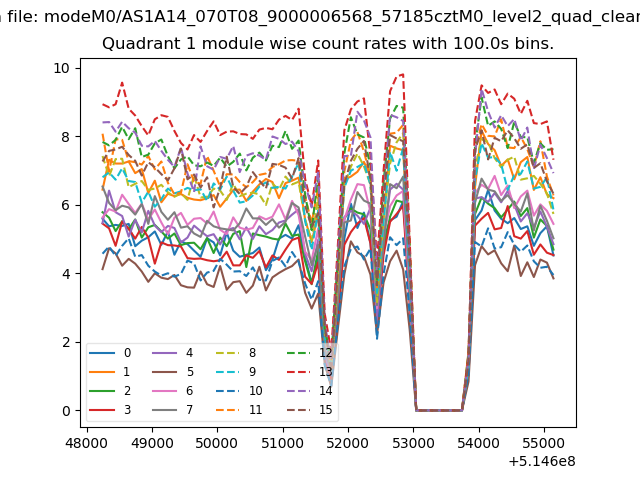
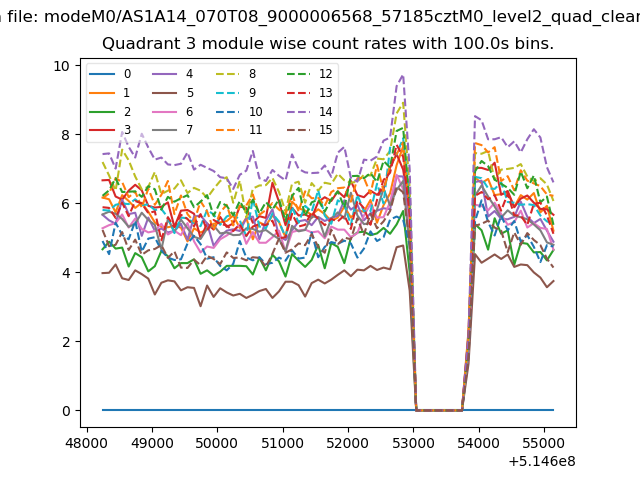
| Module-wise count rates for Quadrant A Data is divided into 100 sec bins |
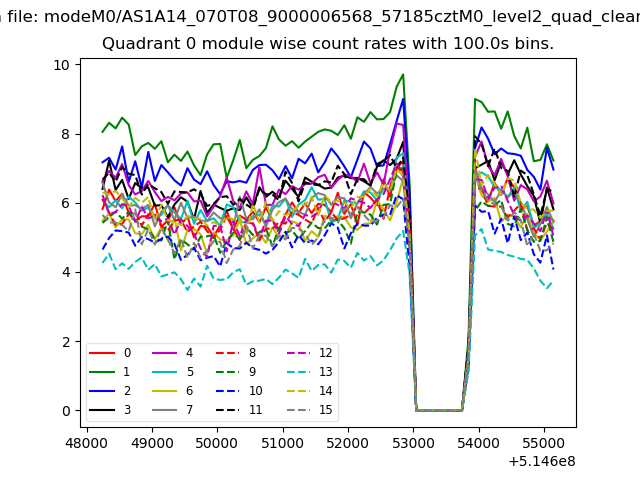 |
 |
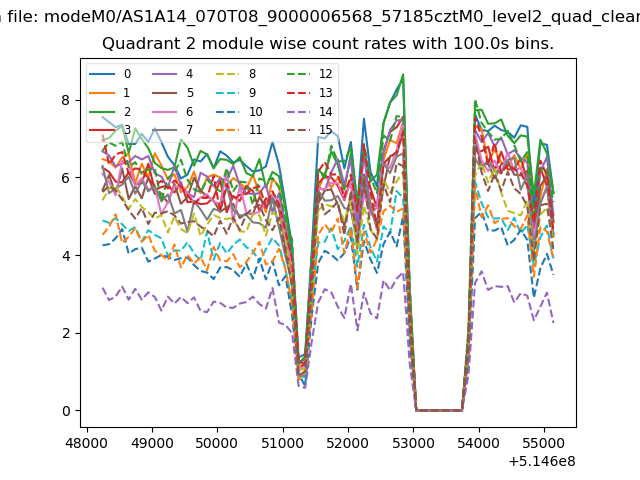
| Module-wise count rates for Quadrant B Data is divided into 100 sec bins |
 |
 |
| Module-wise count rates for Quadrant C Data is divided into 100 sec bins |
 |
 |
| Module-wise count rates for Quadrant D Data is divided into 100 sec bins |
 |
 |
| Parameter | Plot |
|---|---|
| CZT HV Monitor | 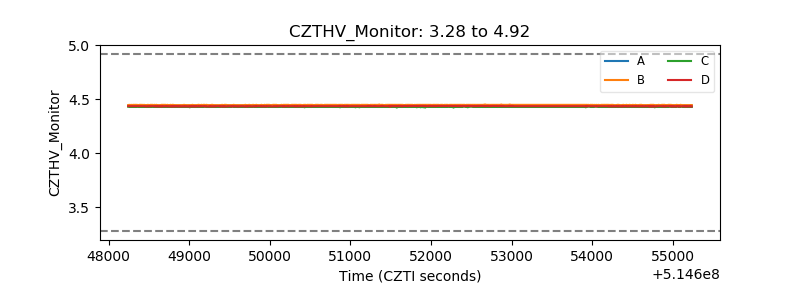 |
| D_VDD | 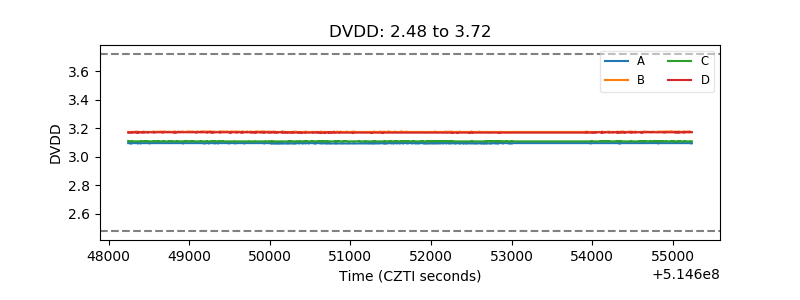 |
| Temperature 1 | 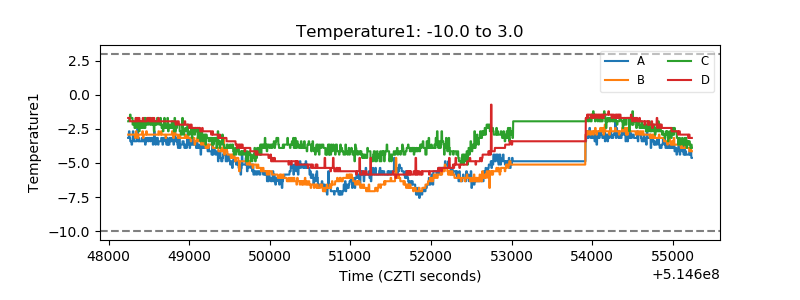 |
| Veto HV Monitor | 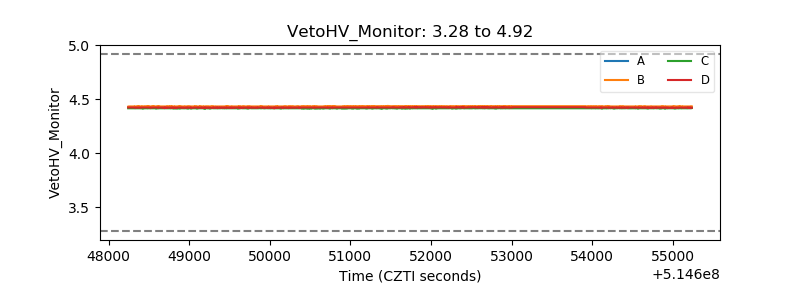 |
| Veto LLD | 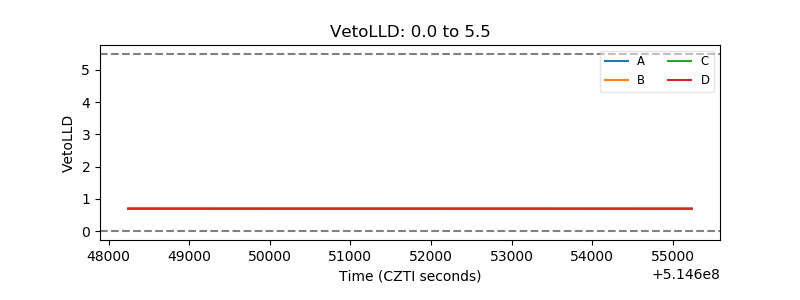 |
| Alpha Counter | 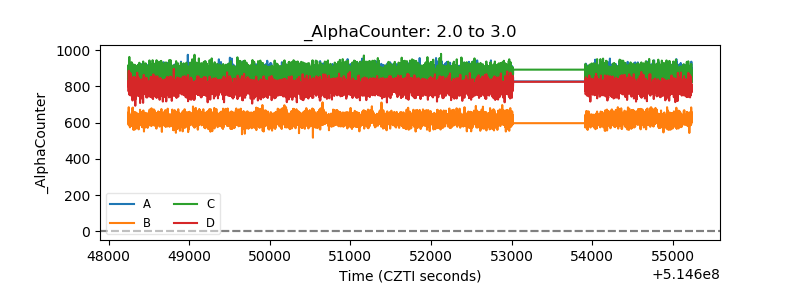 |
| _CPM_Rate | 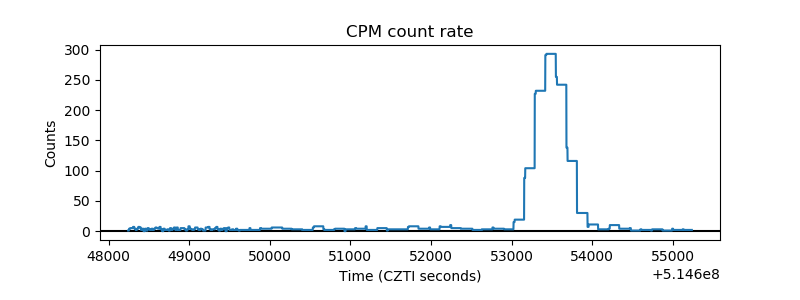 |
| CZT Counter | 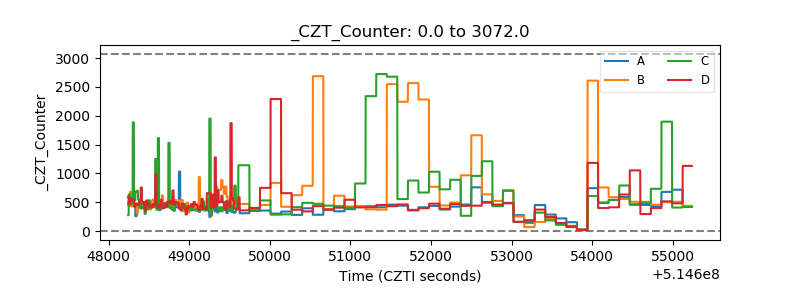 |
| +2.5 Volts monitor |  |
| +5 Volts monitor | 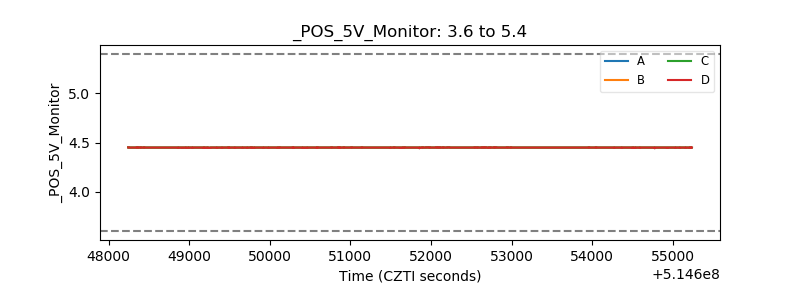 |
| _ROLL_ROT | 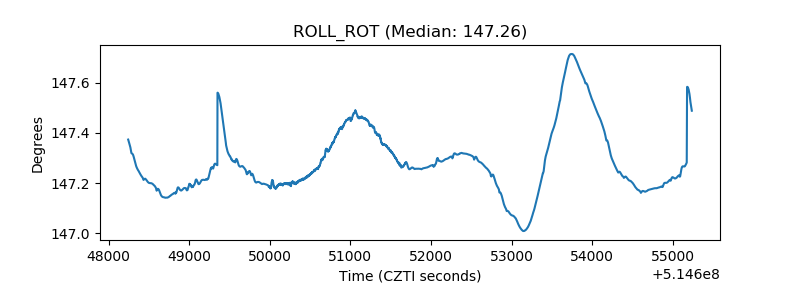 |
| _Roll_DEC | 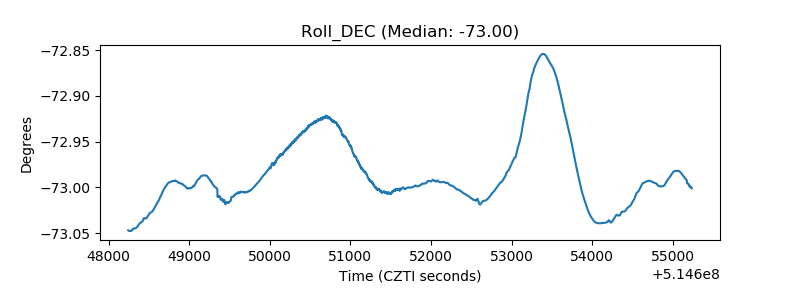 |
| _Roll_RA | 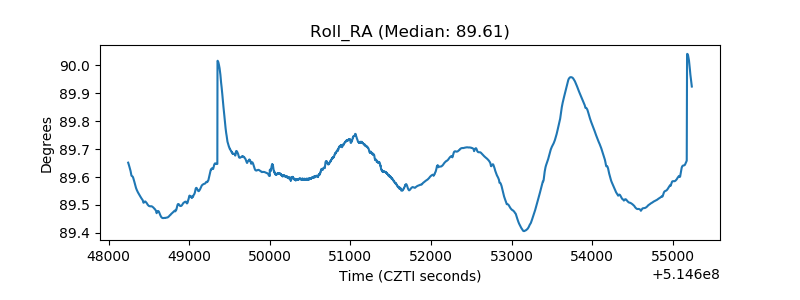 |
| Veto Counter | 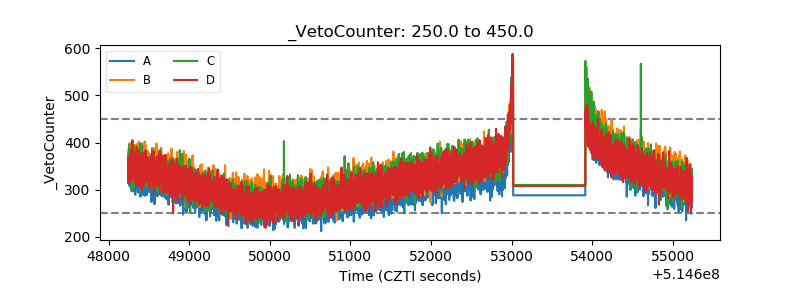 |