| Param | Original file | Final file |
|---|---|---|
| Filename | modeM0/AS1A14_070T08_9000006568_57188cztM0_level2.fits | modeM0/AS1A14_070T08_9000006568_57188cztM0_level2_quad_clean.evt |
| Size (bytes) | 409,544,640 | 89,159,040 |
| Size | 390.6 MB | 85.0 MB |
| Events in quadrant A | 2,581,076 | 599,587 |
| Events in quadrant B | 3,811,122 | 611,909 |
| Events in quadrant C | 4,525,905 | 542,361 |
| Events in quadrant D | 3,766,657 | 519,528 |
| Mode M9 | |||
|---|---|---|---|
| Quadrant | BADHDUFLAG | Total packets | Discarded packets |
| A | 0 | 11 | 0 |
| B | 0 | 11 | 0 |
| C | 0 | 11 | 0 |
| D | 0 | 11 | 0 |
| Mode SS | |||
|---|---|---|---|
| Quadrant | BADHDUFLAG | Total packets | Discarded packets |
| A | 0 | 124 | 0 |
| B | 0 | 124 | 0 |
| C | 0 | 124 | 0 |
| D | 0 | 124 | 0 |
| Mode M0 | |||
|---|---|---|---|
| Quadrant | BADHDUFLAG | Total packets | Discarded packets |
| A | 0 | 12377 | 1 |
| B | 0 | 15659 | 1 |
| C | 0 | 17720 | 1 |
| D | 0 | 15545 | 1 |
| Quadrant | Total seconds | Saturated seconds | Saturation percentage |
|---|---|---|---|
| A | 6106 | 14 | 0.229283% |
| B | 6106 | 343 | 5.617425% |
| C | 6106 | 335 | 5.486407% |
| D | 6107 | 164 | 2.685443% |
Noise dominated data is calculated using 1-second bins in cleaned event files. If a bin has >2000 counts, and if more than 50% of those come from <1% of pixels, then it is considered to be noise-dominated and hence unusable.
| Quadrant | # 1 sec bins | Bins with >0 counts | Bins with >2000 counts | High rate bins dominated by noise | Noise dominated (total time) | Noise dominated (detector-on time) | Marked lightcurve |
|---|---|---|---|---|---|---|---|
| A | 7216 | 6107 | 3 | 3 | 0.04% | 0.05% | 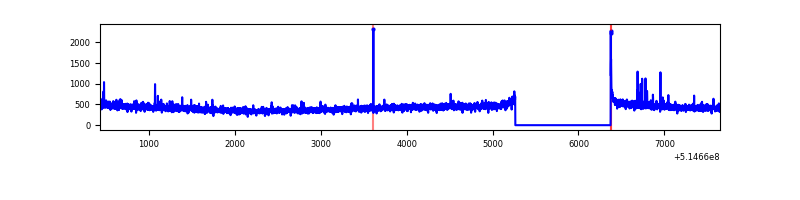 |
| B | 7216 | 6107 | 252 | 252 | 3.49% | 4.13% | 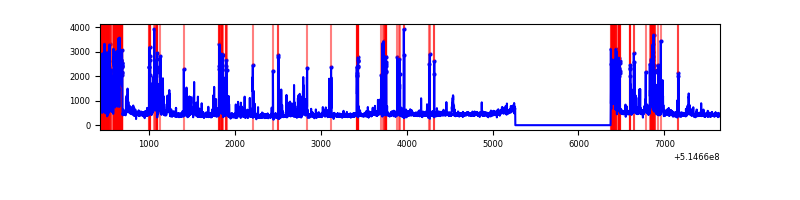 |
| C | 7216 | 6107 | 308 | 308 | 4.27% | 5.04% | 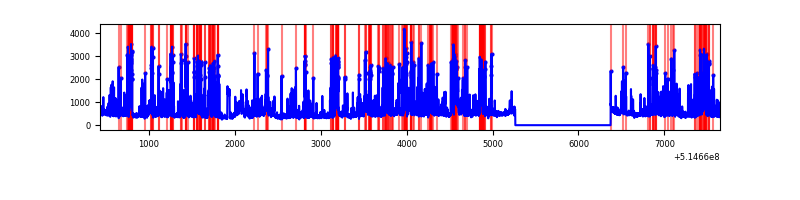 |
| D | 7217 | 6108 | 154 | 154 | 2.13% | 2.52% | 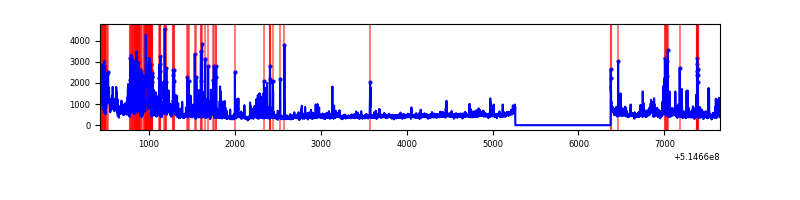 |
Top three noisy pixels from each quadrant. If the there are fewer than three noisy pixels in the level2.evt file, extra rows are filled as -1
| Pixel properties | Quadrant properties | ||||||
|---|---|---|---|---|---|---|---|
| Quadrant | DetID | PixID | Counts | Sigma | Mean | Median | Sigma |
| A | 3 | 14 | 23816 | 143.16 | 651 | 634 | 161.9 |
| A | 4 | 3 | 19078 | 113.9 | 651 | 634 | 161.9 |
| A | 10 | 251 | 15111 | 89.4 | 651 | 634 | 161.9 |
| B | 10 | 16 | 935765 | 6967.13 | 629 | 606 | 134.2 |
| B | 4 | 201 | 129111 | 957.39 | 629 | 606 | 134.2 |
| B | 5 | 185 | 60093 | 443.19 | 629 | 606 | 134.2 |
| C | 15 | 224 | 1736698 | 10408.6 | 608 | 602 | 166.8 |
| C | 12 | 2 | 121958 | 727.58 | 608 | 602 | 166.8 |
| C | 14 | 254 | 88788 | 528.71 | 608 | 602 | 166.8 |
| D | 2 | 249 | 369525 | 2103.81 | 611 | 581 | 175.4 |
| D | 12 | 33 | 345801 | 1968.53 | 611 | 581 | 175.4 |
| D | 8 | 240 | 265733 | 1511.96 | 611 | 581 | 175.4 |
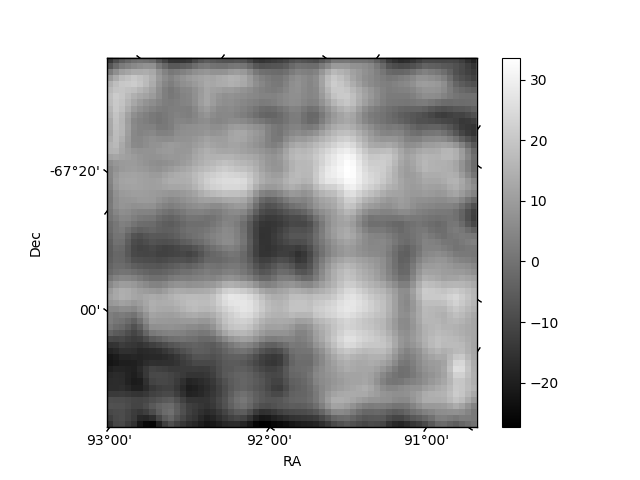
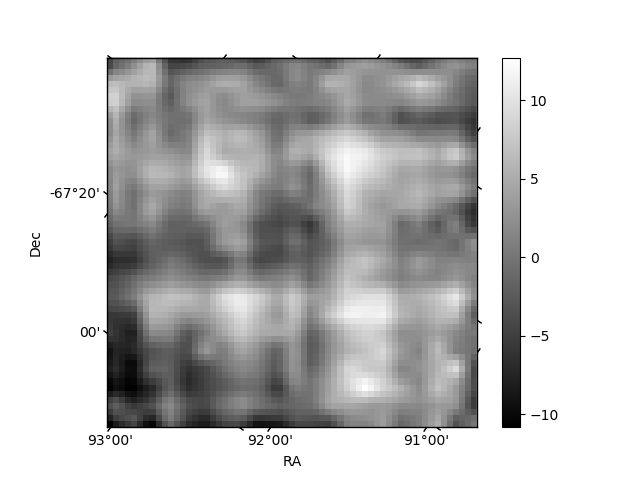
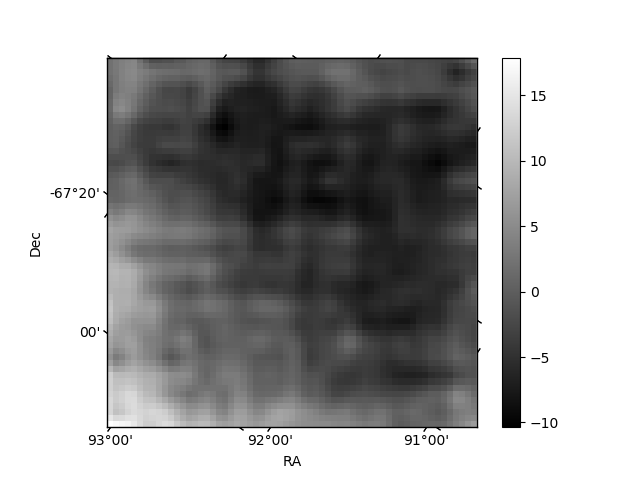
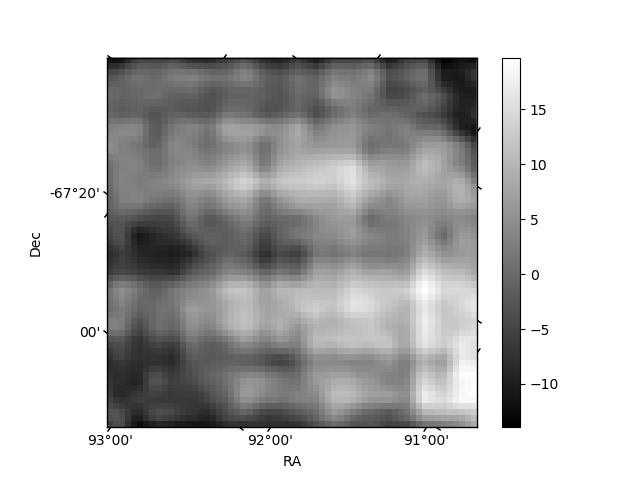
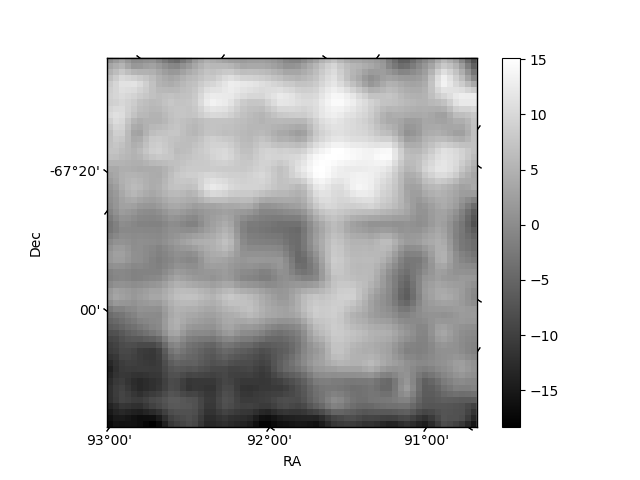
Histogram calculated using DETX and DETY for each event in the final _common_clean file
| Quadrant A | 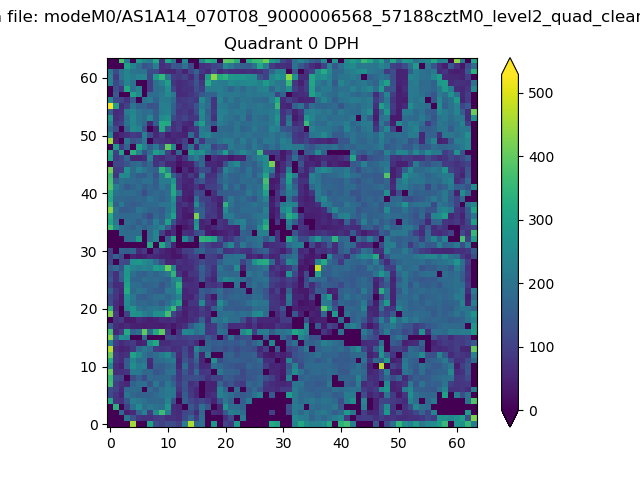 |
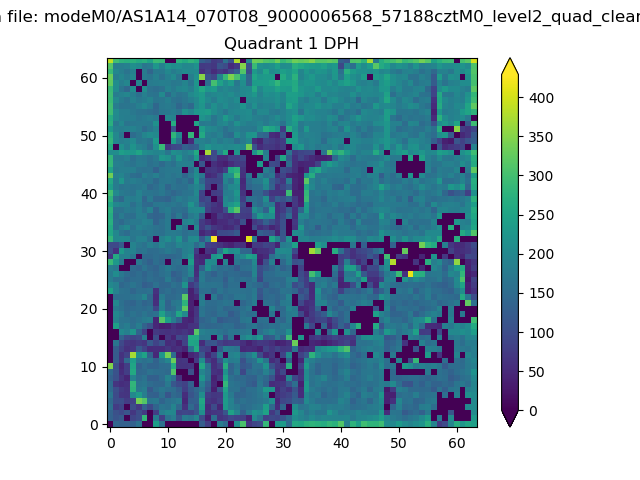 |
Quadrant B |
|---|---|---|---|
| Quadrant D | 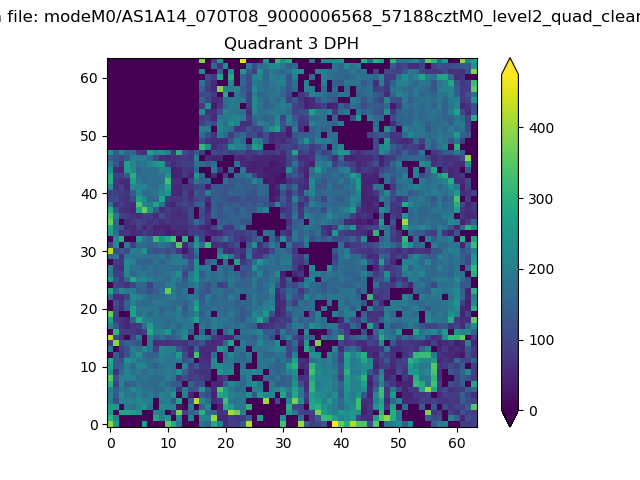 |
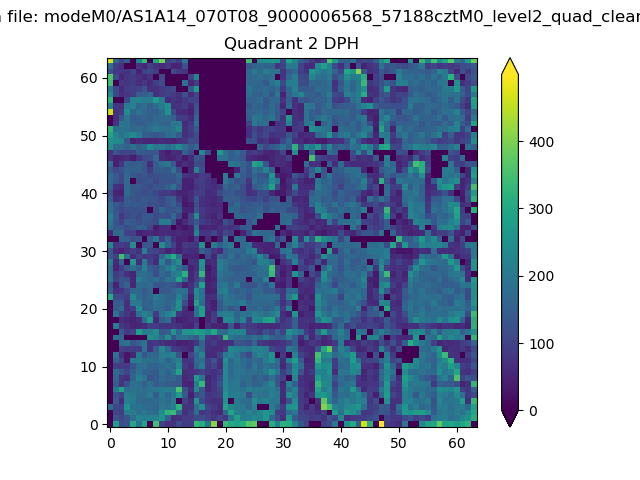 |
Quadrant C |
| Plot type | Count rate plots | Images |
|---|---|---|
| Comparison with Poisson distribution Blue bars denote a histogram of data divided into 1 sec bins. Red curve is a Poisson curve with rate = median count rate of data. |
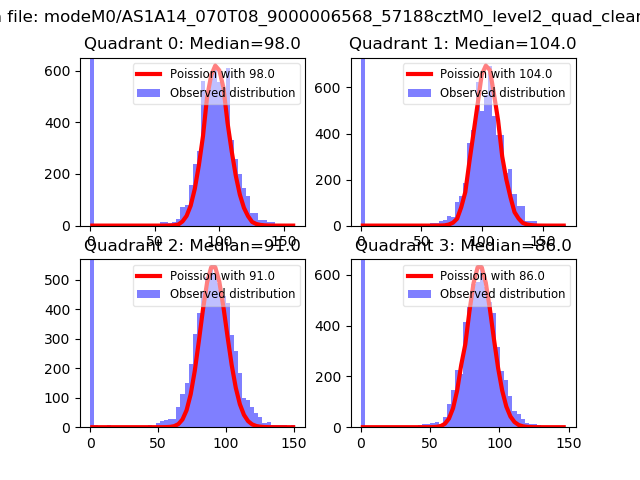 |
 |
| Quadrant-wise count rates Data is divided into 100 sec bins |
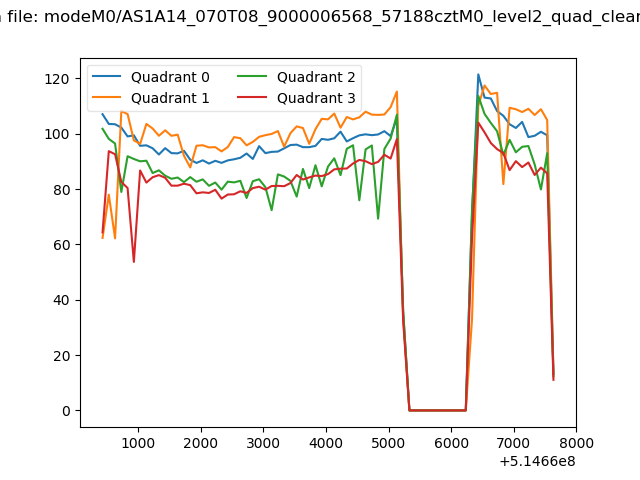 |
|
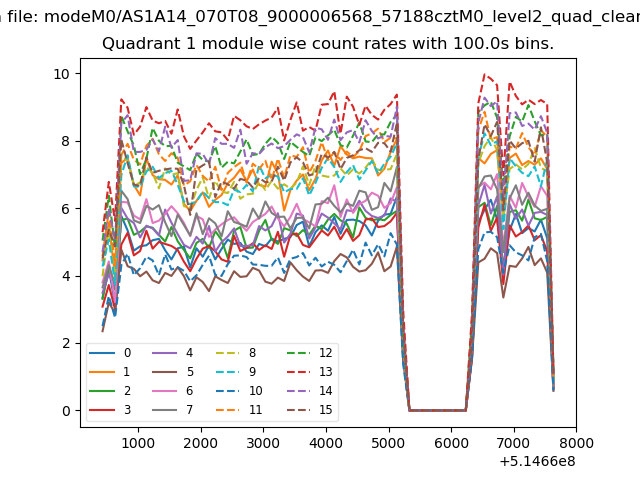
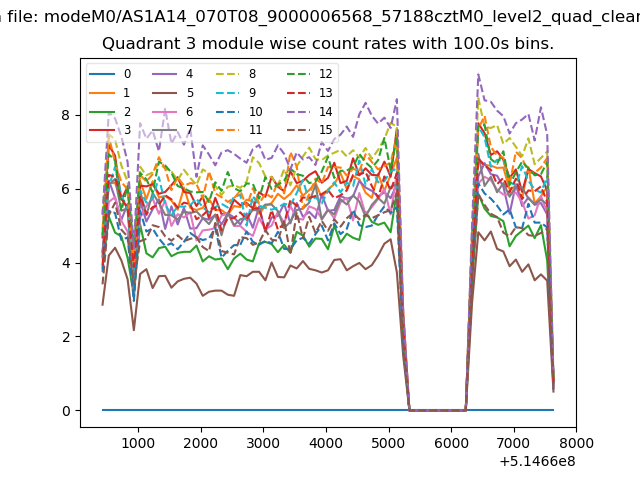
| Module-wise count rates for Quadrant A Data is divided into 100 sec bins |
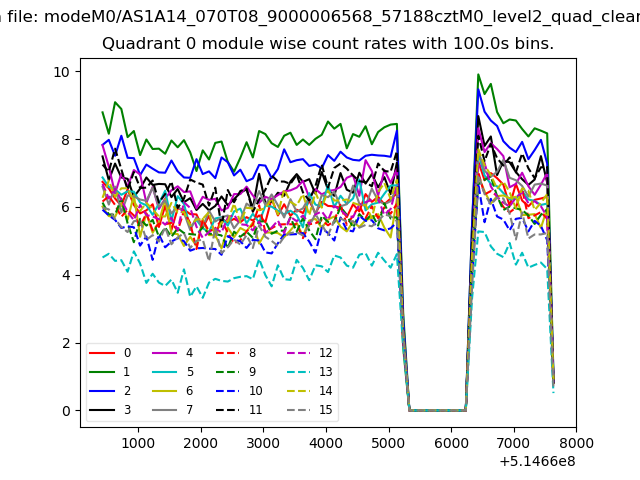 |
 |
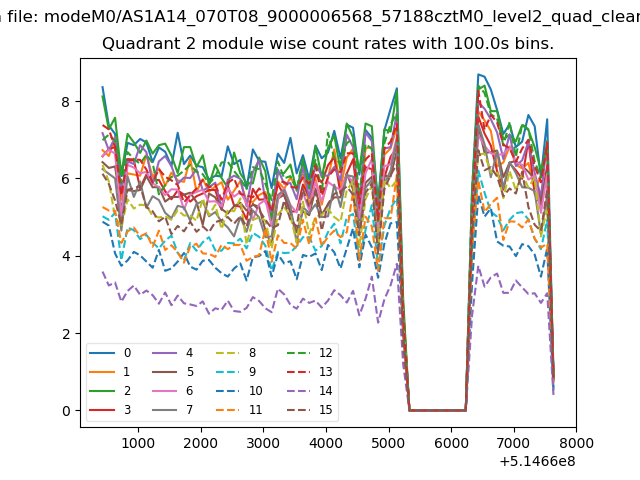
| Module-wise count rates for Quadrant B Data is divided into 100 sec bins |
 |
 |
| Module-wise count rates for Quadrant C Data is divided into 100 sec bins |
 |
 |
| Module-wise count rates for Quadrant D Data is divided into 100 sec bins |
 |
 |
| Parameter | Plot |
|---|---|
| CZT HV Monitor | 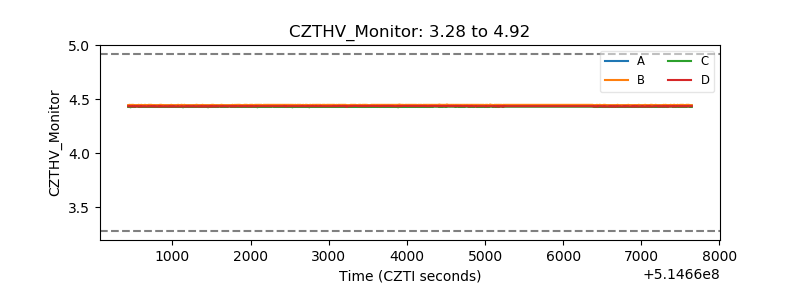 |
| D_VDD | 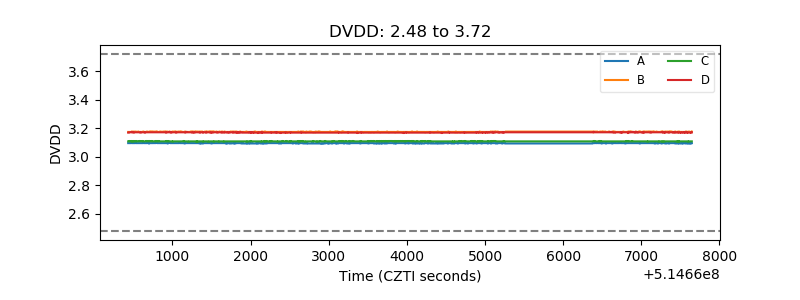 |
| Temperature 1 | 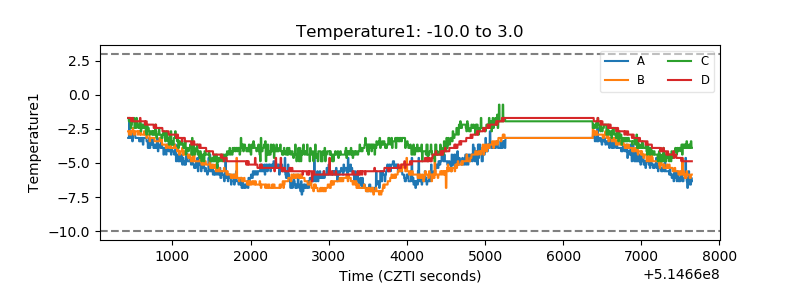 |
| Veto HV Monitor | 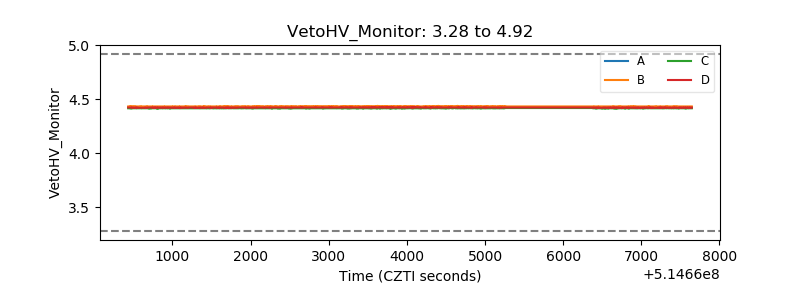 |
| Veto LLD | 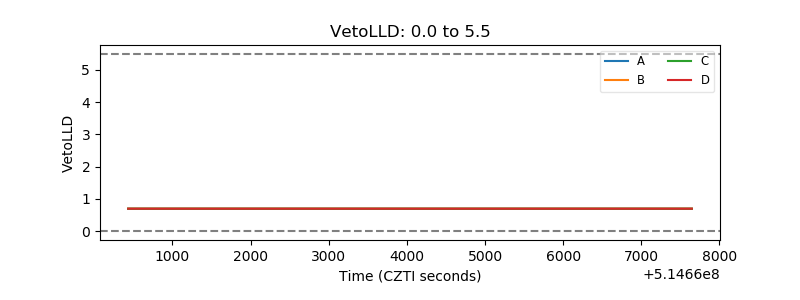 |
| Alpha Counter | 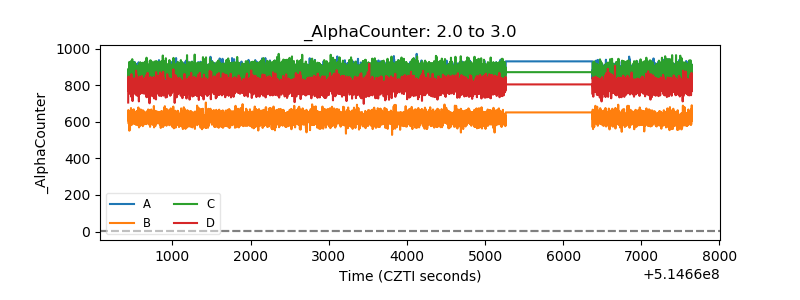 |
| _CPM_Rate | 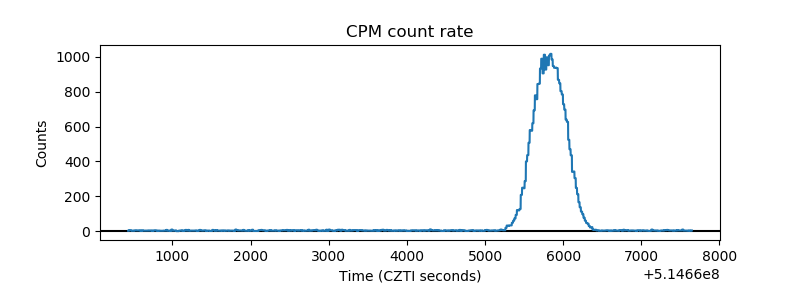 |
| CZT Counter | 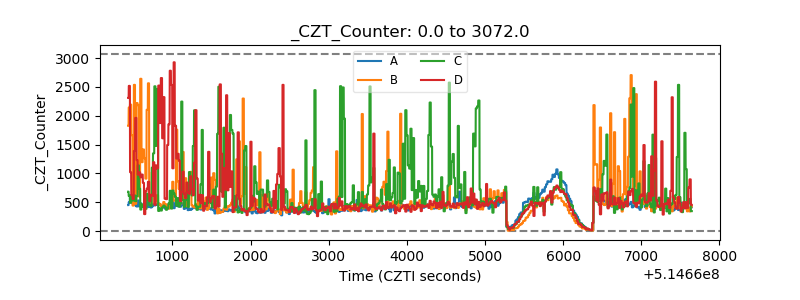 |
| +2.5 Volts monitor |  |
| +5 Volts monitor |  |
| _ROLL_ROT | 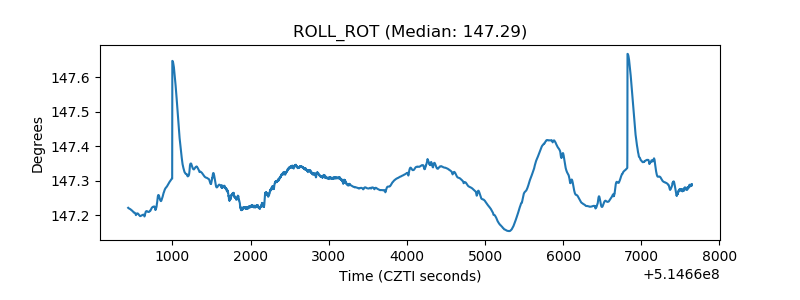 |
| _Roll_DEC | 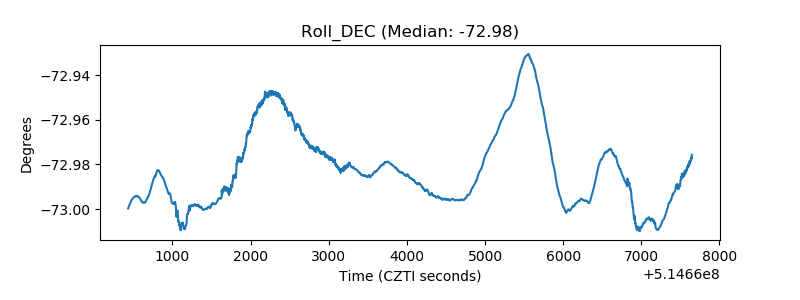 |
| _Roll_RA | 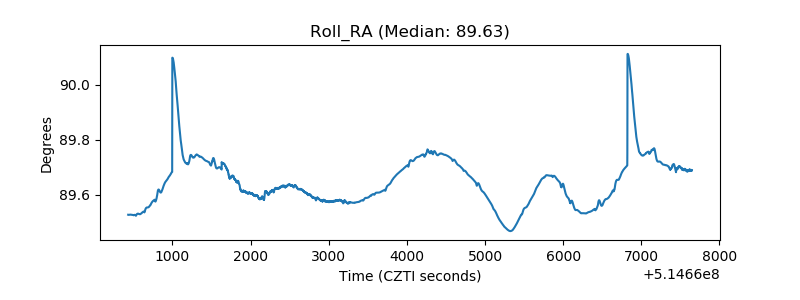 |
| Veto Counter | 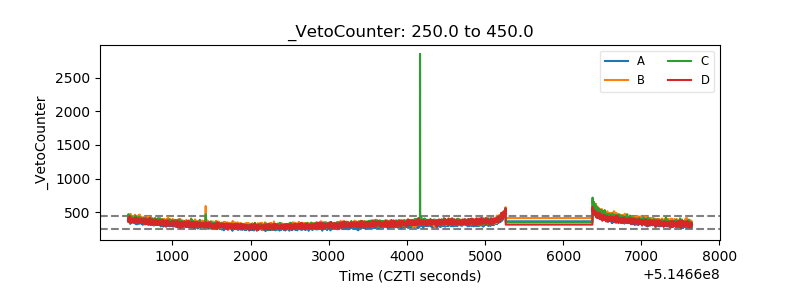 |