| Param | Original file | Final file |
|---|---|---|
| Filename | modeM0/AS1A14_070T08_9000006568_57189cztM0_level2.fits | modeM0/AS1A14_070T08_9000006568_57189cztM0_level2_quad_clean.evt |
| Size (bytes) | 402,528,960 | 93,732,480 |
| Size | 383.9 MB | 89.4 MB |
| Events in quadrant A | 2,743,885 | 631,082 |
| Events in quadrant B | 3,759,465 | 645,447 |
| Events in quadrant C | 4,367,952 | 574,237 |
| Events in quadrant D | 3,540,981 | 550,131 |
| Mode M9 | |||
|---|---|---|---|
| Quadrant | BADHDUFLAG | Total packets | Discarded packets |
| A | 0 | 17 | 0 |
| B | 0 | 18 | 0 |
| C | 0 | 18 | 0 |
| D | 0 | 18 | 0 |
| Mode SS | |||
|---|---|---|---|
| Quadrant | BADHDUFLAG | Total packets | Discarded packets |
| A | 0 | 126 | 0 |
| B | 0 | 126 | 0 |
| C | 0 | 126 | 0 |
| D | 0 | 126 | 0 |
| Mode M0 | |||
|---|---|---|---|
| Quadrant | BADHDUFLAG | Total packets | Discarded packets |
| A | 0 | 12873 | 2 |
| B | 0 | 15600 | 2 |
| C | 0 | 17395 | 2 |
| D | 0 | 15154 | 2 |
| Quadrant | Total seconds | Saturated seconds | Saturation percentage |
|---|---|---|---|
| A | 6272 | 24 | 0.382653% |
| B | 6272 | 342 | 5.452806% |
| C | 6272 | 282 | 4.496173% |
| D | 6272 | 79 | 1.259566% |
Noise dominated data is calculated using 1-second bins in cleaned event files. If a bin has >2000 counts, and if more than 50% of those come from <1% of pixels, then it is considered to be noise-dominated and hence unusable.
| Quadrant | # 1 sec bins | Bins with >0 counts | Bins with >2000 counts | High rate bins dominated by noise | Noise dominated (total time) | Noise dominated (detector-on time) | Marked lightcurve |
|---|---|---|---|---|---|---|---|
| A | 7472 | 6273 | 10 | 10 | 0.13% | 0.16% | 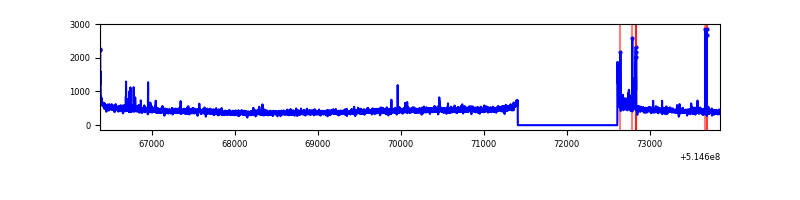 |
| B | 7472 | 6273 | 247 | 247 | 3.31% | 3.94% | 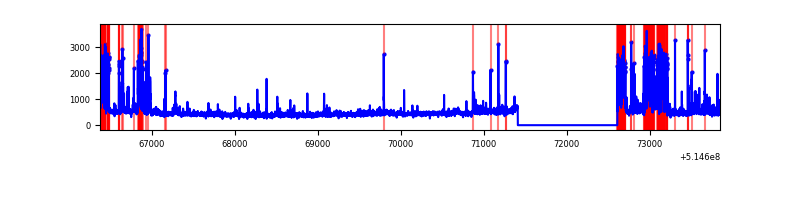 |
| C | 7472 | 6273 | 254 | 254 | 3.40% | 4.05% | 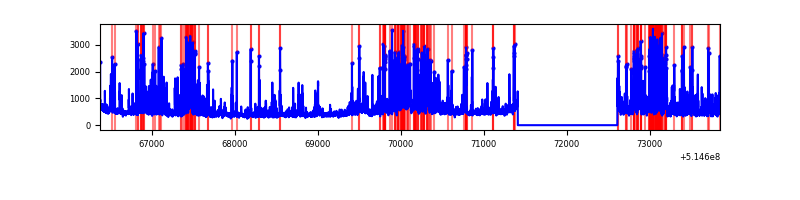 |
| D | 7472 | 6273 | 77 | 77 | 1.03% | 1.23% | 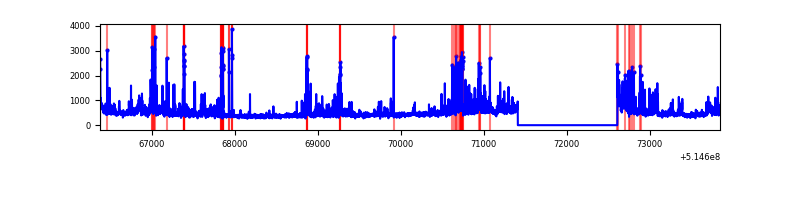 |
Top three noisy pixels from each quadrant. If the there are fewer than three noisy pixels in the level2.evt file, extra rows are filled as -1
| Pixel properties | Quadrant properties | ||||||
|---|---|---|---|---|---|---|---|
| Quadrant | DetID | PixID | Counts | Sigma | Mean | Median | Sigma |
| A | 3 | 14 | 34796 | 204.16 | 676 | 660 | 167.2 |
| A | 13 | 248 | 30798 | 180.24 | 676 | 660 | 167.2 |
| A | 4 | 3 | 25993 | 151.51 | 676 | 660 | 167.2 |
| B | 5 | 185 | 481094 | 3434.77 | 655 | 632 | 139.9 |
| B | 10 | 16 | 389438 | 2779.53 | 655 | 632 | 139.9 |
| B | 0 | 199 | 76220 | 540.37 | 655 | 632 | 139.9 |
| C | 15 | 224 | 1444587 | 8242.37 | 637 | 633 | 175.2 |
| C | 2 | 12 | 126873 | 720.6 | 637 | 633 | 175.2 |
| C | 13 | 16 | 57995 | 327.43 | 637 | 633 | 175.2 |
| D | 12 | 33 | 403790 | 2199.59 | 641 | 611 | 183.3 |
| D | 2 | 249 | 206447 | 1122.96 | 641 | 611 | 183.3 |
| D | 7 | 96 | 156378 | 849.8 | 641 | 611 | 183.3 |
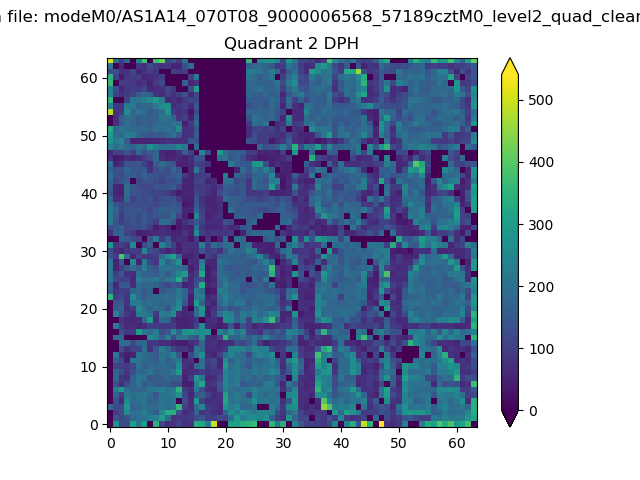
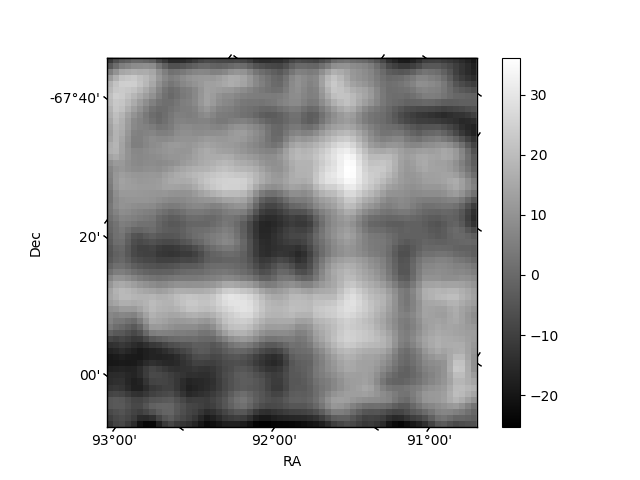
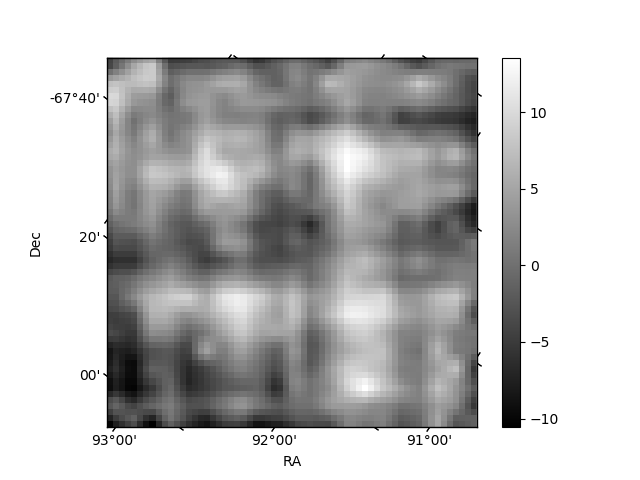
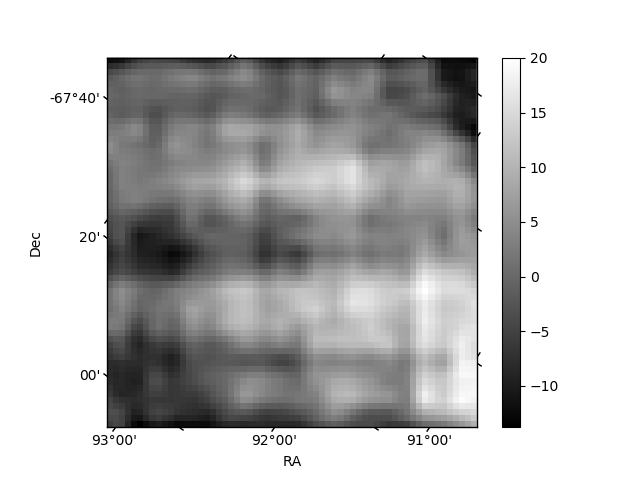
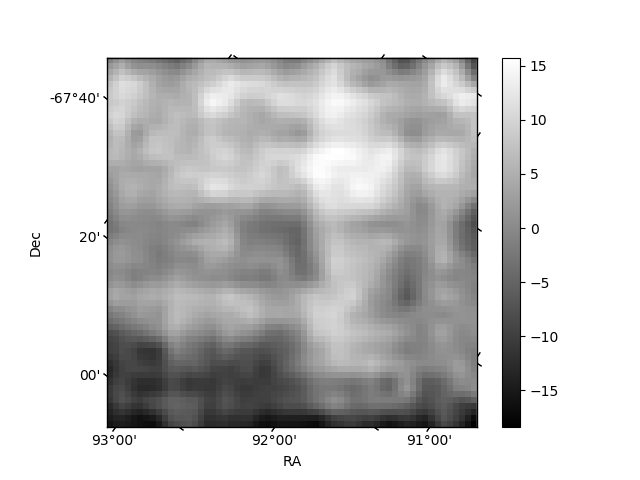
Histogram calculated using DETX and DETY for each event in the final _common_clean file
| Quadrant A | 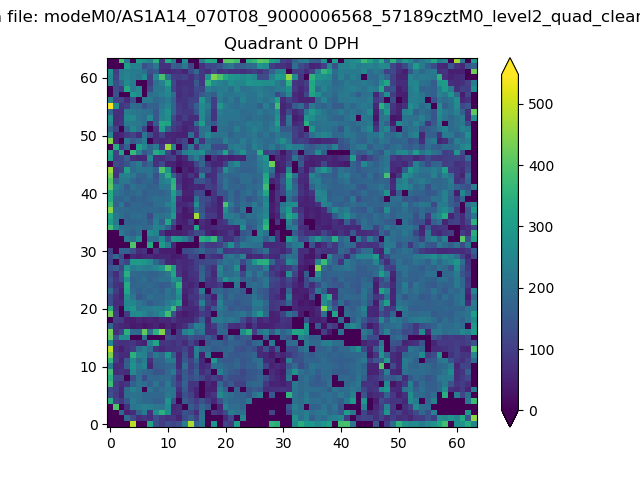 |
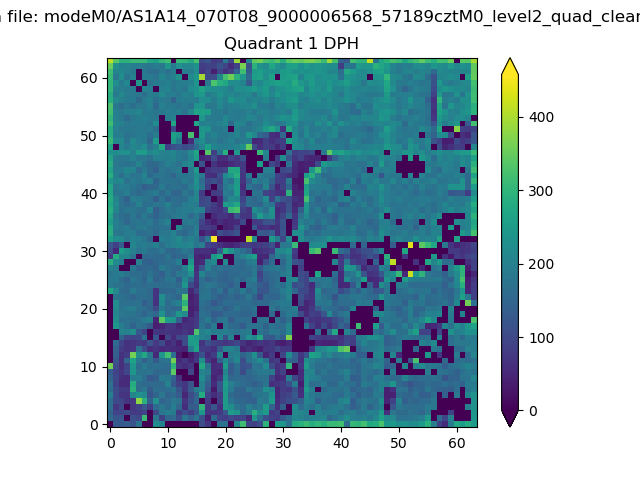 |
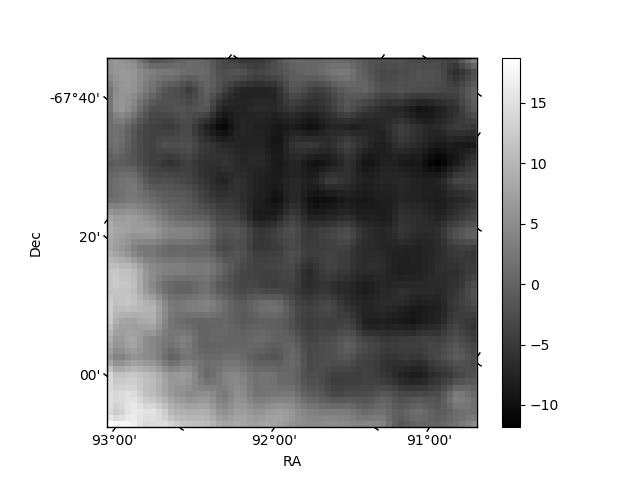
Quadrant B |
|---|---|---|---|
| Quadrant D | 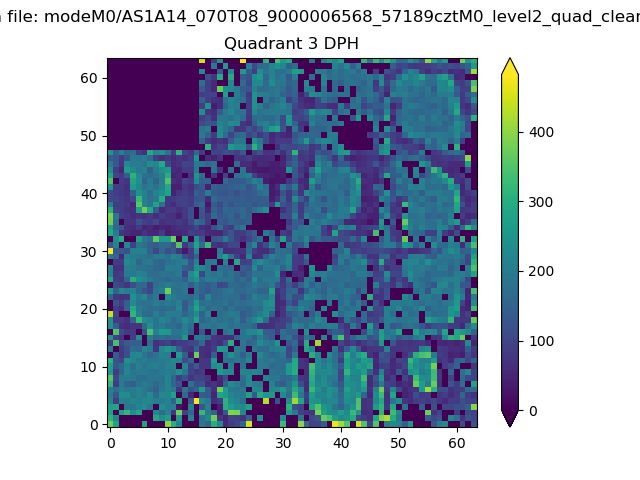 |
 |
Quadrant C |
| Plot type | Count rate plots | Images |
|---|---|---|
| Comparison with Poisson distribution Blue bars denote a histogram of data divided into 1 sec bins. Red curve is a Poisson curve with rate = median count rate of data. |
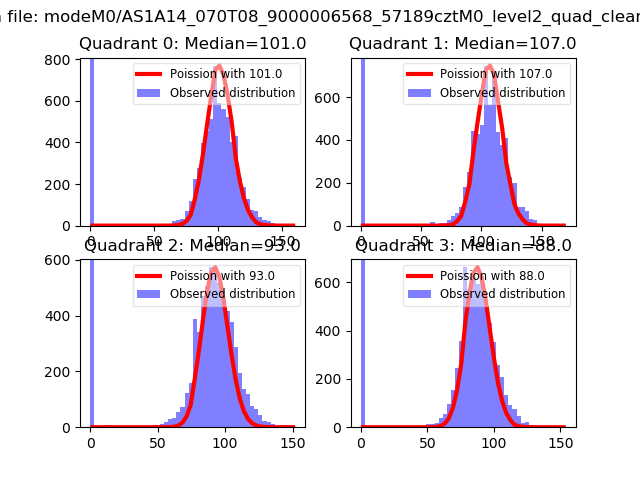 |
 |
| Quadrant-wise count rates Data is divided into 100 sec bins |
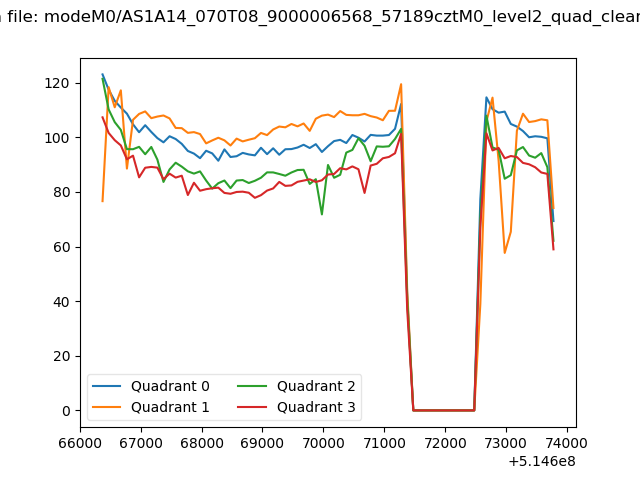 |
|
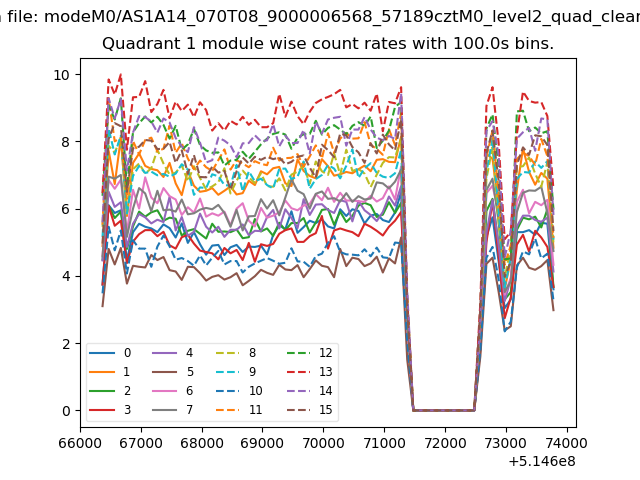
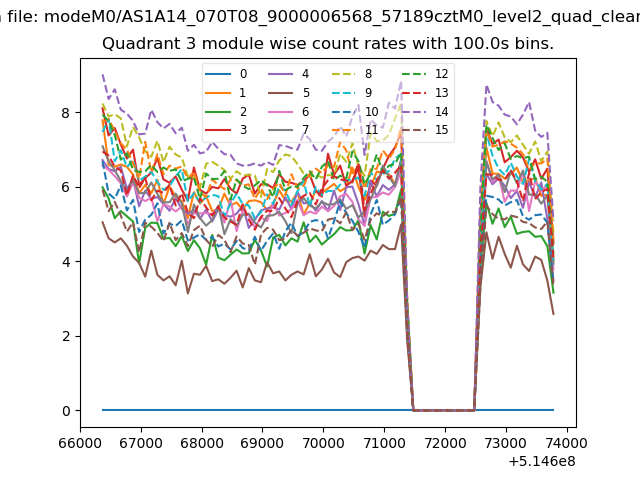
| Module-wise count rates for Quadrant A Data is divided into 100 sec bins |
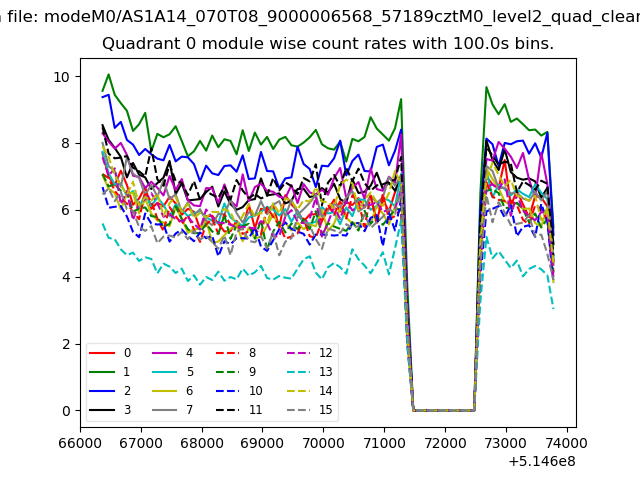 |
 |
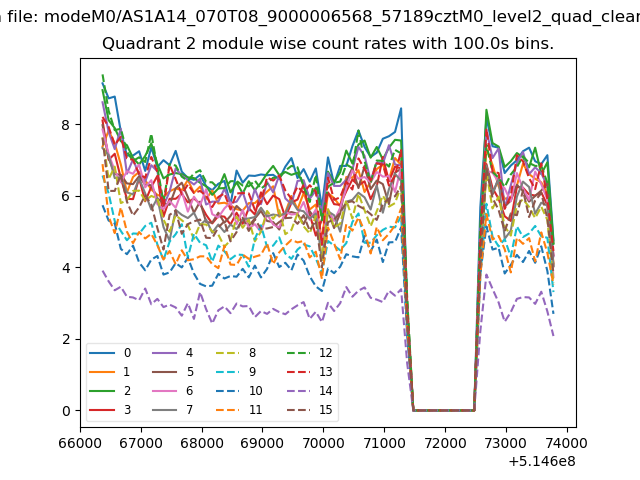
| Module-wise count rates for Quadrant B Data is divided into 100 sec bins |
 |
 |
| Module-wise count rates for Quadrant C Data is divided into 100 sec bins |
 |
 |
| Module-wise count rates for Quadrant D Data is divided into 100 sec bins |
 |
 |
| Parameter | Plot |
|---|---|
| CZT HV Monitor | 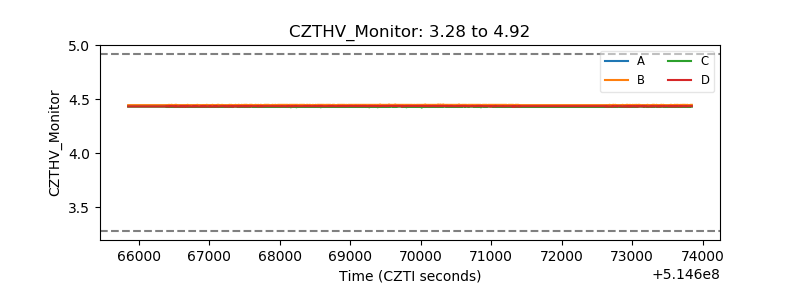 |
| D_VDD | 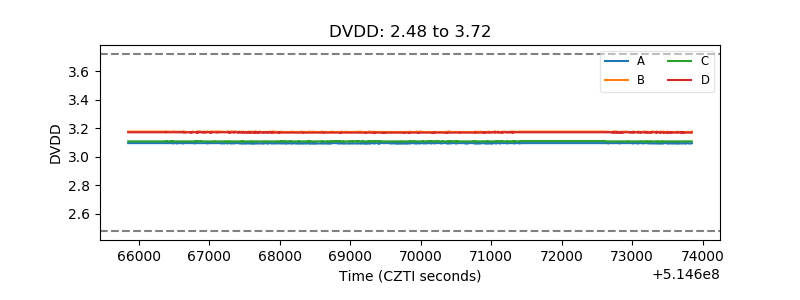 |
| Temperature 1 | 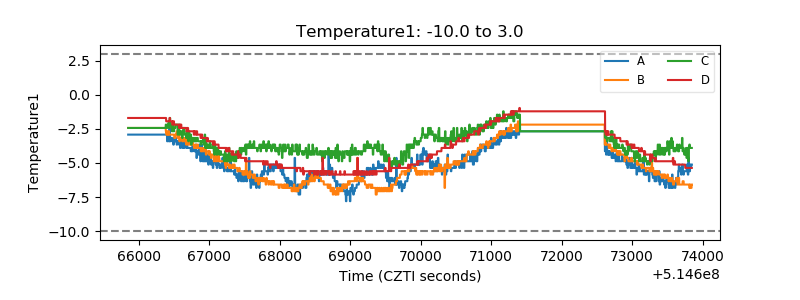 |
| Veto HV Monitor | 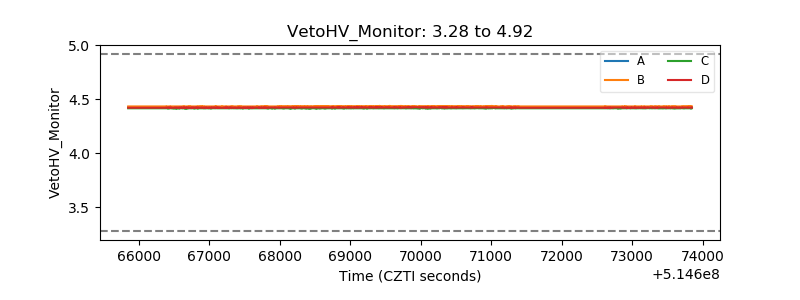 |
| Veto LLD | 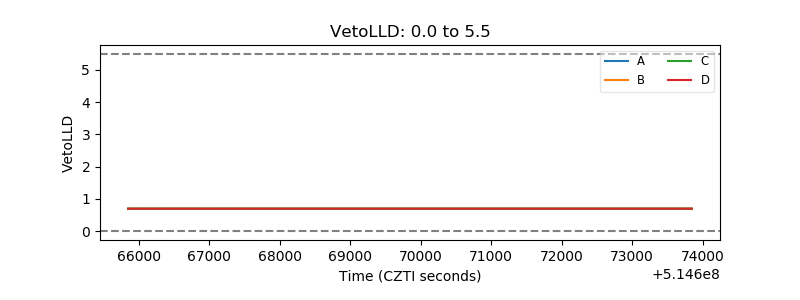 |
| Alpha Counter | 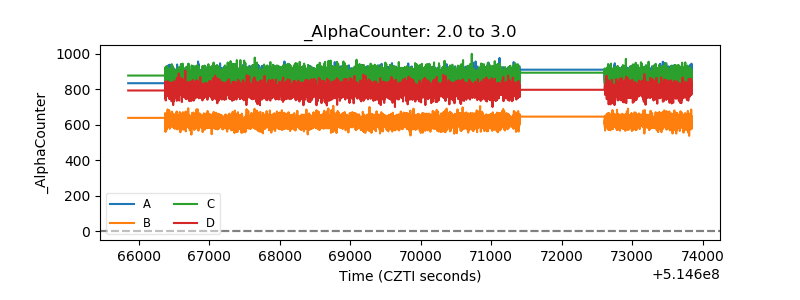 |
| _CPM_Rate | 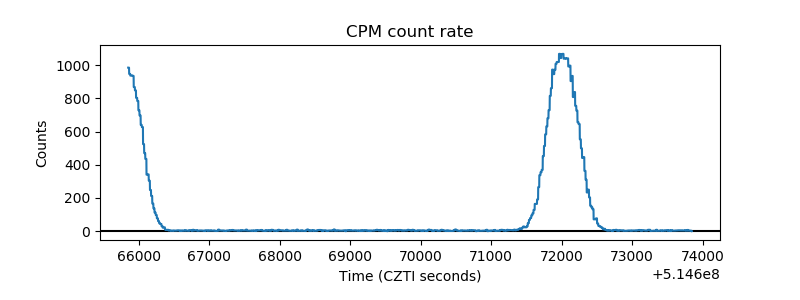 |
| CZT Counter | 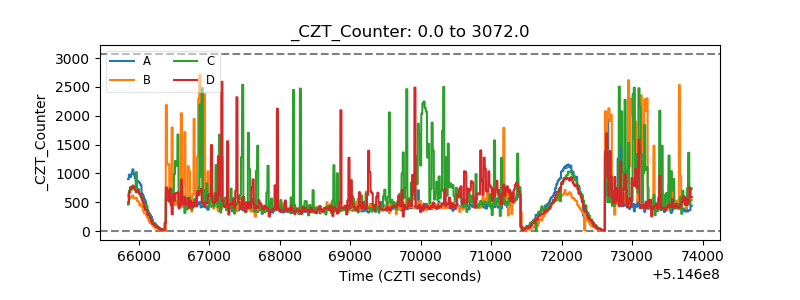 |
| +2.5 Volts monitor |  |
| +5 Volts monitor | 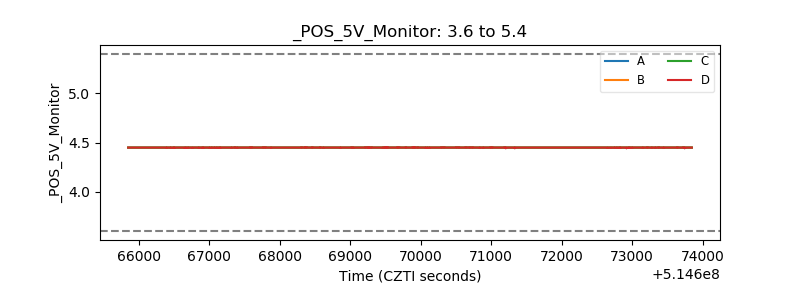 |
| _ROLL_ROT | 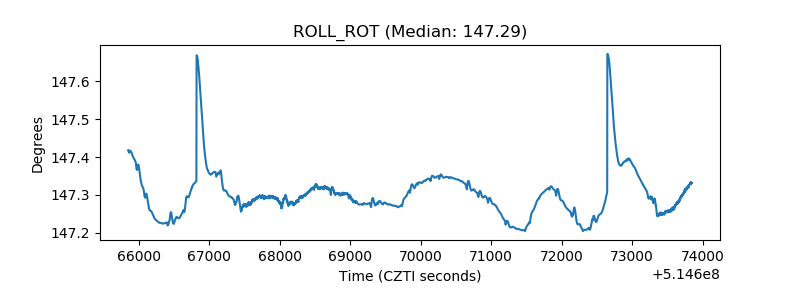 |
| _Roll_DEC | 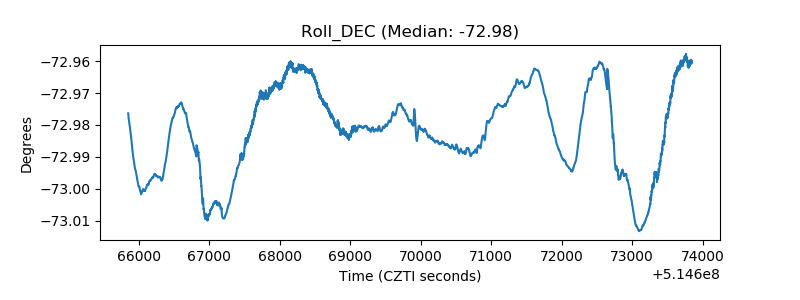 |
| _Roll_RA | 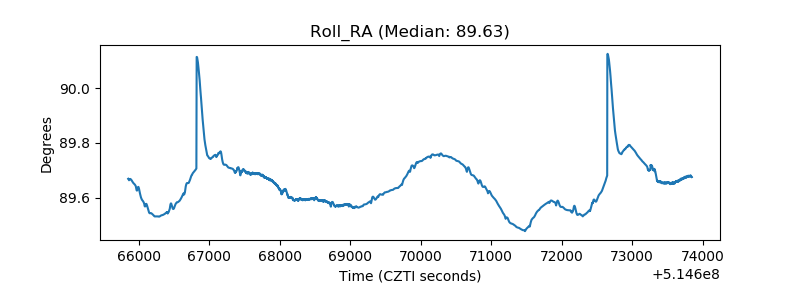 |
| Veto Counter | 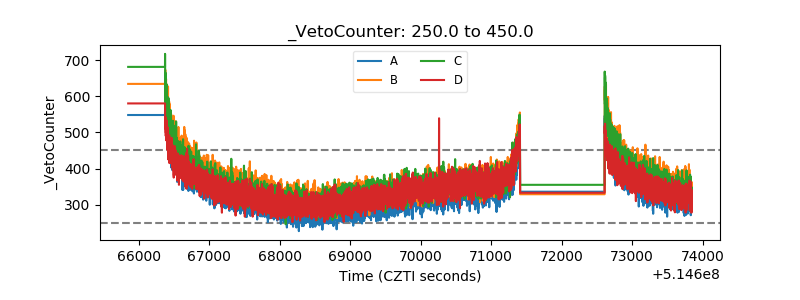 |