| Param | Original file | Final file |
|---|---|---|
| Filename | modeM0/AS1A14_070T08_9000006568_57190cztM0_level2.fits | modeM0/AS1A14_070T08_9000006568_57190cztM0_level2_quad_clean.evt |
| Size (bytes) | 435,539,520 | 85,815,360 |
| Size | 415.4 MB | 81.8 MB |
| Events in quadrant A | 2,728,871 | 574,053 |
| Events in quadrant B | 4,628,013 | 570,640 |
| Events in quadrant C | 4,612,002 | 518,247 |
| Events in quadrant D | 3,665,972 | 498,098 |
| Mode M9 | |||
|---|---|---|---|
| Quadrant | BADHDUFLAG | Total packets | Discarded packets |
| A | 0 | 14 | 0 |
| B | 0 | 15 | 0 |
| C | 0 | 15 | 0 |
| D | 0 | 15 | 0 |
| Mode SS | |||
|---|---|---|---|
| Quadrant | BADHDUFLAG | Total packets | Discarded packets |
| A | 0 | 128 | 0 |
| B | 0 | 128 | 0 |
| C | 0 | 128 | 0 |
| D | 0 | 128 | 0 |
| Mode M0 | |||
|---|---|---|---|
| Quadrant | BADHDUFLAG | Total packets | Discarded packets |
| A | 0 | 12903 | 2 |
| B | 0 | 18004 | 2 |
| C | 0 | 18117 | 2 |
| D | 0 | 15546 | 2 |
| Quadrant | Total seconds | Saturated seconds | Saturation percentage |
|---|---|---|---|
| A | 6263 | 27 | 0.431103% |
| B | 6263 | 692 | 11.049018% |
| C | 6263 | 318 | 5.077439% |
| D | 6262 | 132 | 2.107953% |
Noise dominated data is calculated using 1-second bins in cleaned event files. If a bin has >2000 counts, and if more than 50% of those come from <1% of pixels, then it is considered to be noise-dominated and hence unusable.
| Quadrant | # 1 sec bins | Bins with >0 counts | Bins with >2000 counts | High rate bins dominated by noise | Noise dominated (total time) | Noise dominated (detector-on time) | Marked lightcurve |
|---|---|---|---|---|---|---|---|
| A | 7738 | 6549 | 11 | 11 | 0.14% | 0.17% | 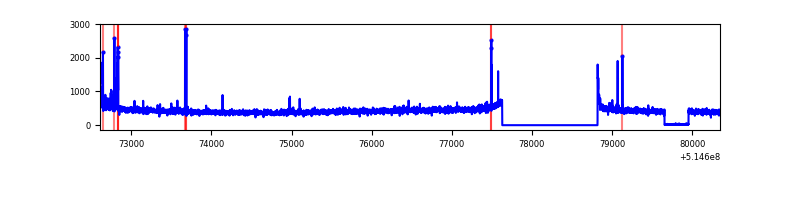 |
| B | 7738 | 6549 | 511 | 511 | 6.60% | 7.80% | 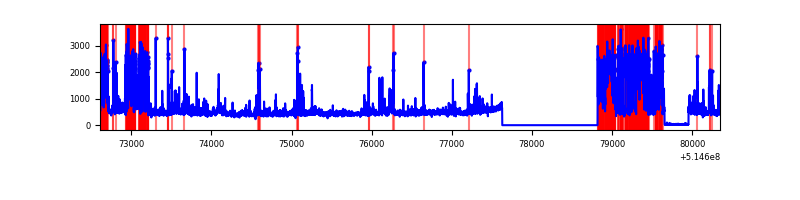 |
| C | 7738 | 6549 | 281 | 281 | 3.63% | 4.29% | 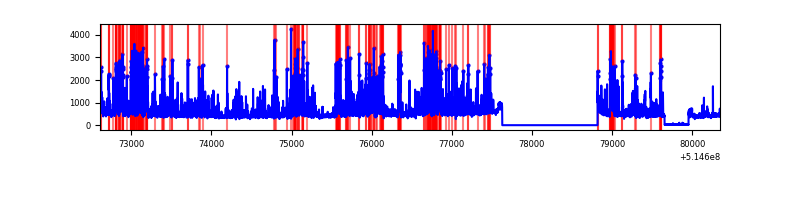 |
| D | 7737 | 6548 | 126 | 126 | 1.63% | 1.92% | 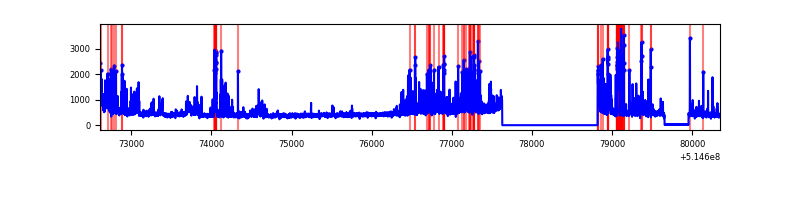 |
Top three noisy pixels from each quadrant. If the there are fewer than three noisy pixels in the level2.evt file, extra rows are filled as -1
| Pixel properties | Quadrant properties | ||||||
|---|---|---|---|---|---|---|---|
| Quadrant | DetID | PixID | Counts | Sigma | Mean | Median | Sigma |
| A | 13 | 248 | 42039 | 247.78 | 672 | 657 | 167.0 |
| A | 3 | 14 | 34275 | 201.3 | 672 | 657 | 167.0 |
| A | 4 | 3 | 20402 | 118.23 | 672 | 657 | 167.0 |
| B | 5 | 185 | 1394543 | 10203.86 | 636 | 615 | 136.6 |
| B | 10 | 16 | 396226 | 2895.96 | 636 | 615 | 136.6 |
| B | 0 | 199 | 122672 | 893.48 | 636 | 615 | 136.6 |
| C | 15 | 224 | 1628432 | 9401.1 | 636 | 631 | 173.1 |
| C | 2 | 12 | 300144 | 1729.79 | 636 | 631 | 173.1 |
| C | 14 | 67 | 64268 | 367.53 | 636 | 631 | 173.1 |
| D | 12 | 33 | 410006 | 2243.97 | 638 | 609 | 182.4 |
| D | 7 | 96 | 303891 | 1662.33 | 638 | 609 | 182.4 |
| D | 2 | 249 | 184170 | 1006.13 | 638 | 609 | 182.4 |
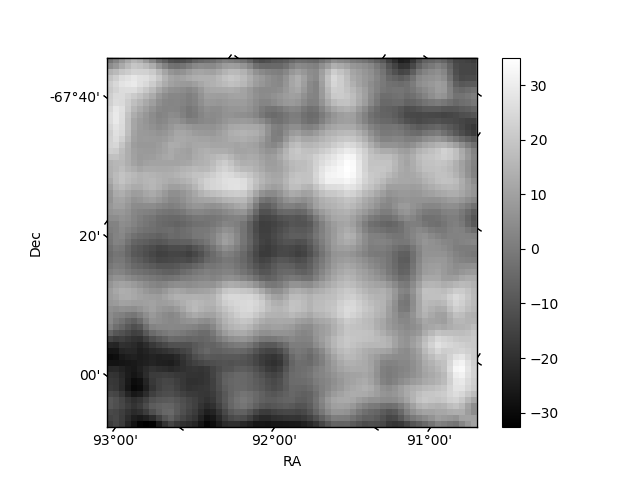
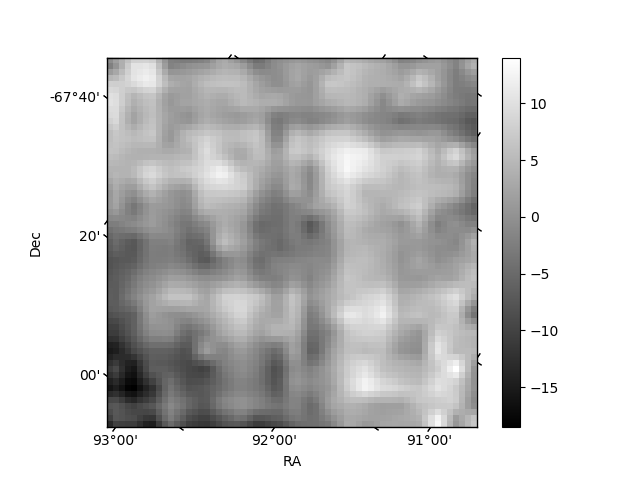
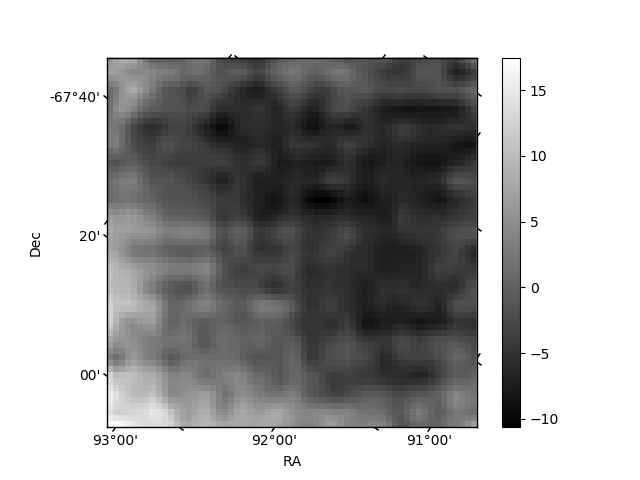
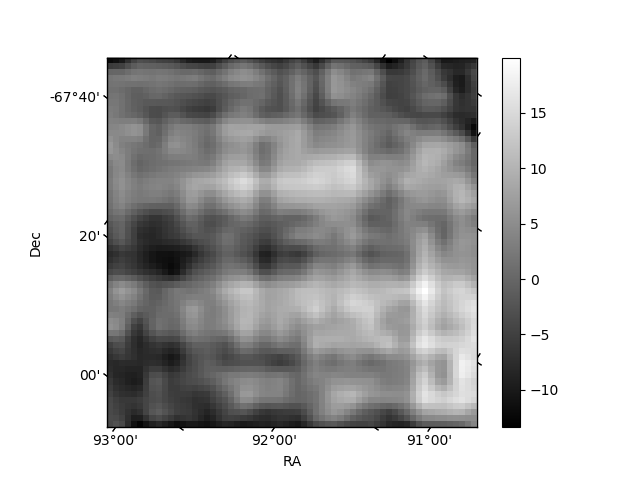
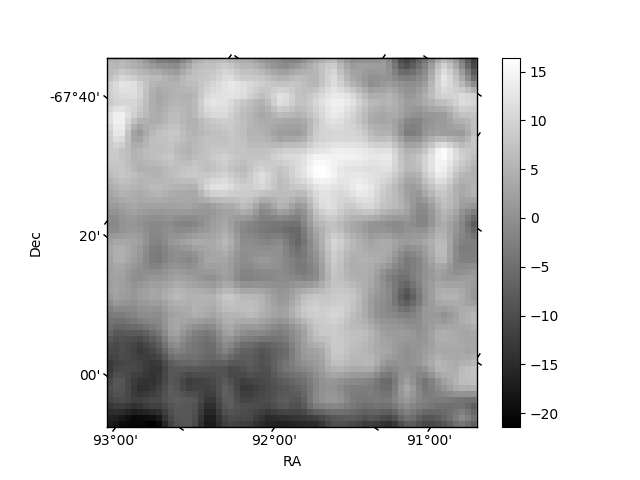
Histogram calculated using DETX and DETY for each event in the final _common_clean file
| Quadrant A | 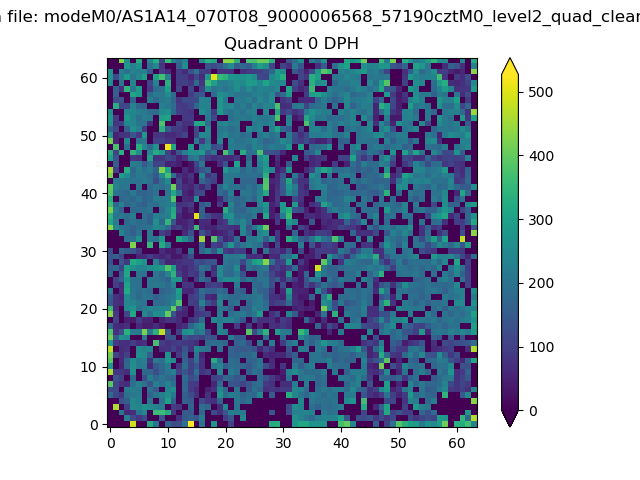 |
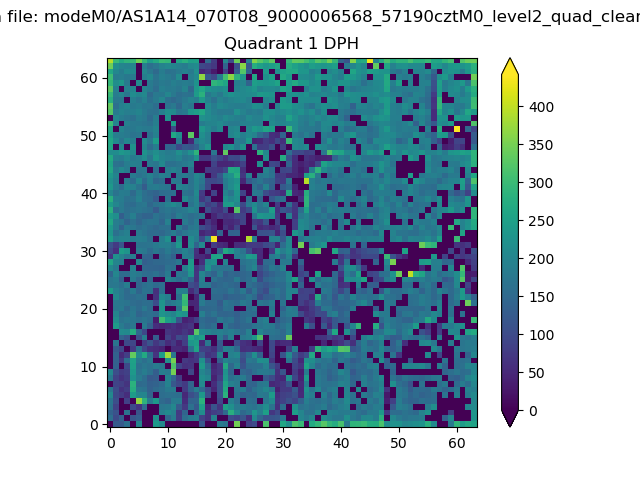 |
Quadrant B |
|---|---|---|---|
| Quadrant D | 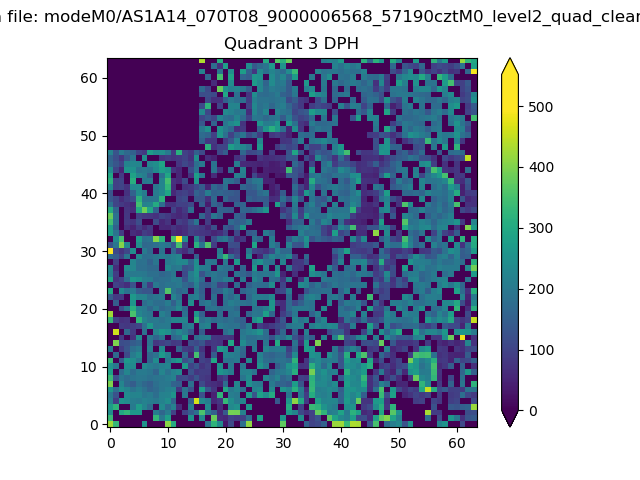 |
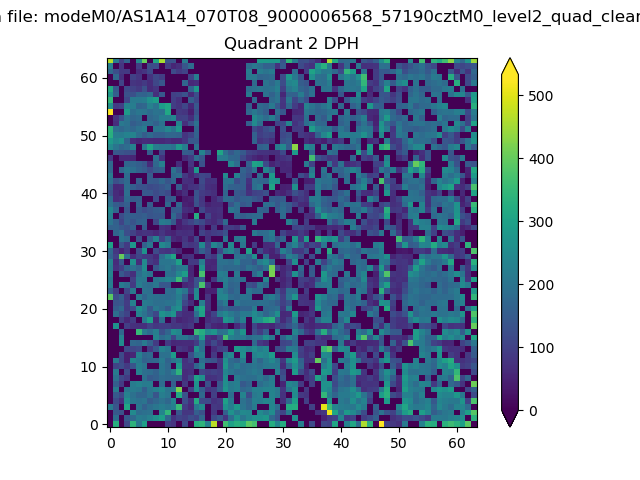 |
Quadrant C |
| Plot type | Count rate plots | Images |
|---|---|---|
| Comparison with Poisson distribution Blue bars denote a histogram of data divided into 1 sec bins. Red curve is a Poisson curve with rate = median count rate of data. |
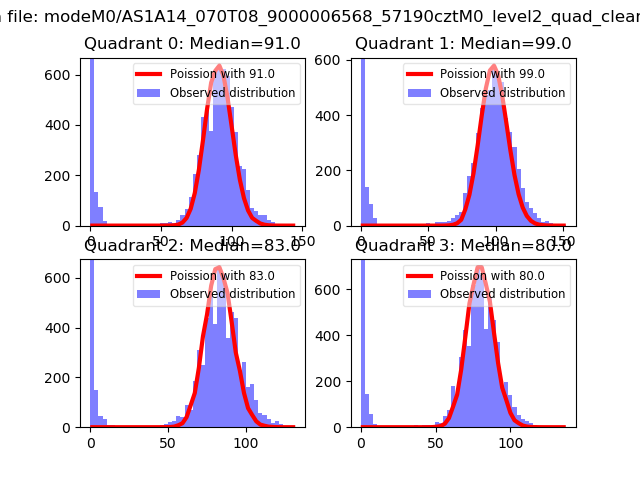 |
 |
| Quadrant-wise count rates Data is divided into 100 sec bins |
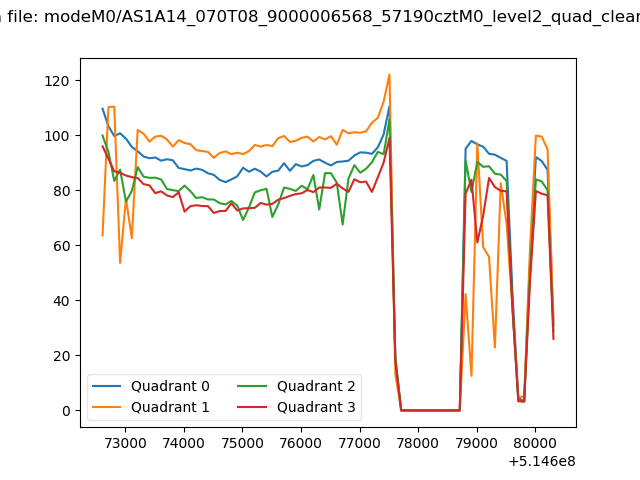 |
|
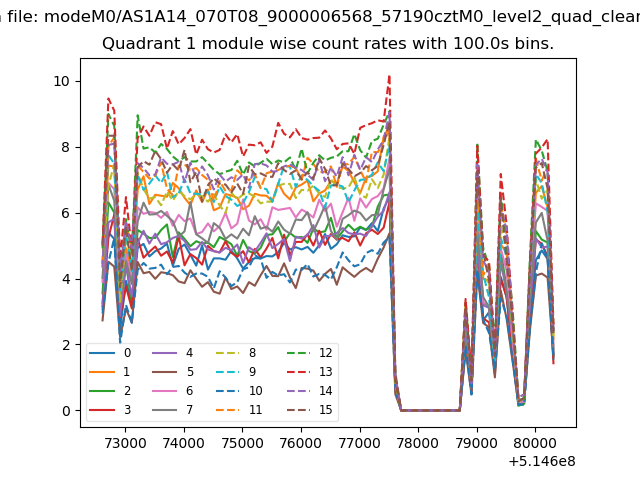
| Module-wise count rates for Quadrant A Data is divided into 100 sec bins |
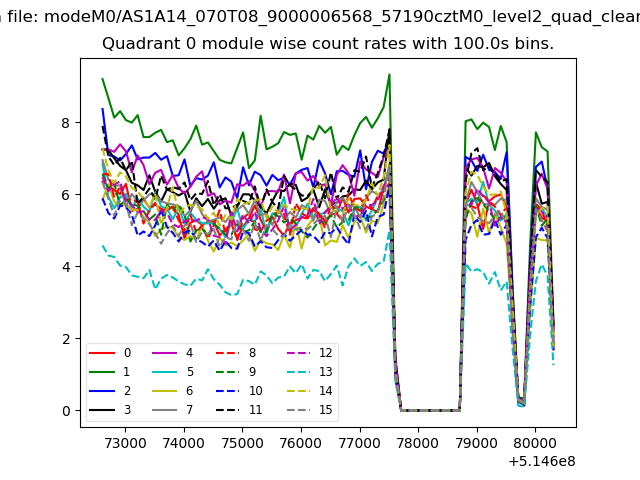 |
 |
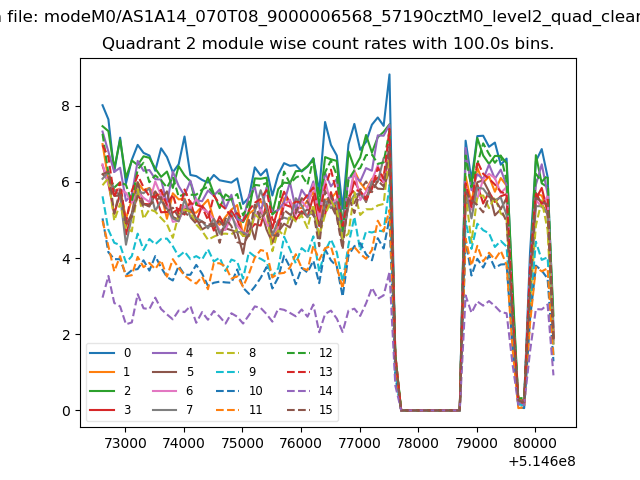
| Module-wise count rates for Quadrant B Data is divided into 100 sec bins |
 |
 |
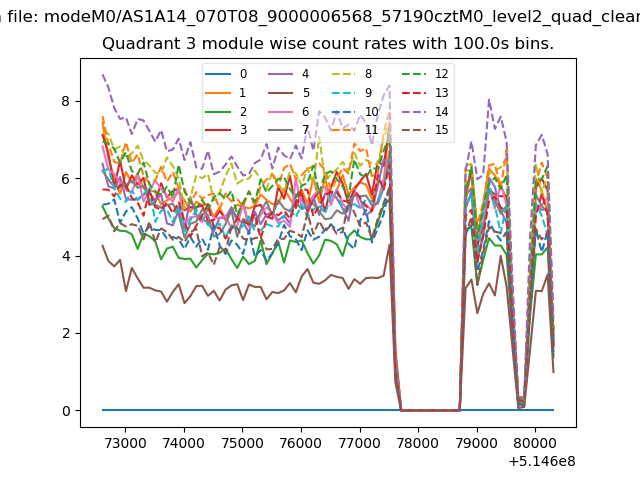
| Module-wise count rates for Quadrant C Data is divided into 100 sec bins |
 |
 |
| Module-wise count rates for Quadrant D Data is divided into 100 sec bins |
 |
 |
| Parameter | Plot |
|---|---|
| CZT HV Monitor | 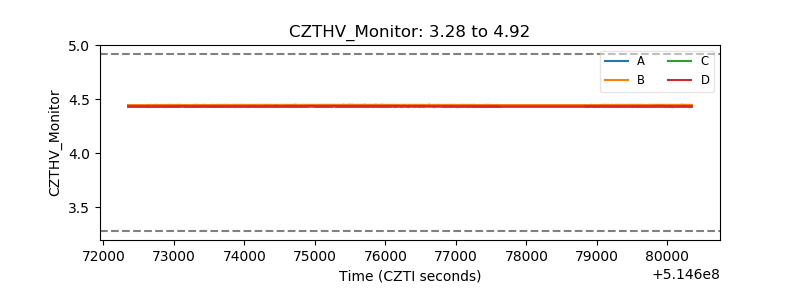 |
| D_VDD | 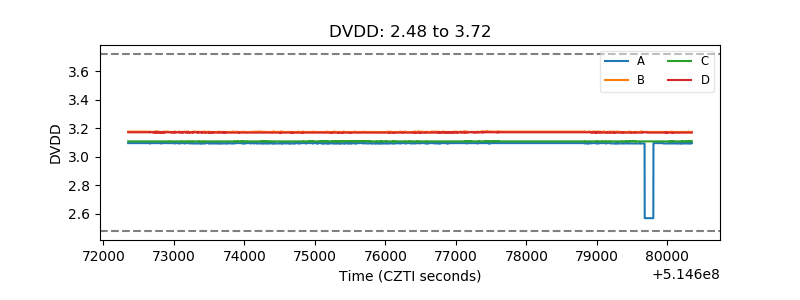 |
| Temperature 1 | 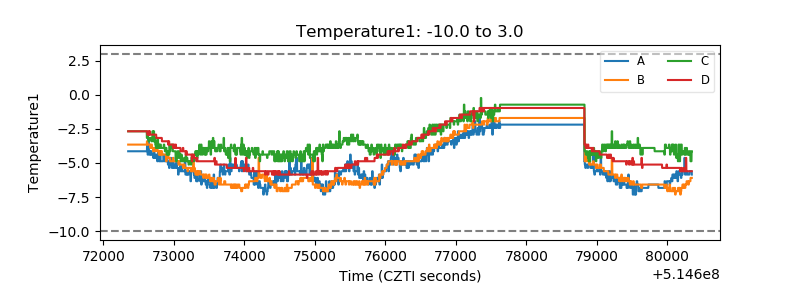 |
| Veto HV Monitor | 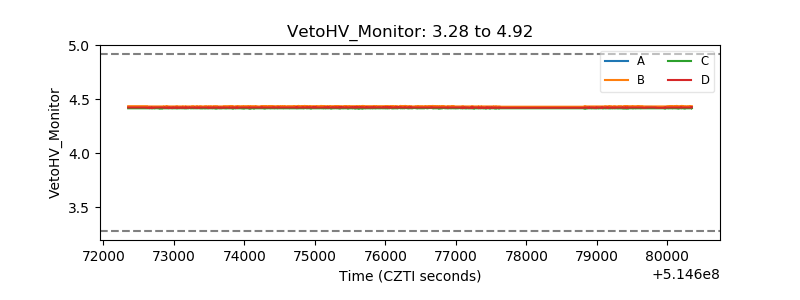 |
| Veto LLD | 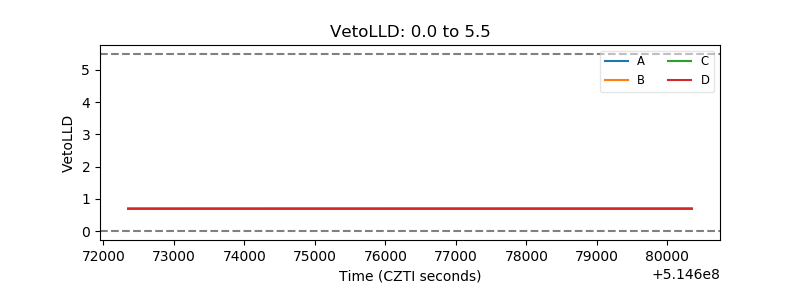 |
| Alpha Counter | 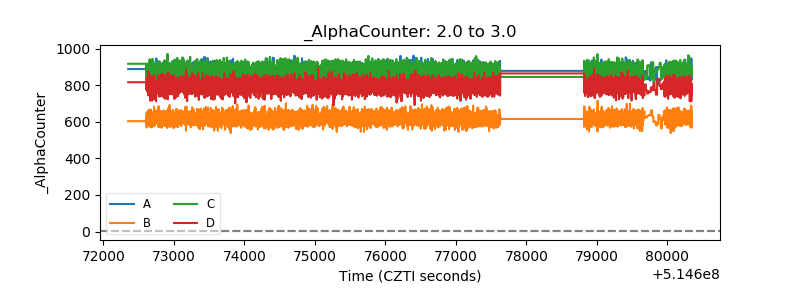 |
| _CPM_Rate | 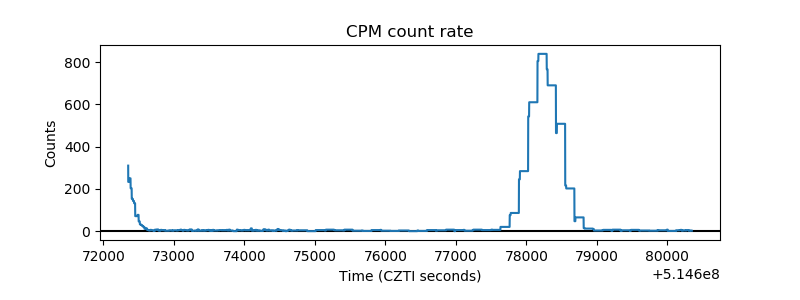 |
| CZT Counter | 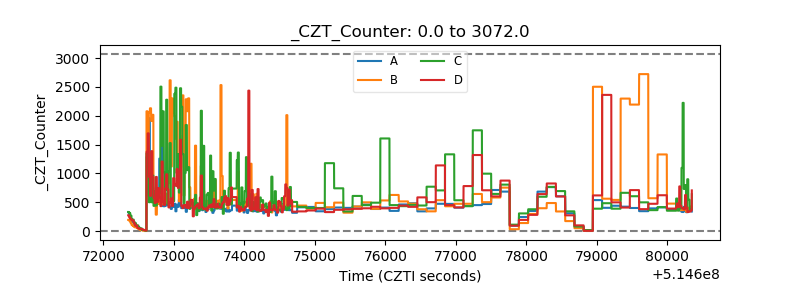 |
| +2.5 Volts monitor | 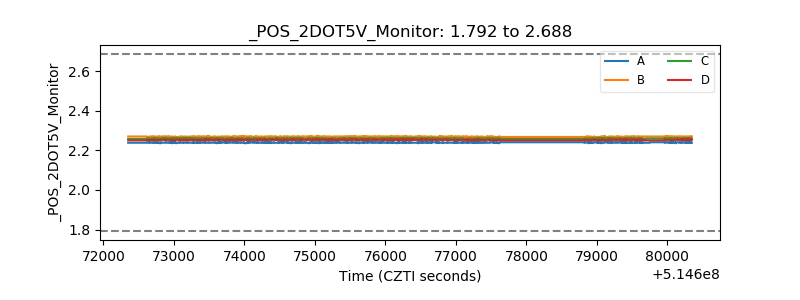 |
| +5 Volts monitor |  |
| _ROLL_ROT | 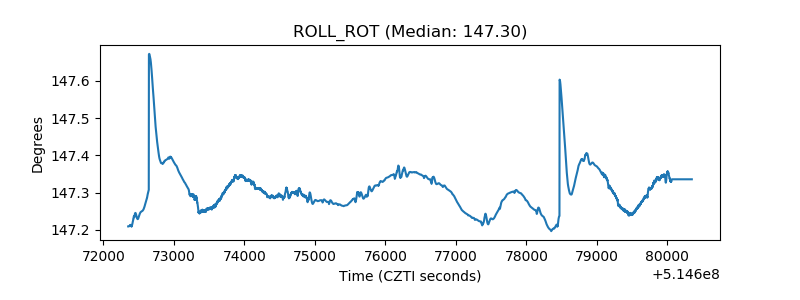 |
| _Roll_DEC | 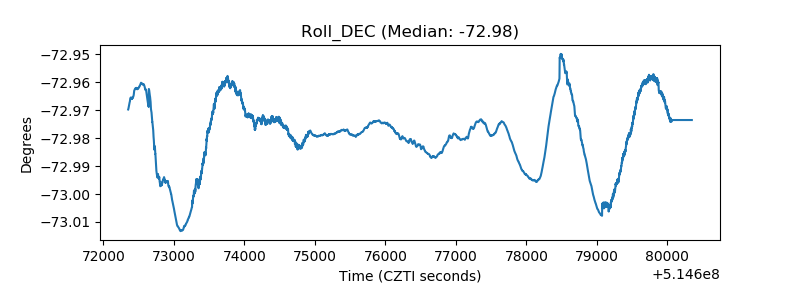 |
| _Roll_RA | 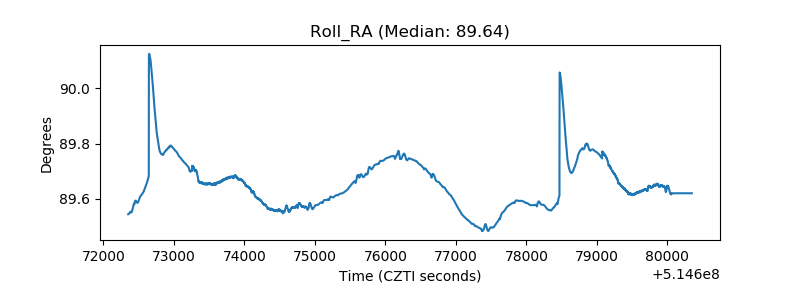 |
| Veto Counter | 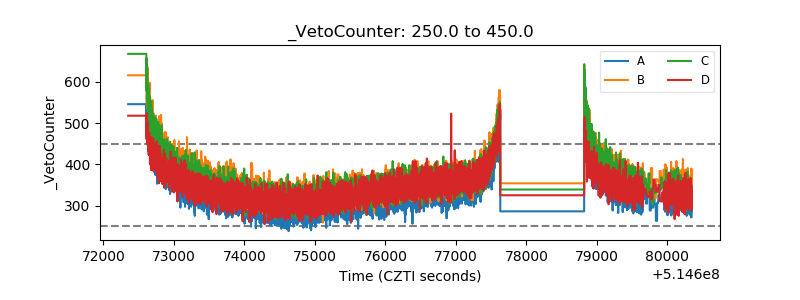 |