| Param | Original file | Final file |
|---|---|---|
| Filename | modeM0/AS1A14_070T08_9000006568_57191cztM0_level2.fits | modeM0/AS1A14_070T08_9000006568_57191cztM0_level2_quad_clean.evt |
| Size (bytes) | 450,204,480 | 85,916,160 |
| Size | 429.3 MB | 81.9 MB |
| Events in quadrant A | 2,829,797 | 568,242 |
| Events in quadrant B | 4,378,056 | 573,685 |
| Events in quadrant C | 5,084,778 | 507,243 |
| Events in quadrant D | 3,864,024 | 496,169 |
| Mode M9 | |||
|---|---|---|---|
| Quadrant | BADHDUFLAG | Total packets | Discarded packets |
| A | 0 | 23 | 0 |
| B | 0 | 23 | 0 |
| C | 0 | 23 | 0 |
| D | 0 | 23 | 0 |
| Mode SS | |||
|---|---|---|---|
| Quadrant | BADHDUFLAG | Total packets | Discarded packets |
| A | 0 | 136 | 0 |
| B | 0 | 136 | 0 |
| C | 0 | 136 | 0 |
| D | 0 | 136 | 0 |
| Mode M0 | |||
|---|---|---|---|
| Quadrant | BADHDUFLAG | Total packets | Discarded packets |
| A | 0 | 13448 | 2 |
| B | 0 | 17630 | 2 |
| C | 0 | 19623 | 2 |
| D | 0 | 16111 | 2 |
| Quadrant | Total seconds | Saturated seconds | Saturation percentage |
|---|---|---|---|
| A | 6534 | 41 | 0.627487% |
| B | 6533 | 608 | 9.306597% |
| C | 6533 | 555 | 8.495331% |
| D | 6534 | 139 | 2.127334% |
Noise dominated data is calculated using 1-second bins in cleaned event files. If a bin has >2000 counts, and if more than 50% of those come from <1% of pixels, then it is considered to be noise-dominated and hence unusable.
| Quadrant | # 1 sec bins | Bins with >0 counts | Bins with >2000 counts | High rate bins dominated by noise | Noise dominated (total time) | Noise dominated (detector-on time) | Marked lightcurve |
|---|---|---|---|---|---|---|---|
| A | 9136 | 6818 | 23 | 23 | 0.25% | 0.34% | 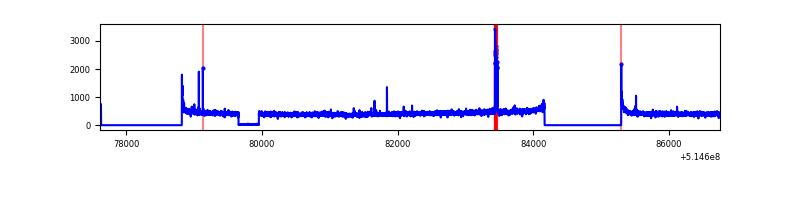 |
| B | 9135 | 6817 | 428 | 428 | 4.69% | 6.28% | 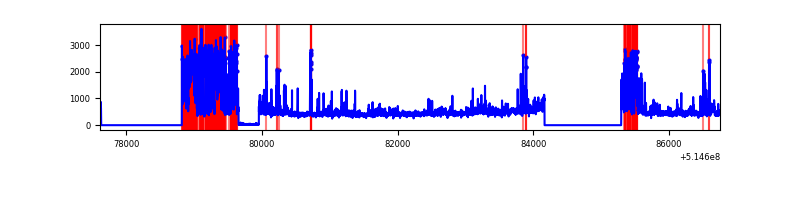 |
| C | 9135 | 6816 | 487 | 487 | 5.33% | 7.14% | 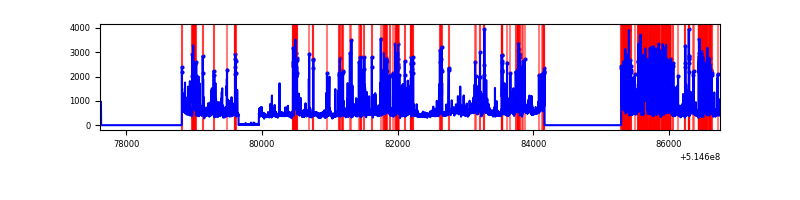 |
| D | 9136 | 6818 | 123 | 123 | 1.35% | 1.80% | 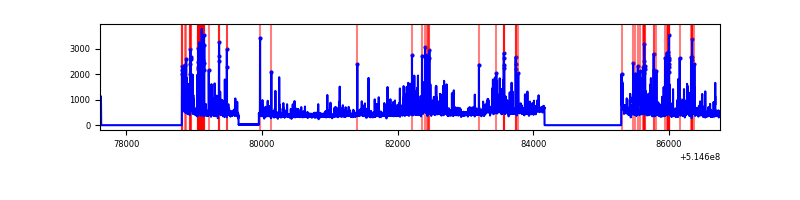 |
Top three noisy pixels from each quadrant. If the there are fewer than three noisy pixels in the level2.evt file, extra rows are filled as -1
| Pixel properties | Quadrant properties | ||||||
|---|---|---|---|---|---|---|---|
| Quadrant | DetID | PixID | Counts | Sigma | Mean | Median | Sigma |
| A | 13 | 248 | 61958 | 355.26 | 693 | 677 | 172.5 |
| A | 3 | 14 | 40501 | 230.87 | 693 | 677 | 172.5 |
| A | 4 | 3 | 20754 | 116.39 | 693 | 677 | 172.5 |
| B | 5 | 185 | 824504 | 5853.08 | 660 | 635 | 140.8 |
| B | 10 | 16 | 538659 | 3822.33 | 660 | 635 | 140.8 |
| B | 0 | 155 | 91398 | 644.82 | 660 | 635 | 140.8 |
| C | 15 | 224 | 1437683 | 8132.5 | 647 | 640 | 176.7 |
| C | 12 | 252 | 735968 | 4161.36 | 647 | 640 | 176.7 |
| C | 14 | 67 | 172185 | 970.81 | 647 | 640 | 176.7 |
| D | 12 | 33 | 625791 | 3329.48 | 662 | 632 | 187.8 |
| D | 7 | 96 | 190706 | 1012.3 | 662 | 632 | 187.8 |
| D | 8 | 240 | 141343 | 749.4 | 662 | 632 | 187.8 |
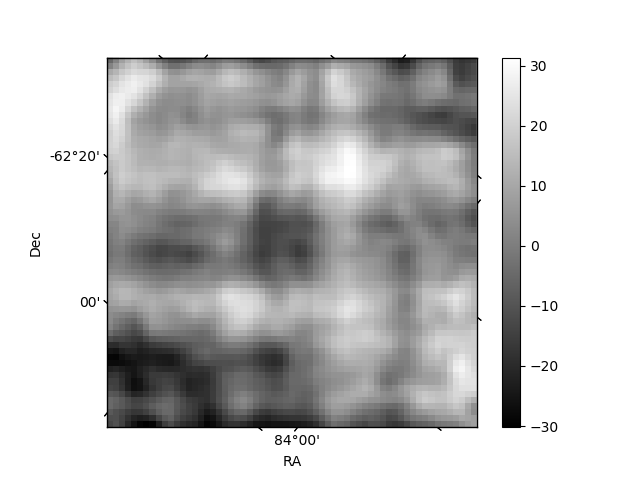
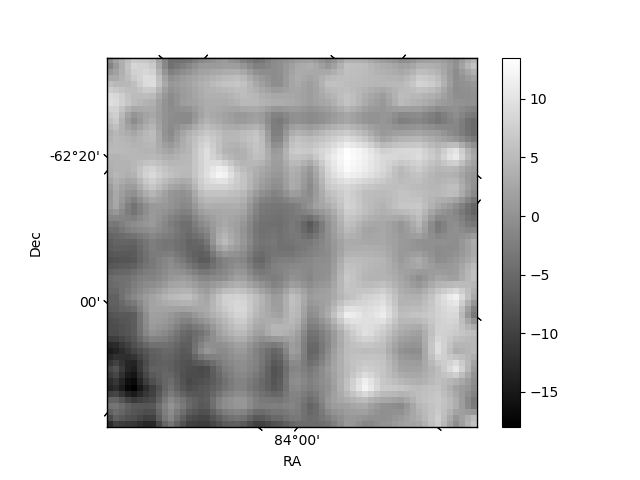
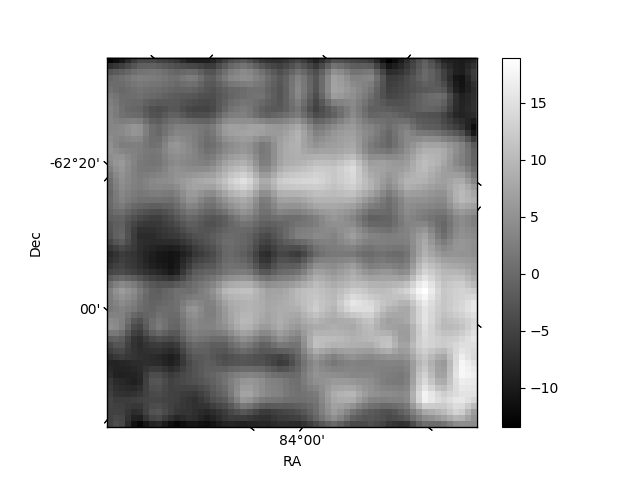
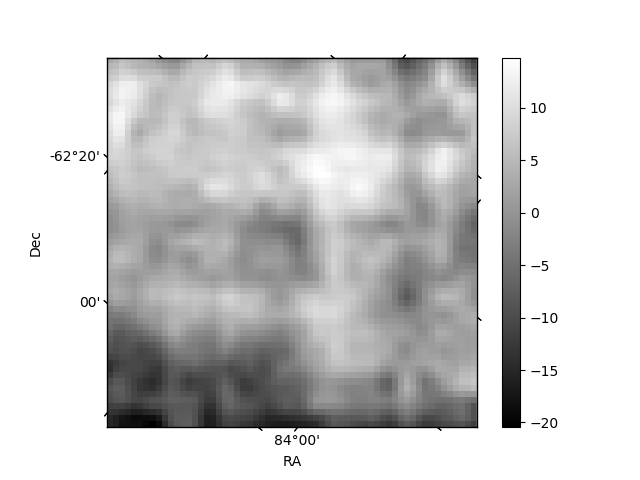
Histogram calculated using DETX and DETY for each event in the final _common_clean file
| Quadrant A | 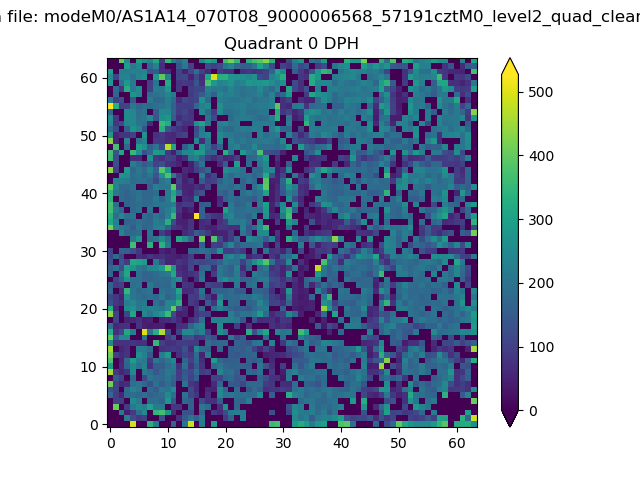 |
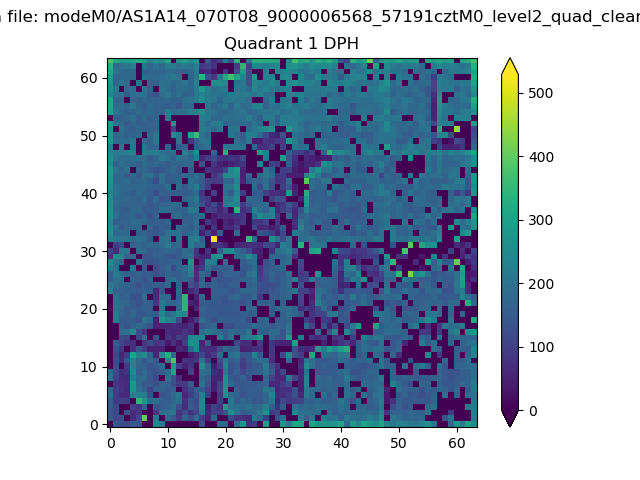 |
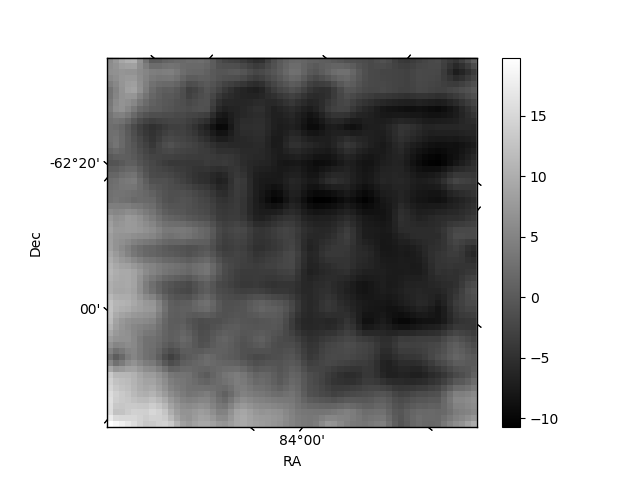
Quadrant B |
|---|---|---|---|
| Quadrant D | 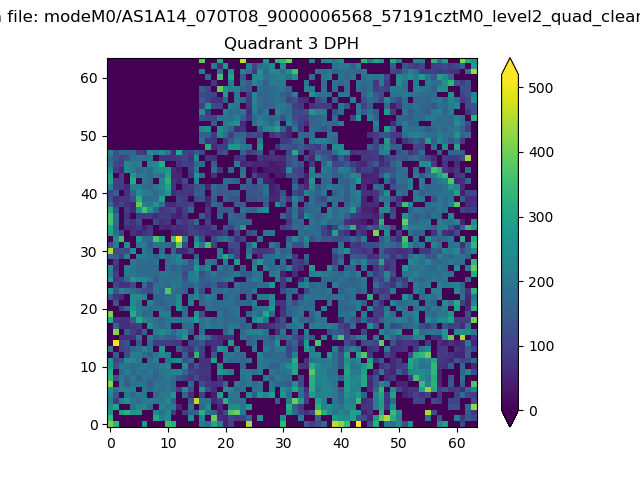 |
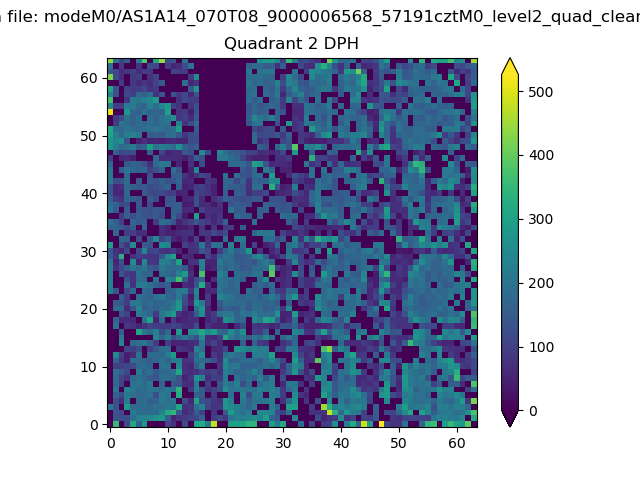 |
Quadrant C |
| Plot type | Count rate plots | Images |
|---|---|---|
| Comparison with Poisson distribution Blue bars denote a histogram of data divided into 1 sec bins. Red curve is a Poisson curve with rate = median count rate of data. |
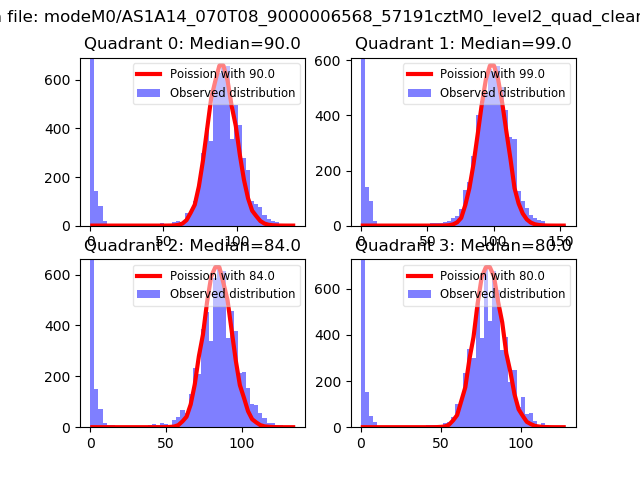 |
 |
| Quadrant-wise count rates Data is divided into 100 sec bins |
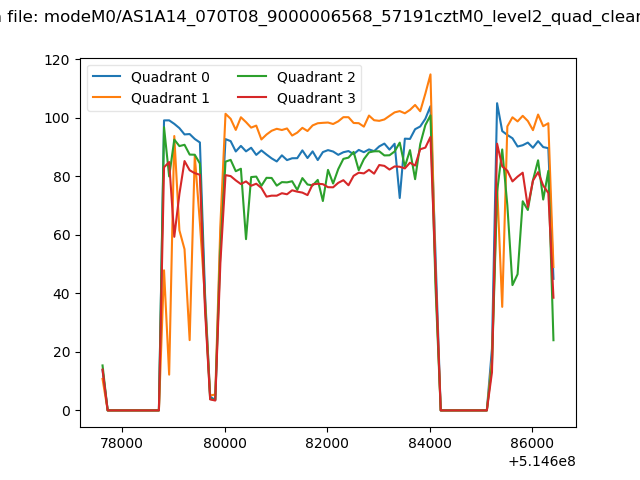 |
|
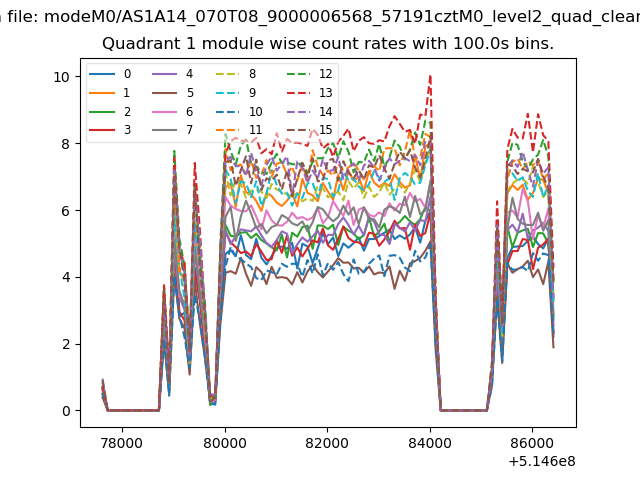
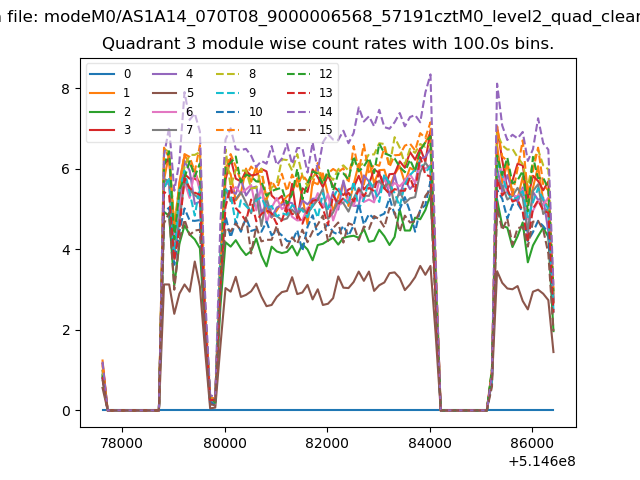
| Module-wise count rates for Quadrant A Data is divided into 100 sec bins |
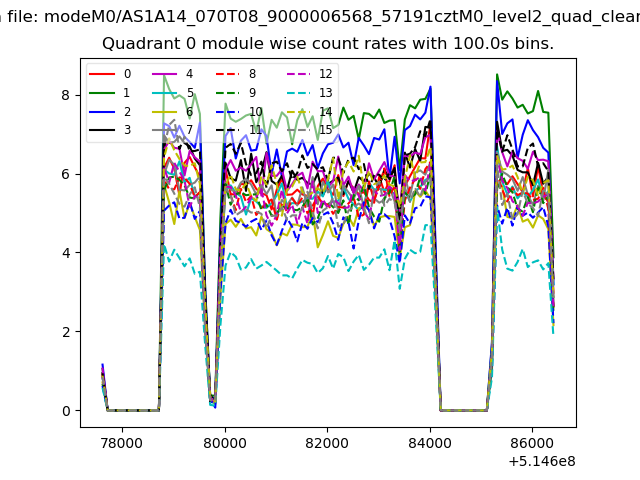 |
 |
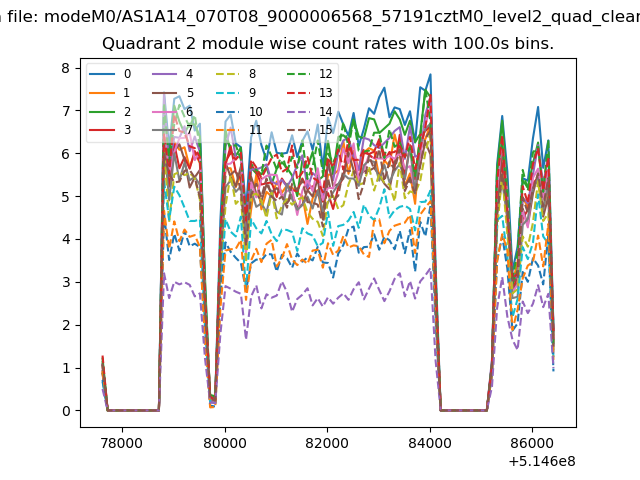
| Module-wise count rates for Quadrant B Data is divided into 100 sec bins |
 |
 |
| Module-wise count rates for Quadrant C Data is divided into 100 sec bins |
 |
 |
| Module-wise count rates for Quadrant D Data is divided into 100 sec bins |
 |
 |
| Parameter | Plot |
|---|---|
| CZT HV Monitor | 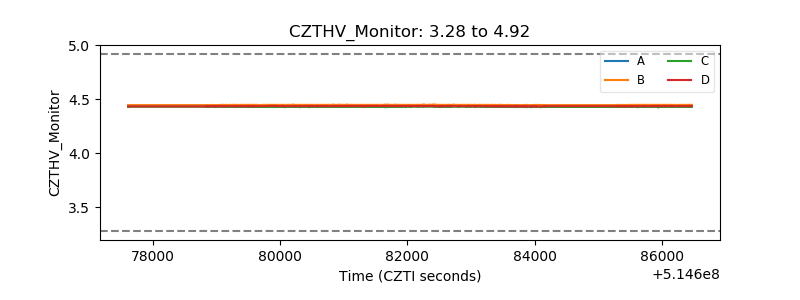 |
| D_VDD | 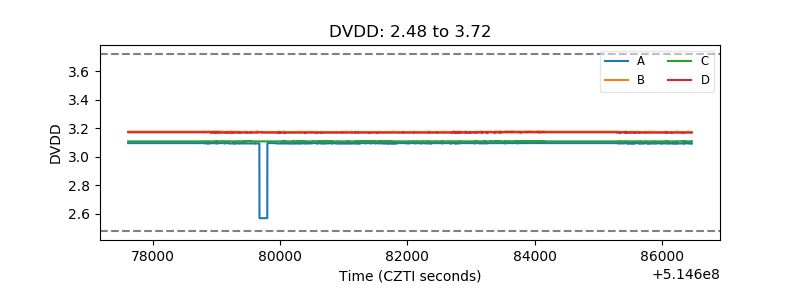 |
| Temperature 1 | 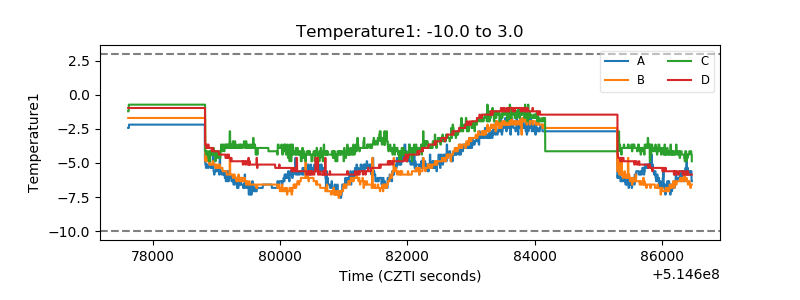 |
| Veto HV Monitor | 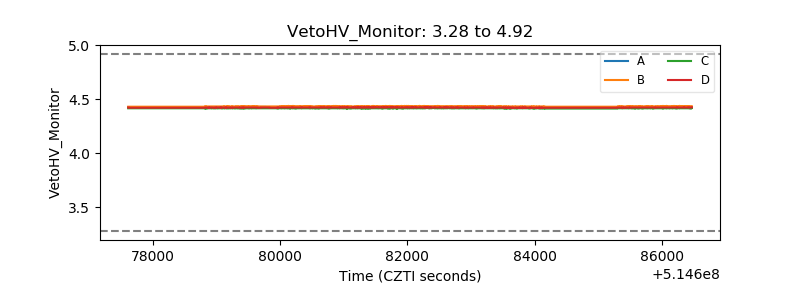 |
| Veto LLD | 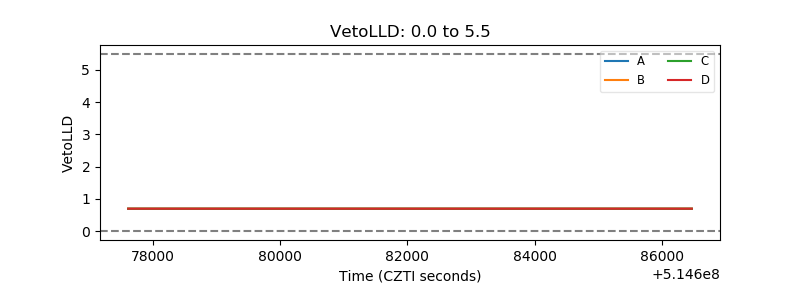 |
| Alpha Counter | 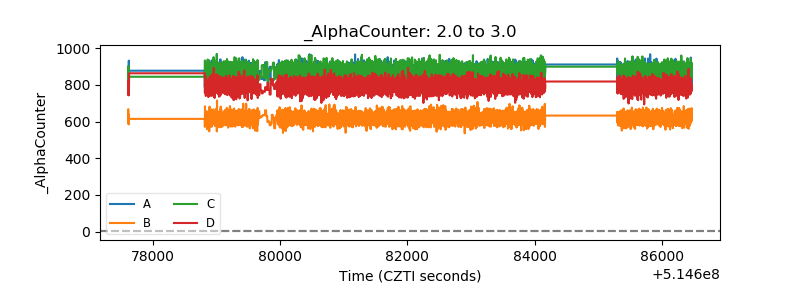 |
| _CPM_Rate | 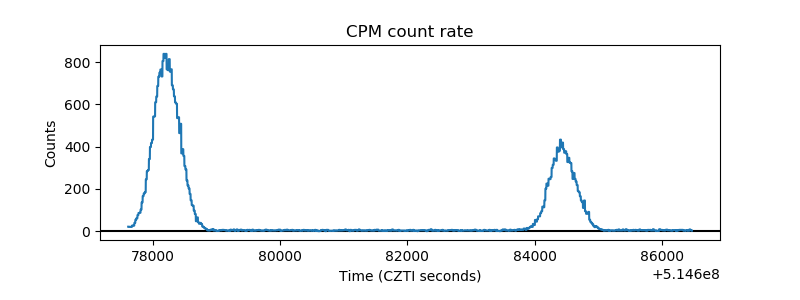 |
| CZT Counter | 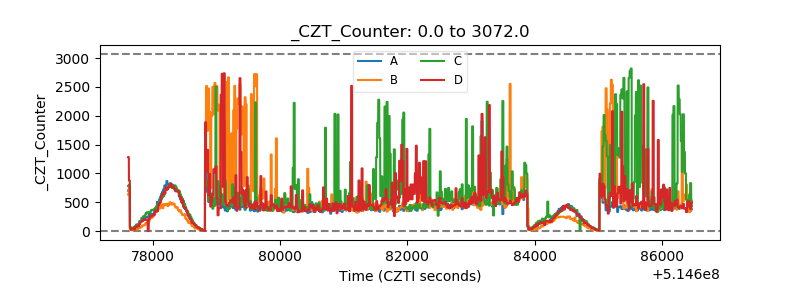 |
| +2.5 Volts monitor |  |
| +5 Volts monitor |  |
| _ROLL_ROT | 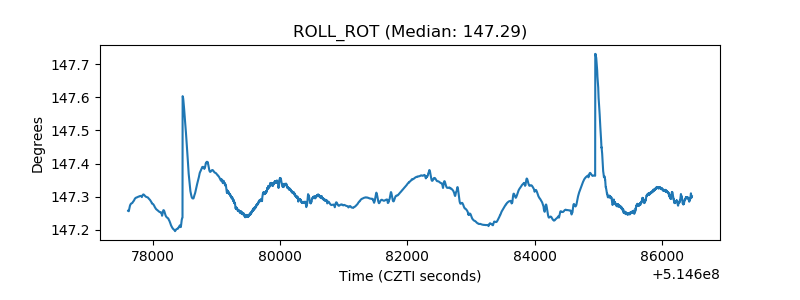 |
| _Roll_DEC | 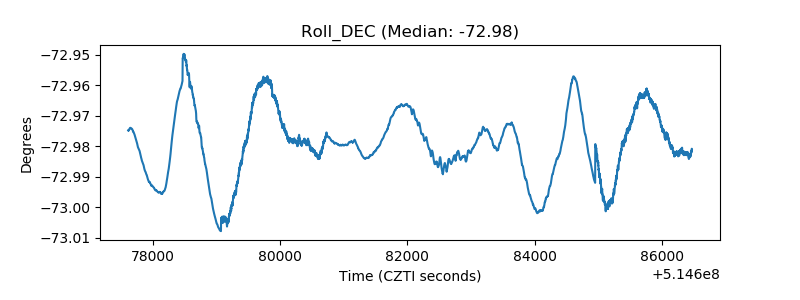 |
| _Roll_RA | 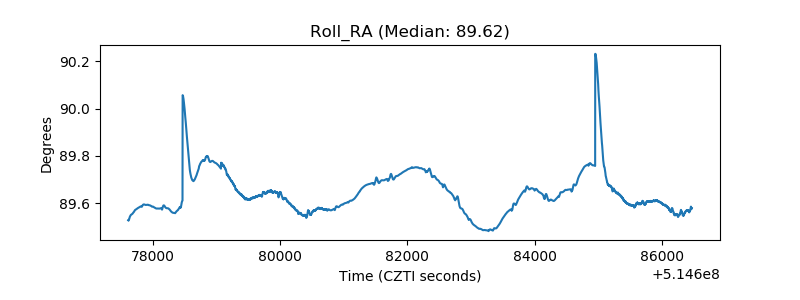 |
| Veto Counter | 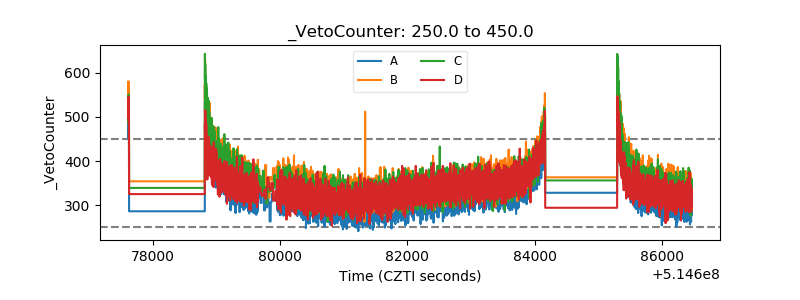 |