| Param | Original file | Final file |
|---|---|---|
| Filename | modeM0/AS1A14_070T08_9000006568_57194cztM0_level2.fits | modeM0/AS1A14_070T08_9000006568_57194cztM0_level2_quad_clean.evt |
| Size (bytes) | 559,785,600 | 105,454,080 |
| Size | 533.9 MB | 100.6 MB |
| Events in quadrant A | 3,213,090 | 710,730 |
| Events in quadrant B | 3,656,689 | 764,998 |
| Events in quadrant C | 7,598,689 | 594,759 |
| Events in quadrant D | 5,666,694 | 597,496 |
| Mode SS | |||
|---|---|---|---|
| Quadrant | BADHDUFLAG | Total packets | Discarded packets |
| A | 0 | 150 | 0 |
| B | 0 | 150 | 0 |
| C | 0 | 150 | 0 |
| D | 0 | 150 | 0 |
| Mode M0 | |||
|---|---|---|---|
| Quadrant | BADHDUFLAG | Total packets | Discarded packets |
| A | 0 | 15425 | 0 |
| B | 0 | 16330 | 0 |
| C | 0 | 27828 | 6 |
| D | 0 | 22297 | 0 |
| Quadrant | Total seconds | Saturated seconds | Saturation percentage |
|---|---|---|---|
| A | 7550 | 14 | 0.185430% |
| B | 7551 | 101 | 1.337571% |
| C | 7550 | 1064 | 14.092715% |
| D | 7550 | 533 | 7.059603% |
Noise dominated data is calculated using 1-second bins in cleaned event files. If a bin has >2000 counts, and if more than 50% of those come from <1% of pixels, then it is considered to be noise-dominated and hence unusable.
| Quadrant | # 1 sec bins | Bins with >0 counts | Bins with >2000 counts | High rate bins dominated by noise | Noise dominated (total time) | Noise dominated (detector-on time) | Marked lightcurve |
|---|---|---|---|---|---|---|---|
| A | 7550 | 7550 | 2 | 2 | 0.03% | 0.03% | 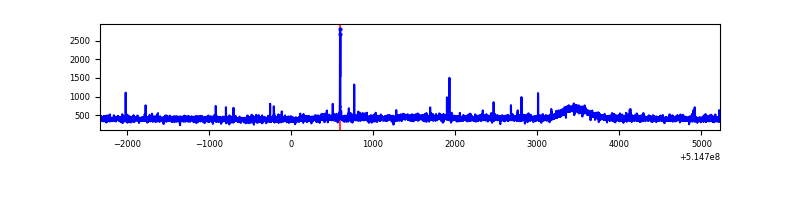 |
| B | 7551 | 7551 | 38 | 38 | 0.50% | 0.50% | 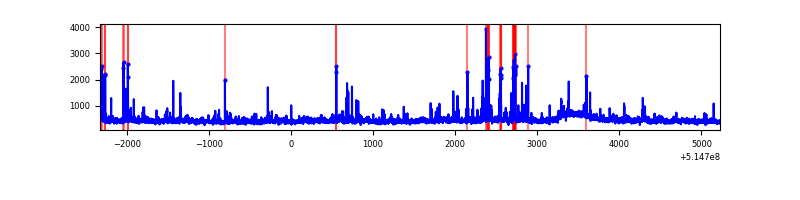 |
| C | 7550 | 7550 | 864 | 864 | 11.44% | 11.44% | 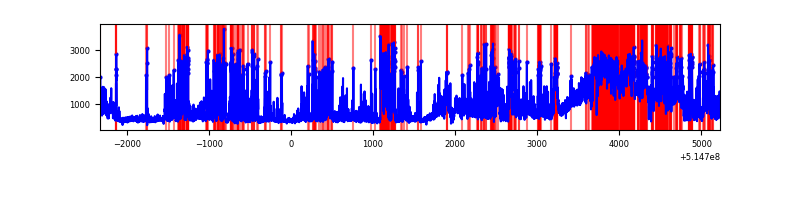 |
| D | 7550 | 7550 | 544 | 544 | 7.21% | 7.21% | 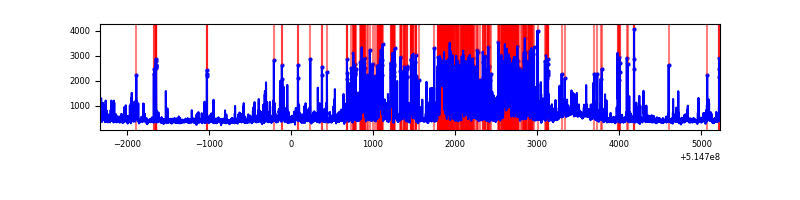 |
Top three noisy pixels from each quadrant. If the there are fewer than three noisy pixels in the level2.evt file, extra rows are filled as -1
| Pixel properties | Quadrant properties | ||||||
|---|---|---|---|---|---|---|---|
| Quadrant | DetID | PixID | Counts | Sigma | Mean | Median | Sigma |
| A | 3 | 14 | 86299 | 430.71 | 799 | 777 | 198.6 |
| A | 13 | 248 | 16943 | 81.42 | 799 | 777 | 198.6 |
| A | 8 | 6 | 11853 | 55.78 | 799 | 777 | 198.6 |
| B | 0 | 199 | 100054 | 592.42 | 793 | 763 | 167.6 |
| B | 7 | 252 | 97981 | 580.05 | 793 | 763 | 167.6 |
| B | 5 | 185 | 69360 | 409.28 | 793 | 763 | 167.6 |
| C | 15 | 224 | 2818071 | 14065.48 | 740 | 732 | 200.3 |
| C | 3 | 248 | 1450203 | 7236.44 | 740 | 732 | 200.3 |
| C | 14 | 67 | 143402 | 712.28 | 740 | 732 | 200.3 |
| D | 12 | 33 | 1367986 | 6485.73 | 751 | 716 | 210.8 |
| D | 12 | 3 | 763783 | 3619.66 | 751 | 716 | 210.8 |
| D | 2 | 31 | 98897 | 465.73 | 751 | 716 | 210.8 |
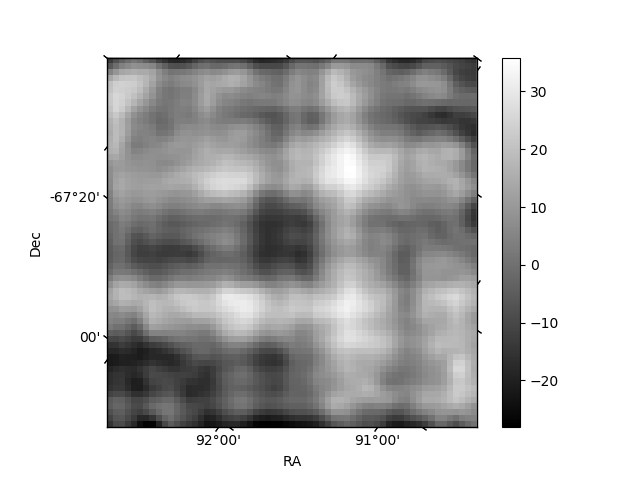
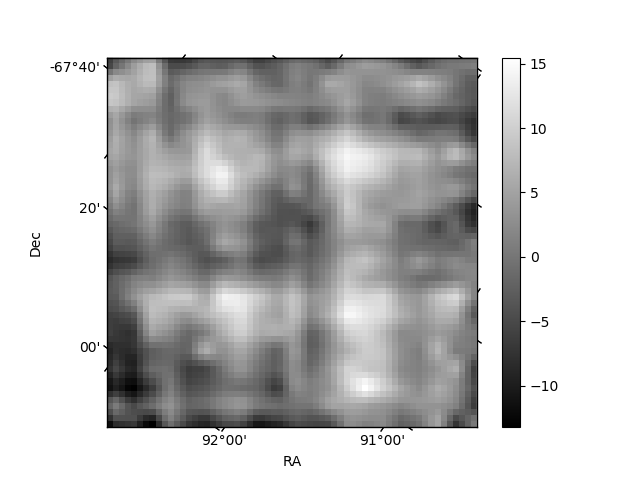
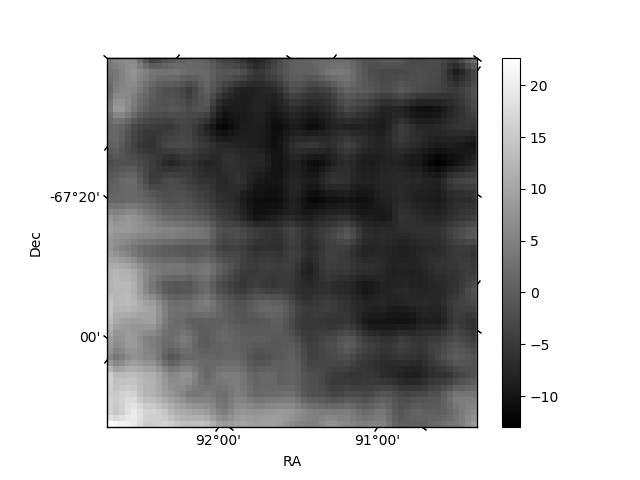
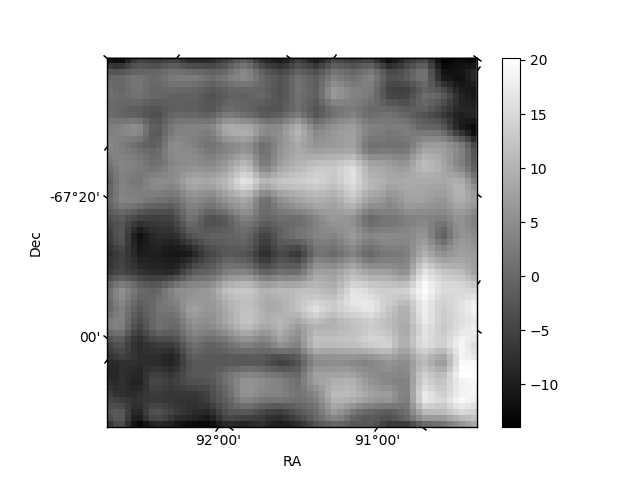
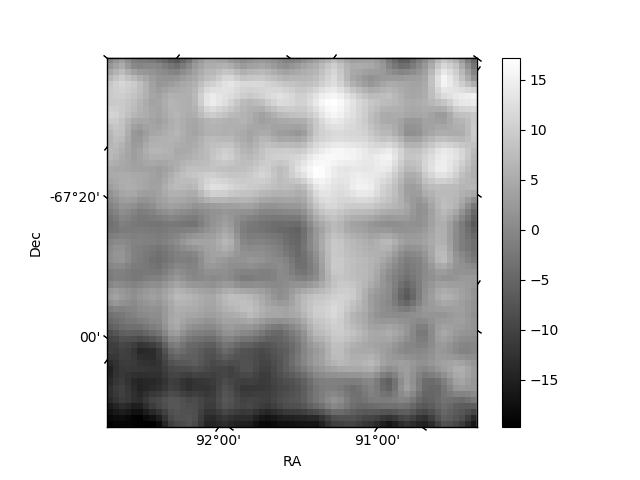
Histogram calculated using DETX and DETY for each event in the final _common_clean file
| Quadrant A | 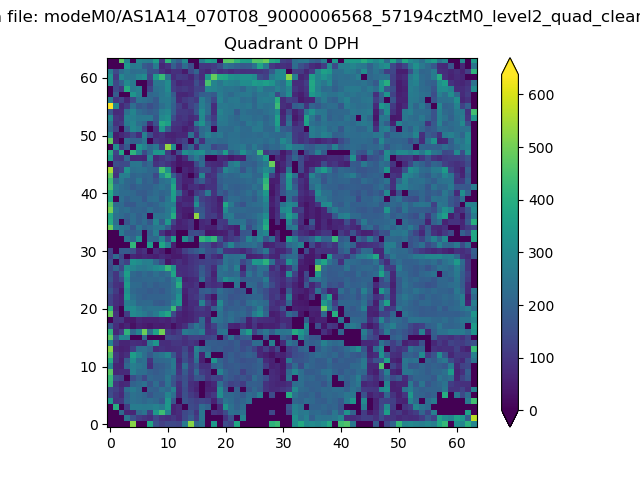 |
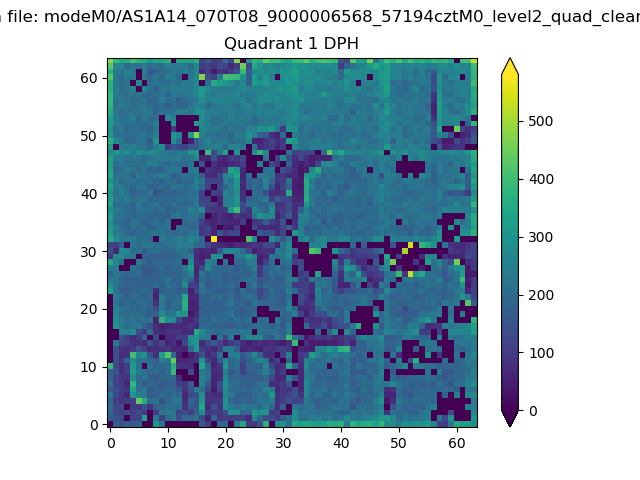 |
Quadrant B |
|---|---|---|---|
| Quadrant D | 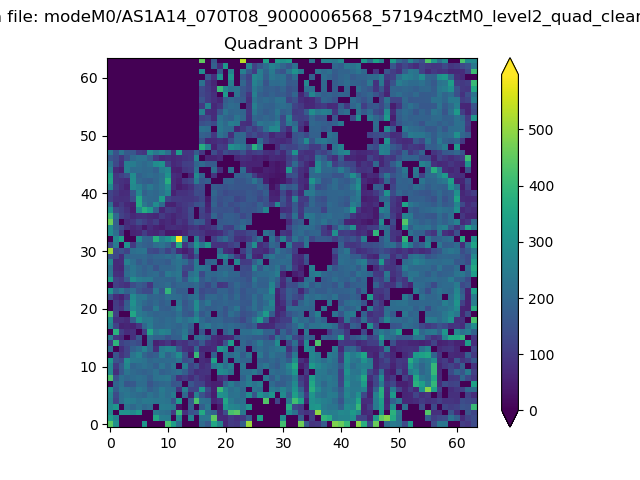 |
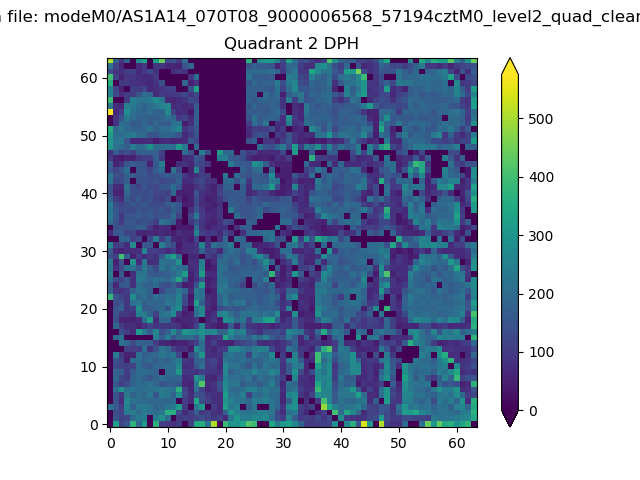 |
Quadrant C |
| Plot type | Count rate plots | Images |
|---|---|---|
| Comparison with Poisson distribution Blue bars denote a histogram of data divided into 1 sec bins. Red curve is a Poisson curve with rate = median count rate of data. |
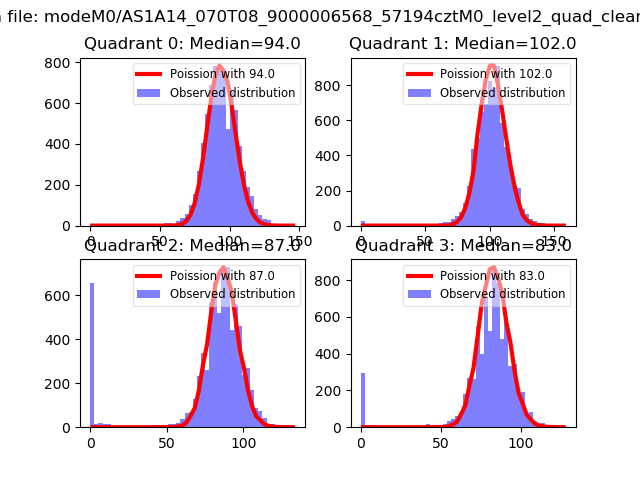 |
 |
| Quadrant-wise count rates Data is divided into 100 sec bins |
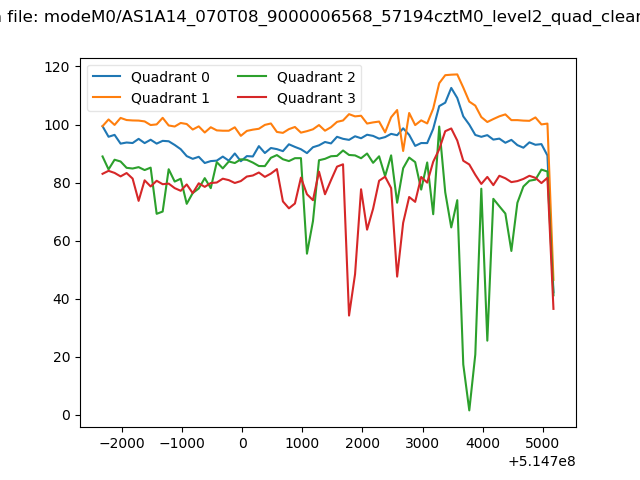 |
|
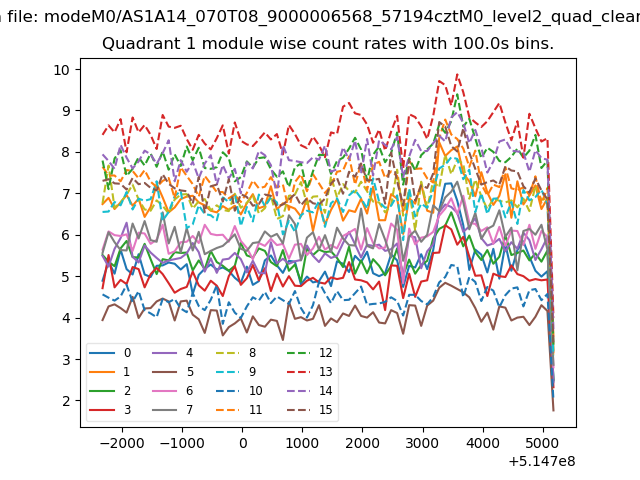
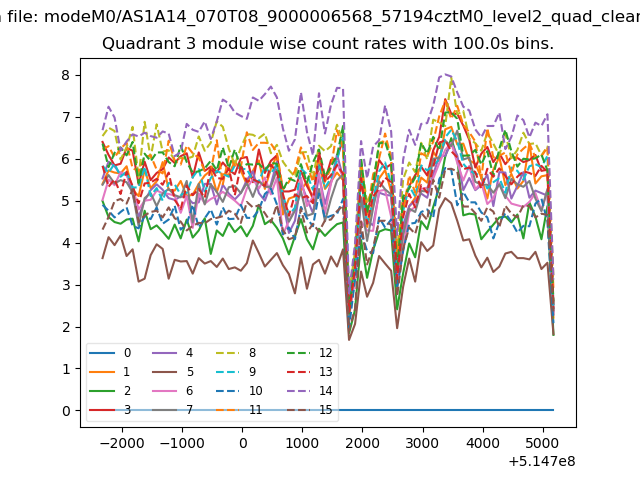
| Module-wise count rates for Quadrant A Data is divided into 100 sec bins |
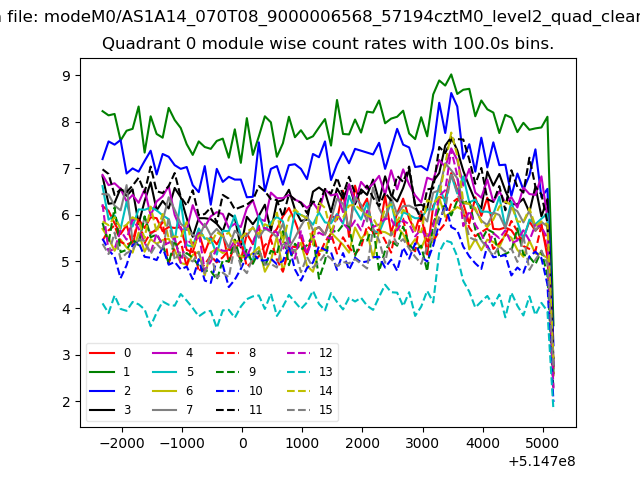 |
 |
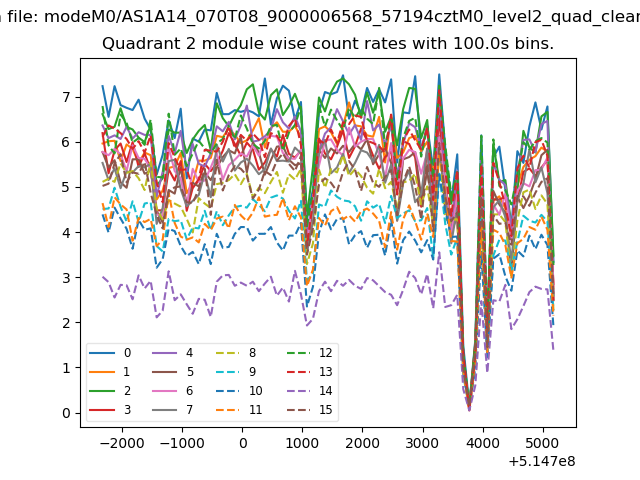
| Module-wise count rates for Quadrant B Data is divided into 100 sec bins |
 |
 |
| Module-wise count rates for Quadrant C Data is divided into 100 sec bins |
 |
 |
| Module-wise count rates for Quadrant D Data is divided into 100 sec bins |
 |
 |
| Parameter | Plot |
|---|---|
| CZT HV Monitor | 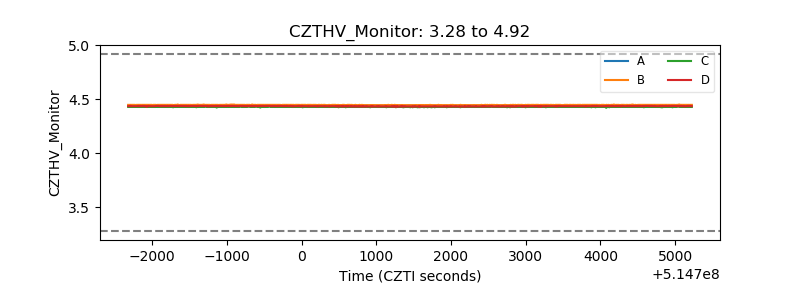 |
| D_VDD | 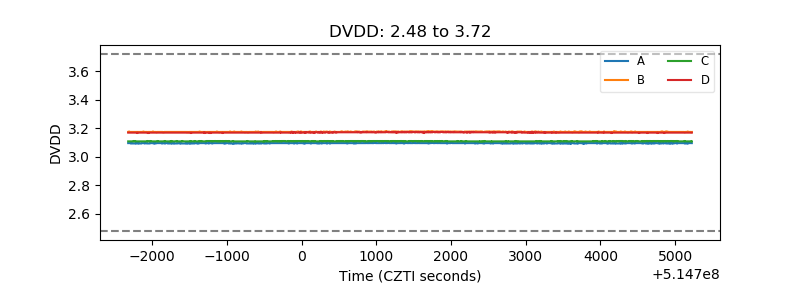 |
| Temperature 1 | 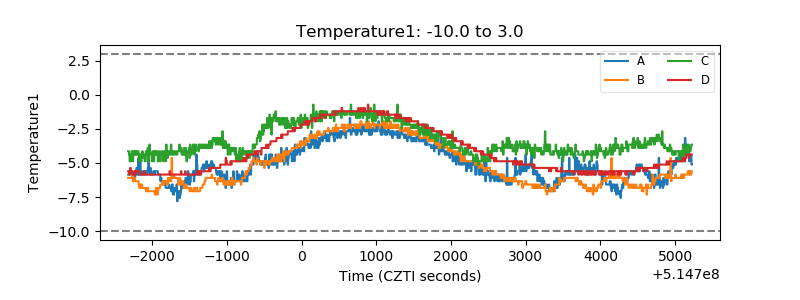 |
| Veto HV Monitor | 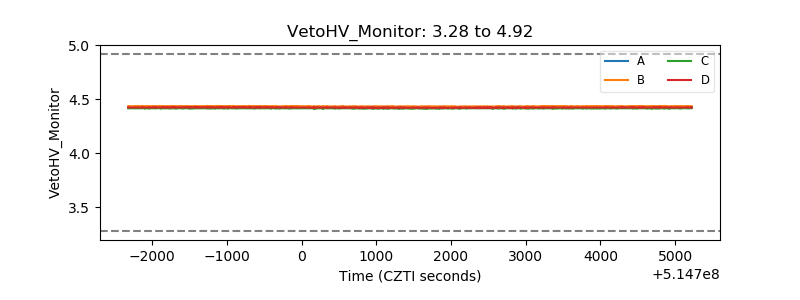 |
| Veto LLD | 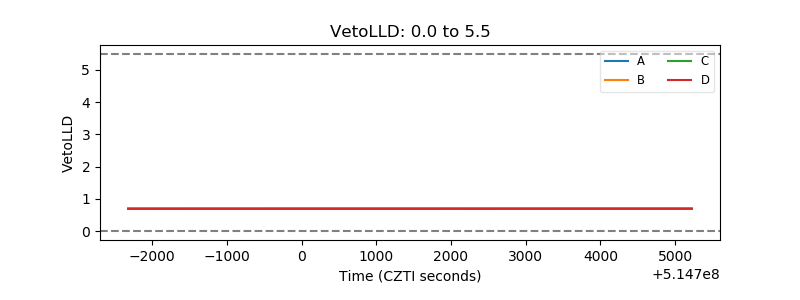 |
| Alpha Counter | 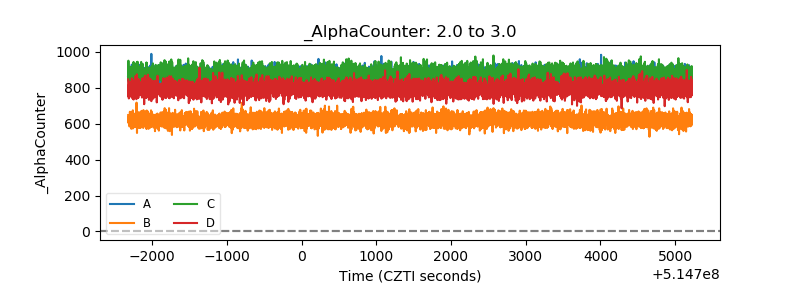 |
| _CPM_Rate | 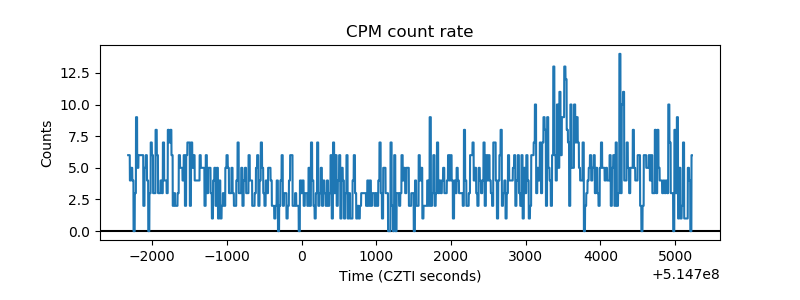 |
| CZT Counter | 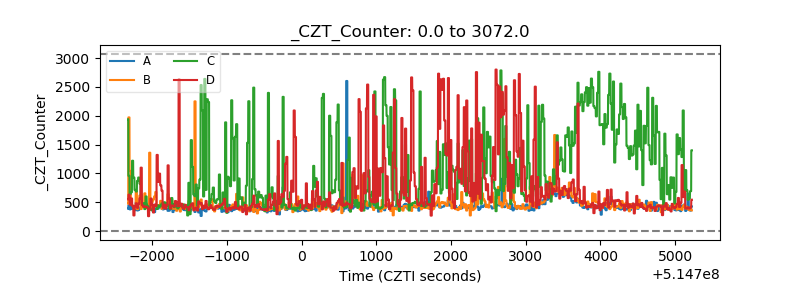 |
| +2.5 Volts monitor |  |
| +5 Volts monitor |  |
| _ROLL_ROT | 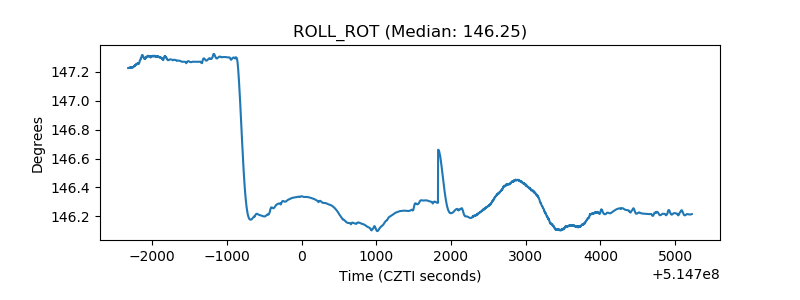 |
| _Roll_DEC | 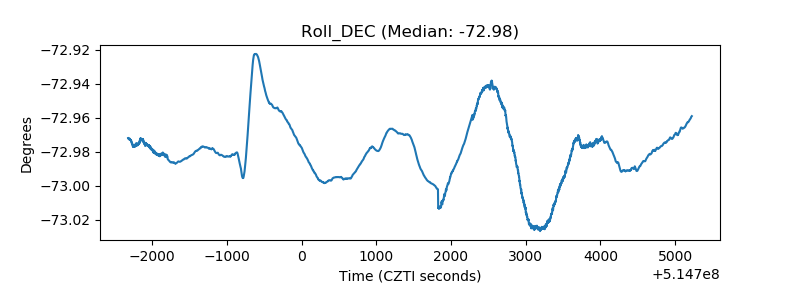 |
| _Roll_RA | 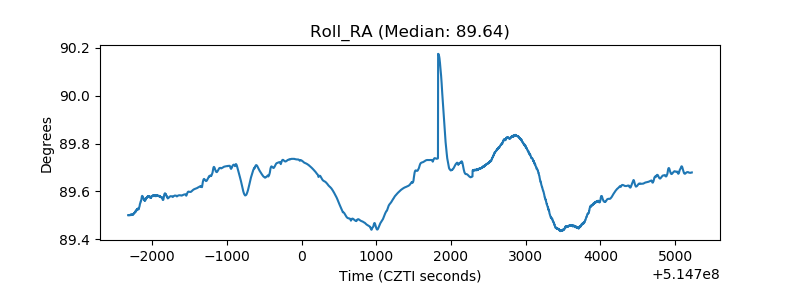 |
| Veto Counter | 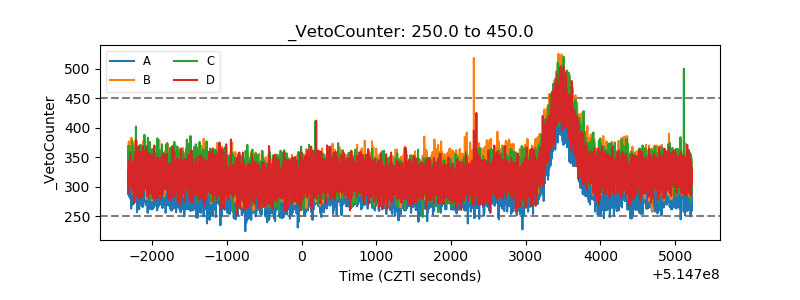 |