| Param | Original file | Final file |
|---|---|---|
| Filename | modeM0/AS1A14_070T08_9000006568_57195cztM0_level2.fits | modeM0/AS1A14_070T08_9000006568_57195cztM0_level2_quad_clean.evt |
| Size (bytes) | 610,784,640 | 108,918,720 |
| Size | 582.5 MB | 103.9 MB |
| Events in quadrant A | 3,332,966 | 741,742 |
| Events in quadrant B | 3,633,418 | 801,831 |
| Events in quadrant C | 9,348,559 | 572,441 |
| Events in quadrant D | 5,681,212 | 632,907 |
| Mode SS | |||
|---|---|---|---|
| Quadrant | BADHDUFLAG | Total packets | Discarded packets |
| A | 0 | 156 | 0 |
| B | 0 | 156 | 0 |
| C | 0 | 156 | 0 |
| D | 0 | 156 | 0 |
| Mode M0 | |||
|---|---|---|---|
| Quadrant | BADHDUFLAG | Total packets | Discarded packets |
| A | 0 | 15908 | 0 |
| B | 0 | 16632 | 0 |
| C | 0 | 33255 | 0 |
| D | 0 | 22327 | 0 |
| Quadrant | Total seconds | Saturated seconds | Saturation percentage |
|---|---|---|---|
| A | 7897 | 3 | 0.037989% |
| B | 7897 | 47 | 0.595163% |
| C | 7897 | 1774 | 22.464227% |
| D | 7897 | 466 | 5.900975% |
Noise dominated data is calculated using 1-second bins in cleaned event files. If a bin has >2000 counts, and if more than 50% of those come from <1% of pixels, then it is considered to be noise-dominated and hence unusable.
| Quadrant | # 1 sec bins | Bins with >0 counts | Bins with >2000 counts | High rate bins dominated by noise | Noise dominated (total time) | Noise dominated (detector-on time) | Marked lightcurve |
|---|---|---|---|---|---|---|---|
| A | 7897 | 7897 | 1 | 1 | 0.01% | 0.01% |  |
| B | 7897 | 7897 | 25 | 25 | 0.32% | 0.32% |  |
| C | 7897 | 7897 | 1597 | 1597 | 20.22% | 20.22% |  |
| D | 7897 | 7897 | 434 | 434 | 5.50% | 5.50% |  |
Top three noisy pixels from each quadrant. If the there are fewer than three noisy pixels in the level2.evt file, extra rows are filled as -1
| Pixel properties | Quadrant properties | ||||||
|---|---|---|---|---|---|---|---|
| Quadrant | DetID | PixID | Counts | Sigma | Mean | Median | Sigma |
| A | 3 | 14 | 71012 | 340.7 | 835 | 812 | 206.0 |
| A | 8 | 6 | 23654 | 110.86 | 835 | 812 | 206.0 |
| A | 13 | 254 | 11513 | 51.93 | 835 | 812 | 206.0 |
| B | 2 | 249 | 69127 | 384.75 | 827 | 796 | 177.6 |
| B | 7 | 252 | 66492 | 369.91 | 827 | 796 | 177.6 |
| B | 0 | 199 | 42995 | 237.61 | 827 | 796 | 177.6 |
| C | 15 | 224 | 4979663 | 25065.46 | 737 | 730 | 198.6 |
| C | 3 | 248 | 961006 | 4834.32 | 737 | 730 | 198.6 |
| C | 14 | 254 | 175691 | 880.81 | 737 | 730 | 198.6 |
| D | 12 | 3 | 1038520 | 4665.27 | 786 | 750 | 222.4 |
| D | 12 | 33 | 791969 | 3556.9 | 786 | 750 | 222.4 |
| D | 8 | 240 | 246127 | 1103.09 | 786 | 750 | 222.4 |
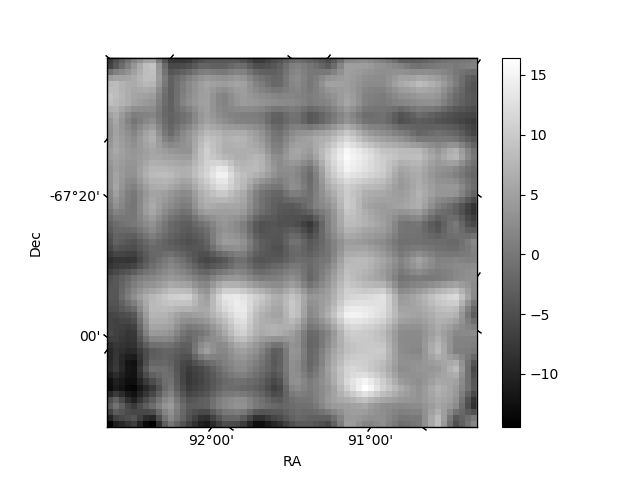
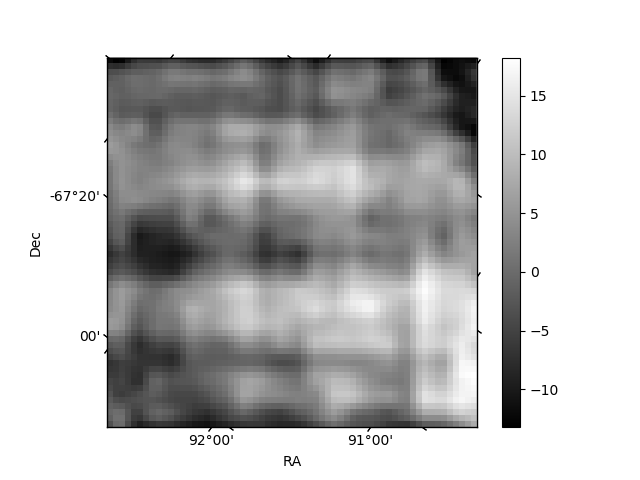
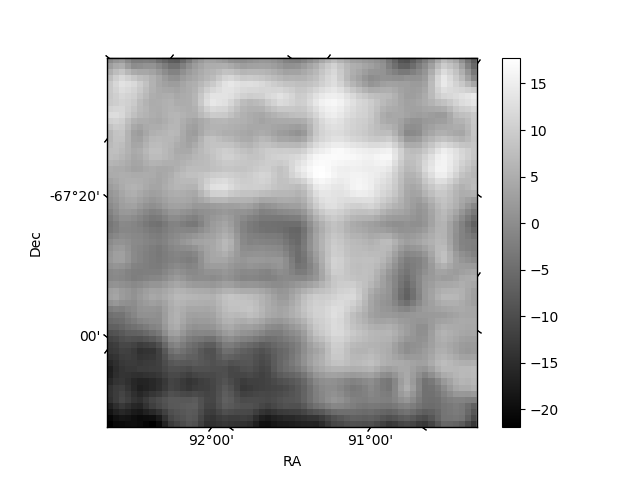
Histogram calculated using DETX and DETY for each event in the final _common_clean file
| Quadrant A | 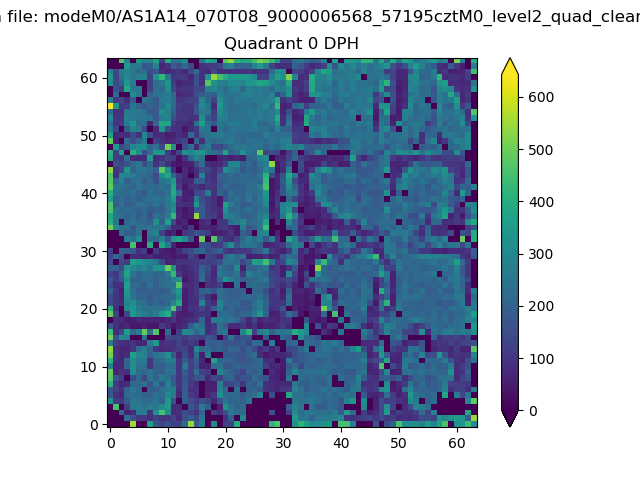 |
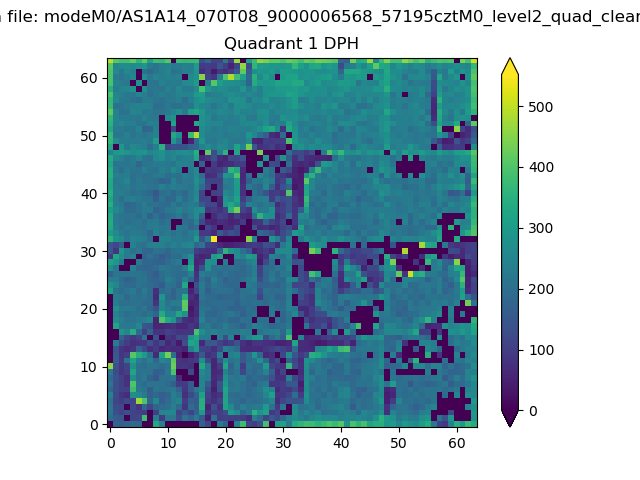 |
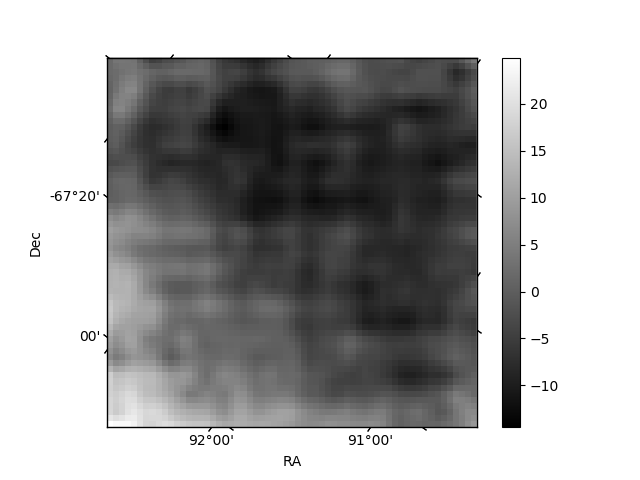
Quadrant B |
|---|---|---|---|
| Quadrant D | 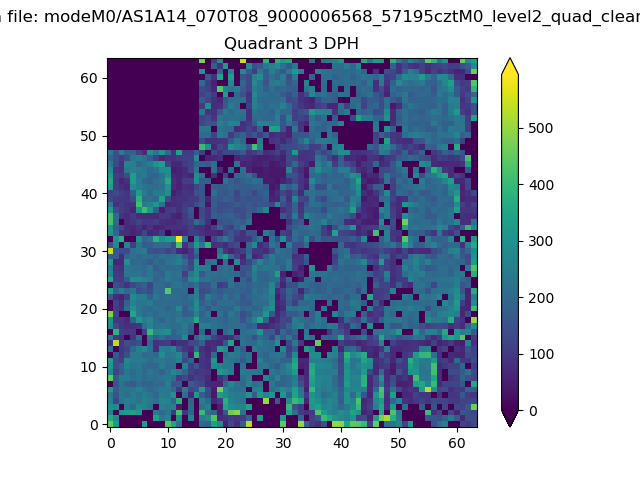 |
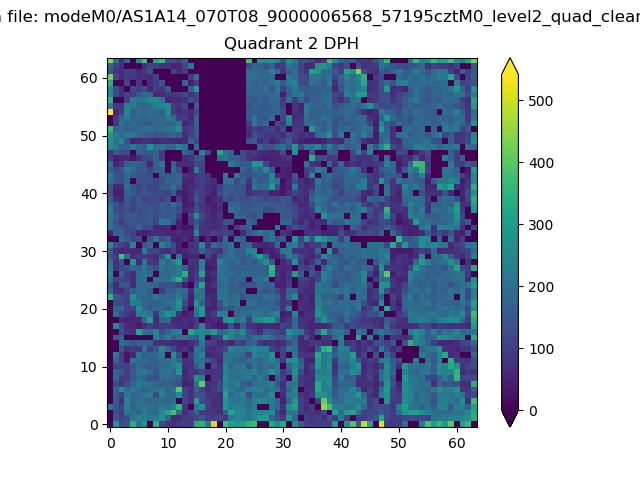 |
Quadrant C |
| Plot type | Count rate plots | Images |
|---|---|---|
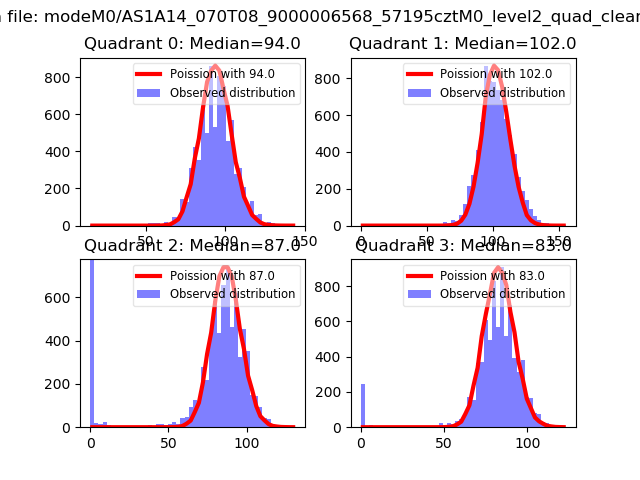
| Comparison with Poisson distribution Blue bars denote a histogram of data divided into 1 sec bins. Red curve is a Poisson curve with rate = median count rate of data. |
 |
 |
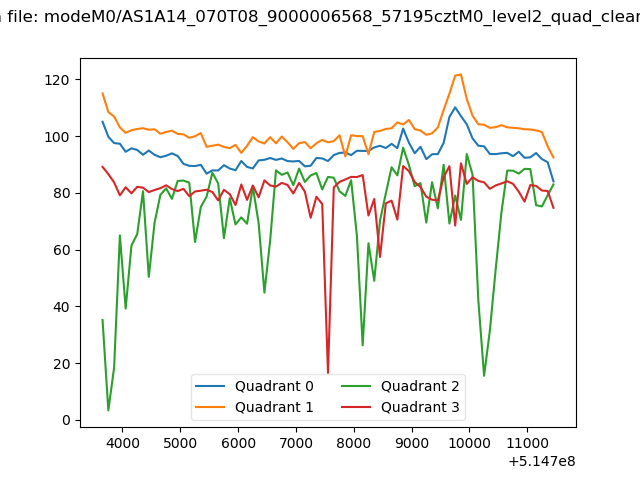
| Quadrant-wise count rates Data is divided into 100 sec bins |
 |
|
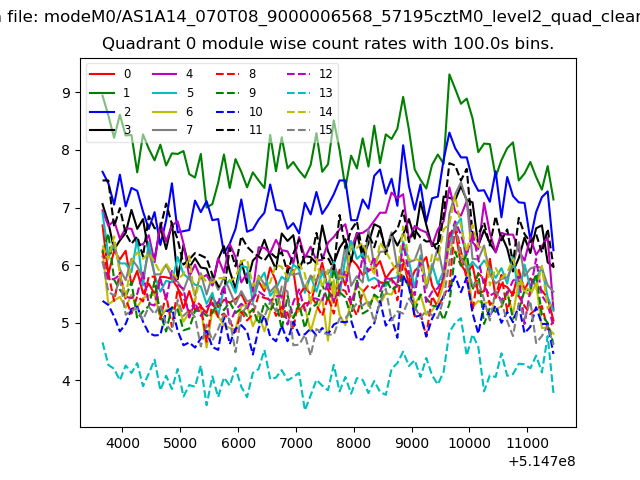
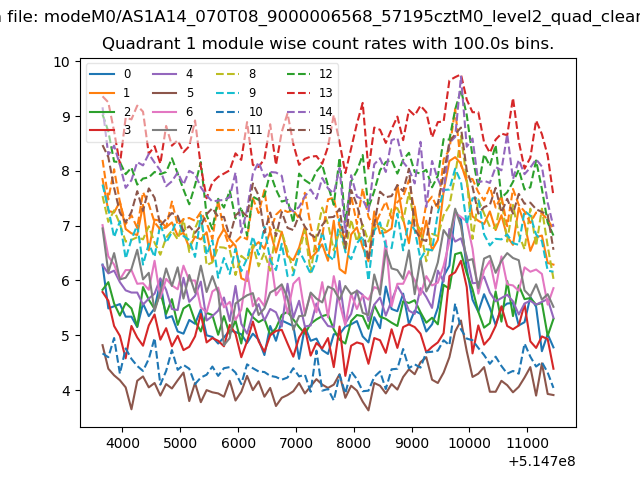
| Module-wise count rates for Quadrant A Data is divided into 100 sec bins |
 |
 |
| Module-wise count rates for Quadrant B Data is divided into 100 sec bins |
 |
 |
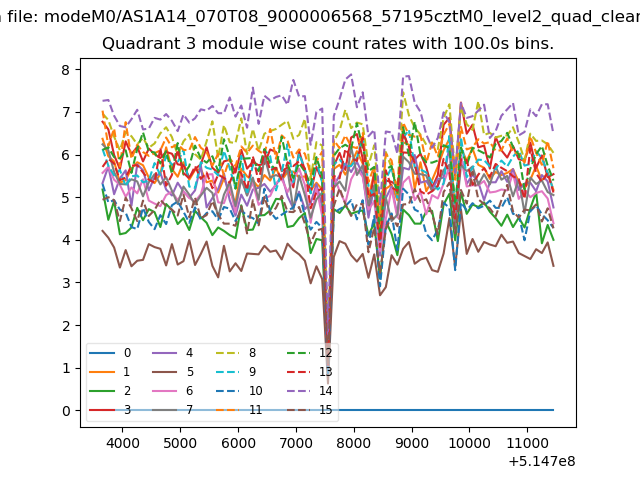
| Module-wise count rates for Quadrant C Data is divided into 100 sec bins |
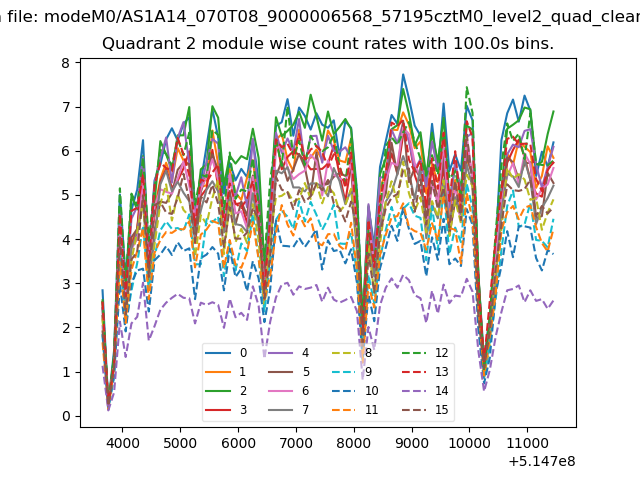 |
 |
| Module-wise count rates for Quadrant D Data is divided into 100 sec bins |
 |
 |
| Parameter | Plot |
|---|---|
| CZT HV Monitor | 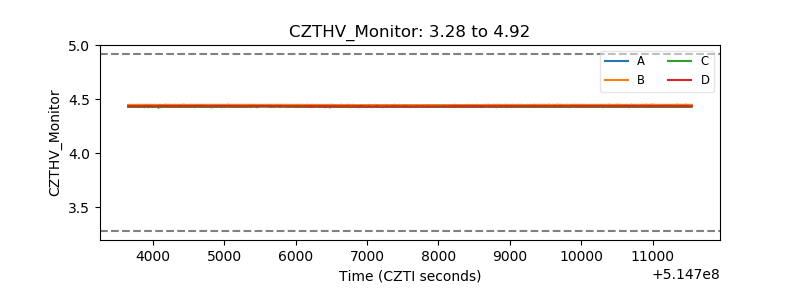 |
| D_VDD | 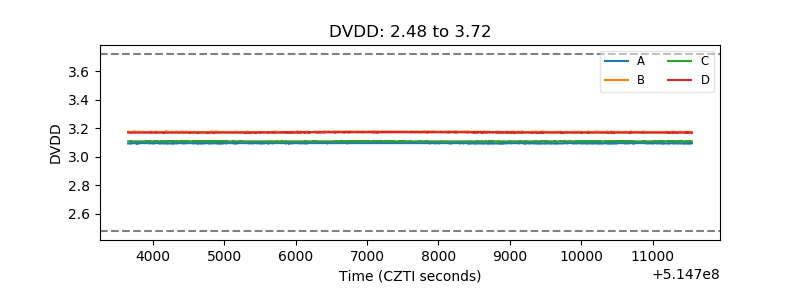 |
| Temperature 1 | 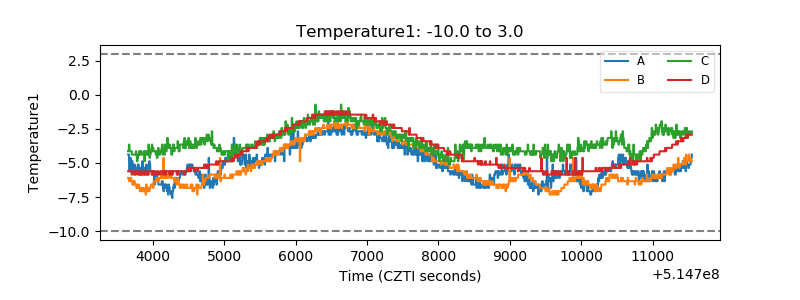 |
| Veto HV Monitor | 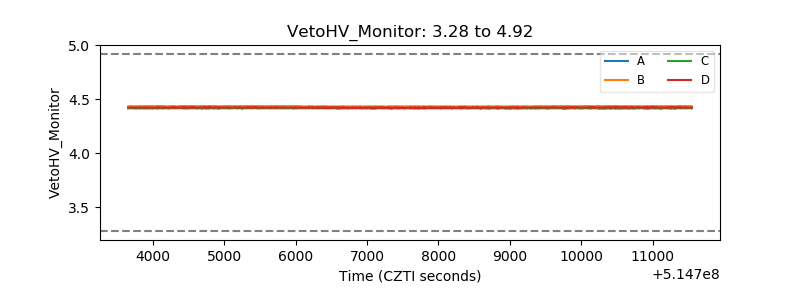 |
| Veto LLD | 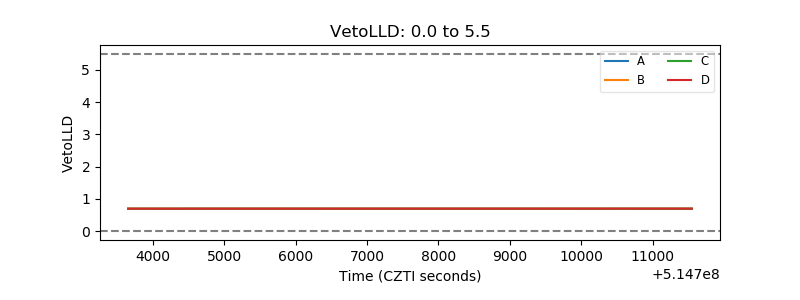 |
| Alpha Counter | 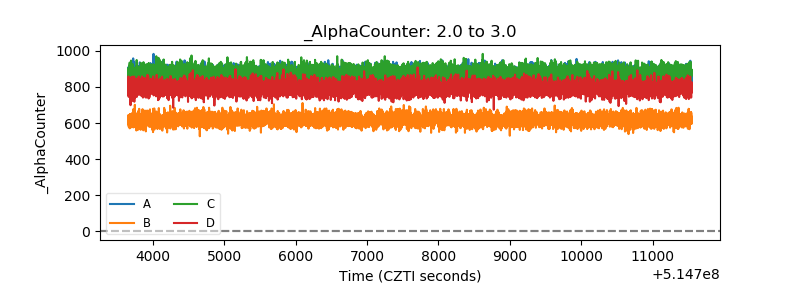 |
| _CPM_Rate | 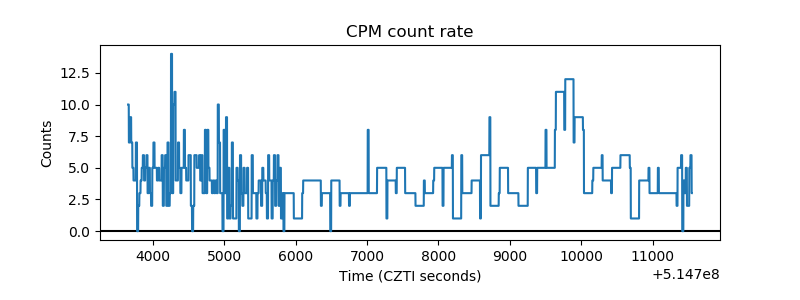 |
| CZT Counter | 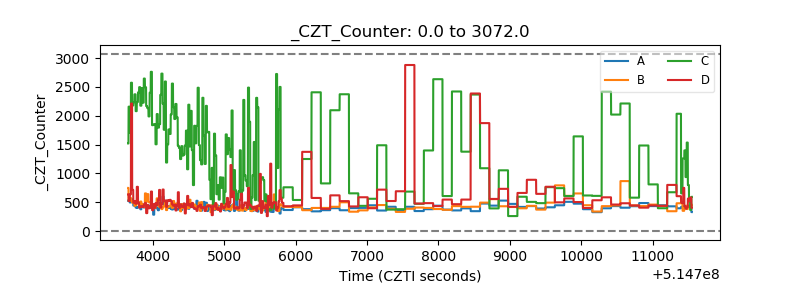 |
| +2.5 Volts monitor |  |
| +5 Volts monitor |  |
| _ROLL_ROT | 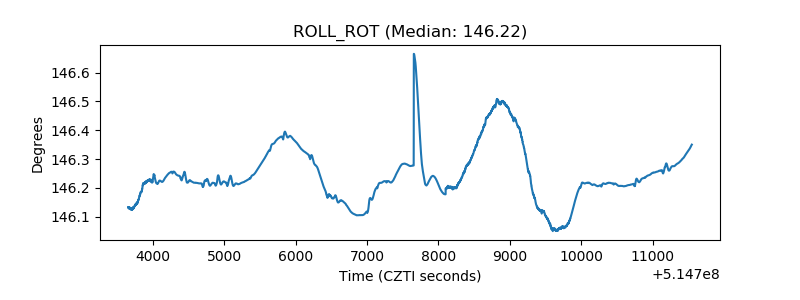 |
| _Roll_DEC | 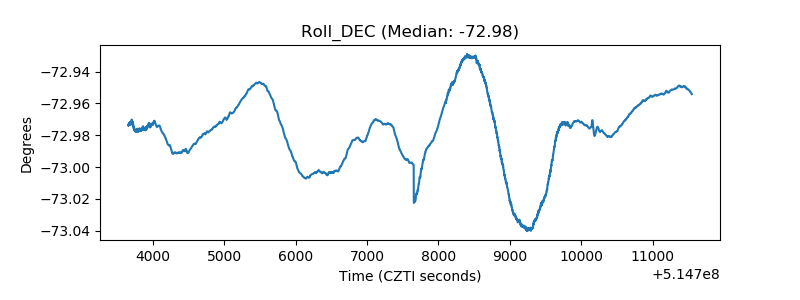 |
| _Roll_RA | 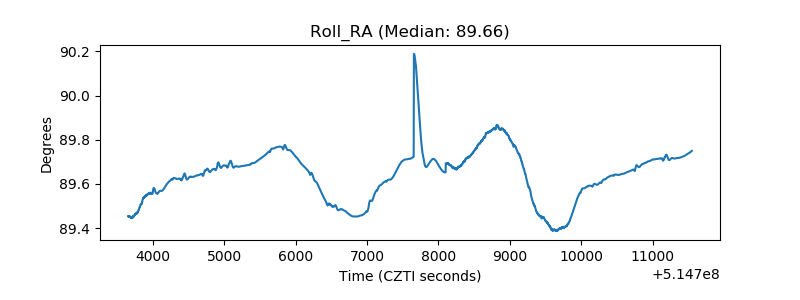 |
| Veto Counter | 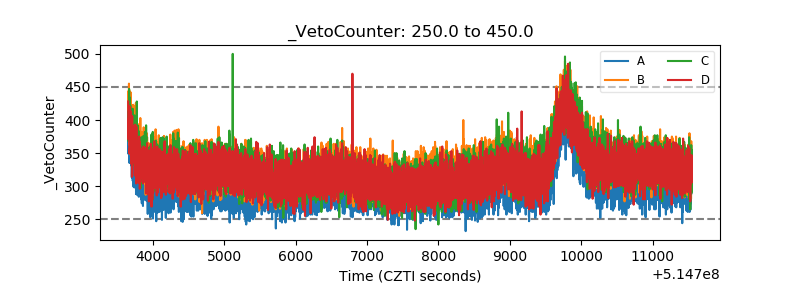 |