| Param | Original file | Final file |
|---|---|---|
| Filename | modeM0/AS1A14_070T08_9000006568_57199cztM0_level2.fits | modeM0/AS1A14_070T08_9000006568_57199cztM0_level2_quad_clean.evt |
| Size (bytes) | 2,245,092,480 | 318,196,800 |
| Size | 2.1 GB | 303.5 MB |
| Events in quadrant A | 10,606,310 | 2,302,803 |
| Events in quadrant B | 14,707,187 | 2,345,256 |
| Events in quadrant C | 20,083,684 | 2,024,665 |
| Events in quadrant D | 35,816,171 | 1,275,311 |
| Mode M9 | |||
|---|---|---|---|
| Quadrant | BADHDUFLAG | Total packets | Discarded packets |
| A | 0 | 15 | 0 |
| B | 0 | 15 | 0 |
| C | 0 | 15 | 0 |
| D | 0 | 15 | 0 |
| Mode SS | |||
|---|---|---|---|
| Quadrant | BADHDUFLAG | Total packets | Discarded packets |
| A | 0 | 498 | 0 |
| B | 0 | 498 | 0 |
| C | 0 | 498 | 0 |
| D | 0 | 498 | 0 |
| Mode M0 | |||
|---|---|---|---|
| Quadrant | BADHDUFLAG | Total packets | Discarded packets |
| A | 0 | 50283 | 3 |
| B | 0 | 61207 | 4 |
| C | 0 | 77299 | 3 |
| D | 0 | 123311 | 3 |
| Quadrant | Total seconds | Saturated seconds | Saturation percentage |
|---|---|---|---|
| A | 24482 | 295 | 1.204967% |
| B | 24481 | 1689 | 6.899228% |
| C | 24481 | 2625 | 10.722601% |
| D | 24481 | 9626 | 39.320289% |
Noise dominated data is calculated using 1-second bins in cleaned event files. If a bin has >2000 counts, and if more than 50% of those come from <1% of pixels, then it is considered to be noise-dominated and hence unusable.
| Quadrant | # 1 sec bins | Bins with >0 counts | Bins with >2000 counts | High rate bins dominated by noise | Noise dominated (total time) | Noise dominated (detector-on time) | Marked lightcurve |
|---|---|---|---|---|---|---|---|
| A | 26162 | 24484 | 4 | 4 | 0.02% | 0.02% | 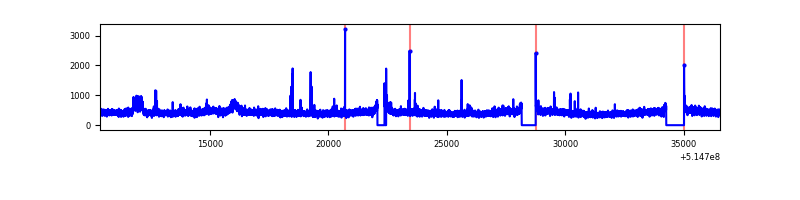 |
| B | 26161 | 24481 | 881 | 881 | 3.37% | 3.60% | 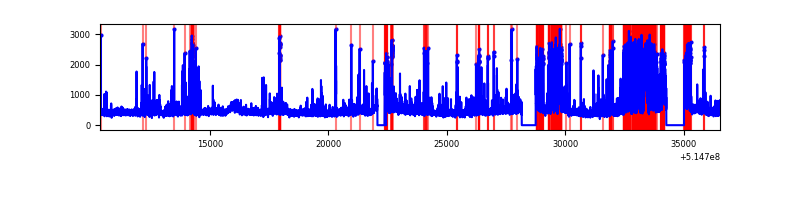 |
| C | 26160 | 24481 | 2141 | 2141 | 8.18% | 8.75% | 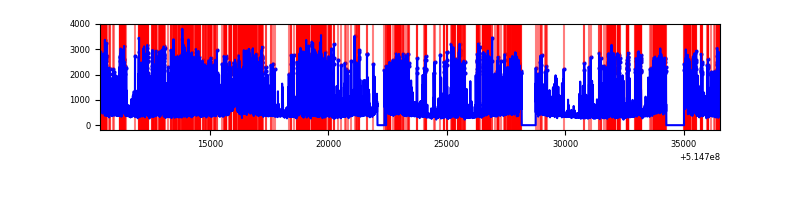 |
| D | 26160 | 24480 | 8759 | 8759 | 33.48% | 35.78% | 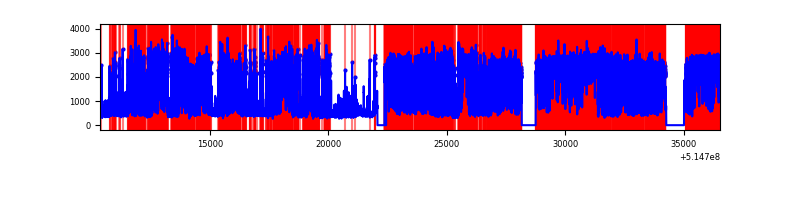 |
Top three noisy pixels from each quadrant. If the there are fewer than three noisy pixels in the level2.evt file, extra rows are filled as -1
| Pixel properties | Quadrant properties | ||||||
|---|---|---|---|---|---|---|---|
| Quadrant | DetID | PixID | Counts | Sigma | Mean | Median | Sigma |
| A | 3 | 14 | 383930 | 592.84 | 2621 | 2554 | 643.3 |
| A | 10 | 251 | 39274 | 57.08 | 2621 | 2554 | 643.3 |
| A | 13 | 254 | 36534 | 52.82 | 2621 | 2554 | 643.3 |
| B | 5 | 185 | 2896532 | 5410.35 | 2517 | 2418 | 534.9 |
| B | 10 | 16 | 515750 | 959.64 | 2517 | 2418 | 534.9 |
| B | 0 | 183 | 239391 | 443.01 | 2517 | 2418 | 534.9 |
| C | 15 | 224 | 9824286 | 14933.44 | 2425 | 2393 | 657.7 |
| C | 12 | 252 | 189534 | 284.53 | 2425 | 2393 | 657.7 |
| C | 14 | 254 | 173995 | 260.91 | 2425 | 2393 | 657.7 |
| D | 12 | 33 | 21829187 | 38944.95 | 1988 | 1896 | 560.5 |
| D | 12 | 3 | 4182914 | 7459.91 | 1988 | 1896 | 560.5 |
| D | 7 | 96 | 391223 | 694.65 | 1988 | 1896 | 560.5 |
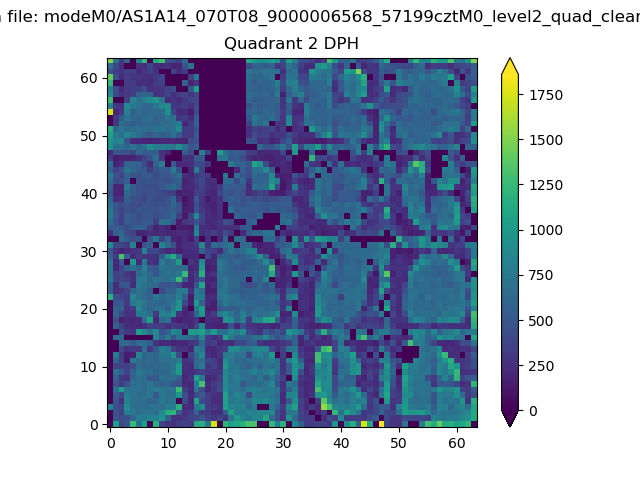
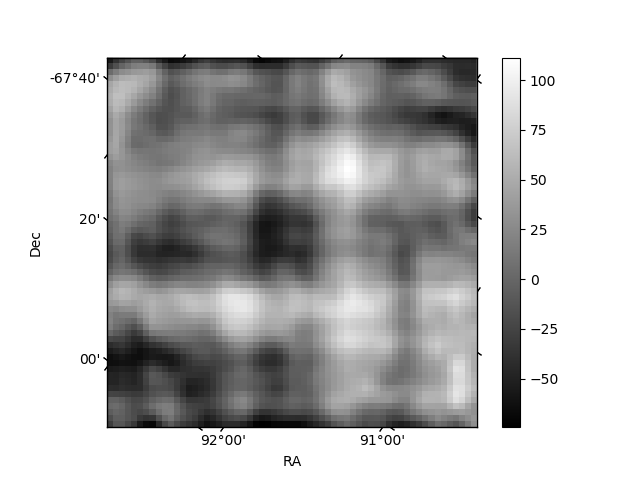
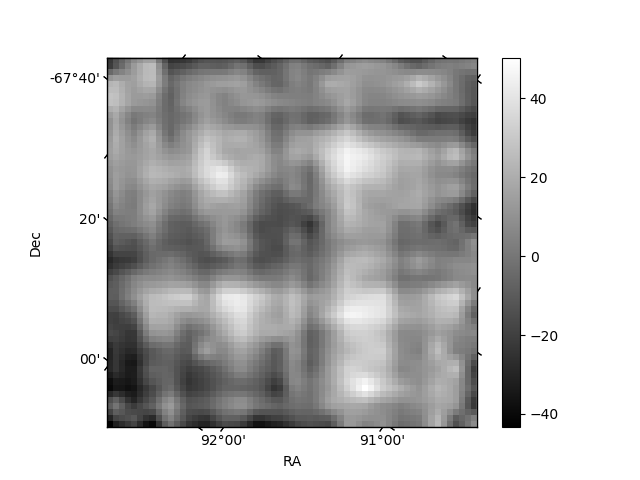
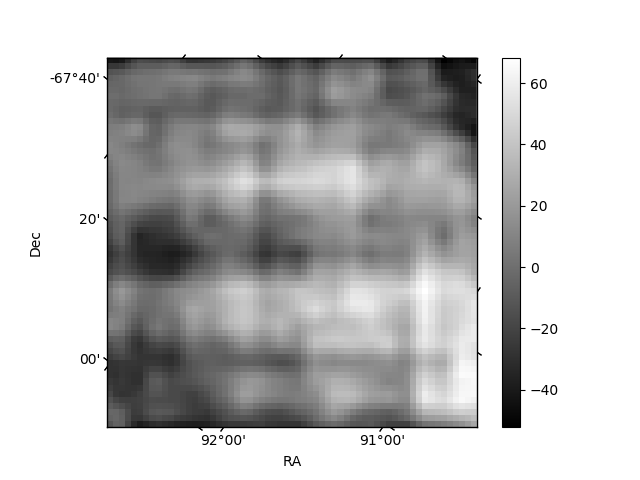
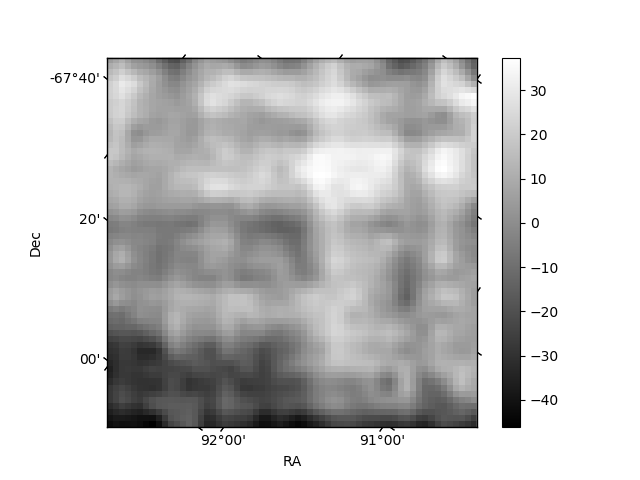
Histogram calculated using DETX and DETY for each event in the final _common_clean file
| Quadrant A | 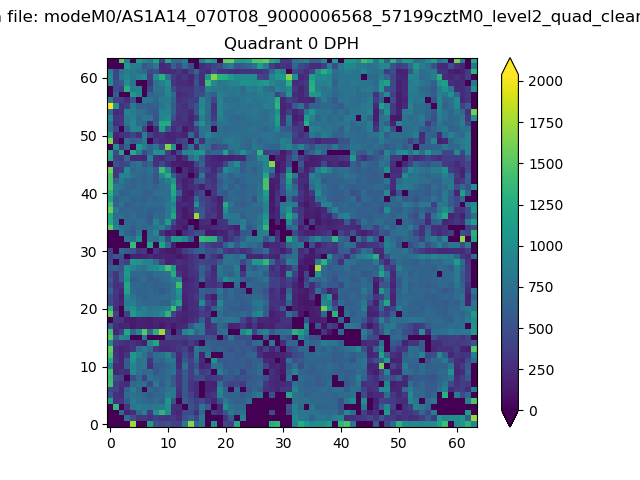 |
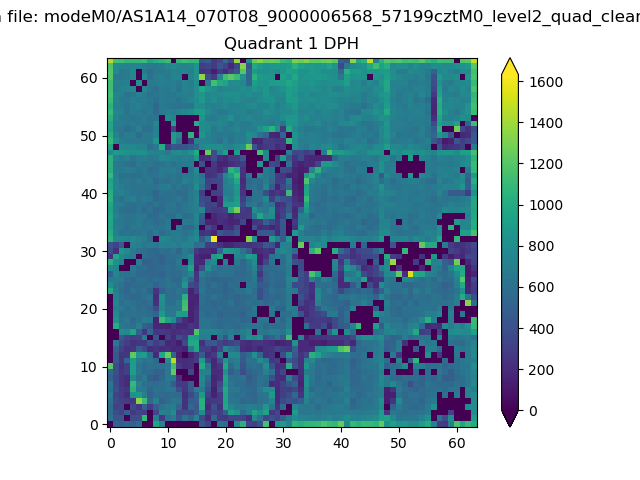 |
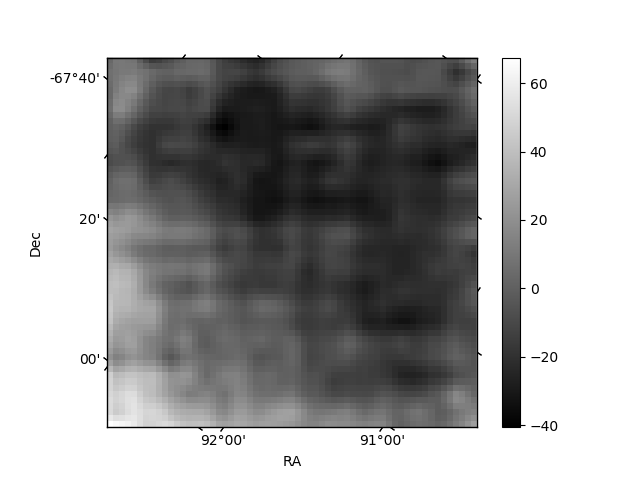
Quadrant B |
|---|---|---|---|
| Quadrant D | 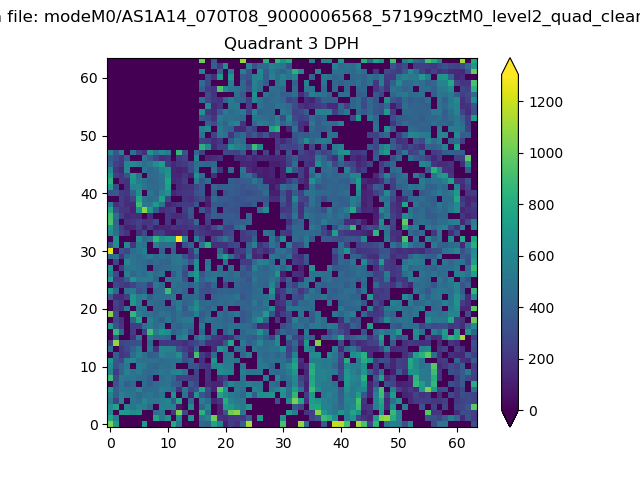 |
 |
Quadrant C |
| Plot type | Count rate plots | Images |
|---|---|---|
| Comparison with Poisson distribution Blue bars denote a histogram of data divided into 1 sec bins. Red curve is a Poisson curve with rate = median count rate of data. |
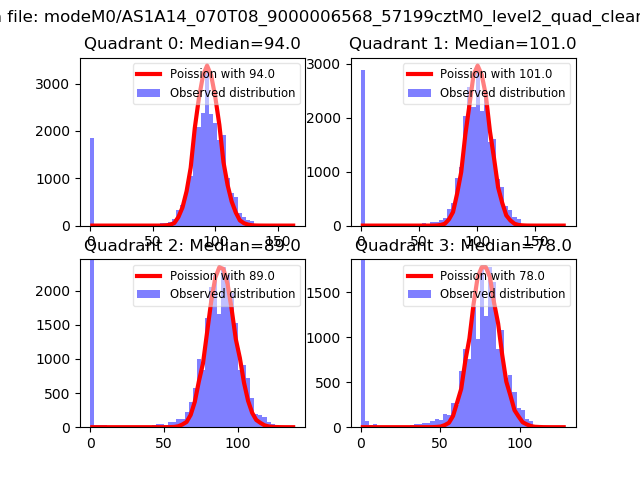 |
 |
| Quadrant-wise count rates Data is divided into 100 sec bins |
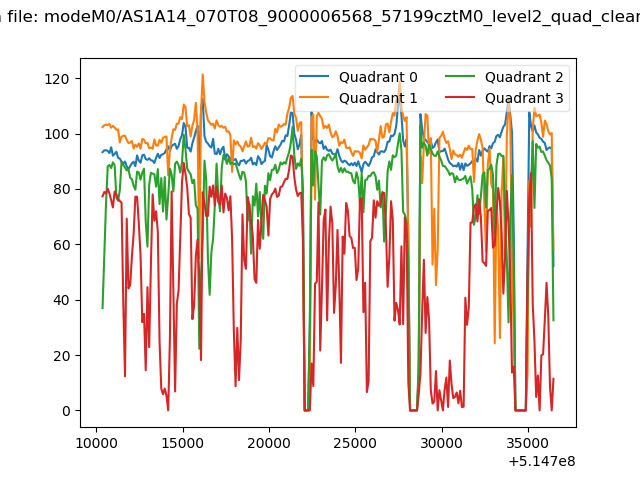 |
|
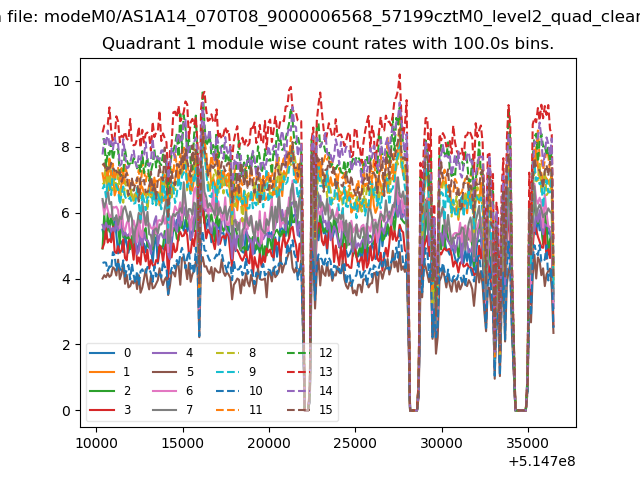
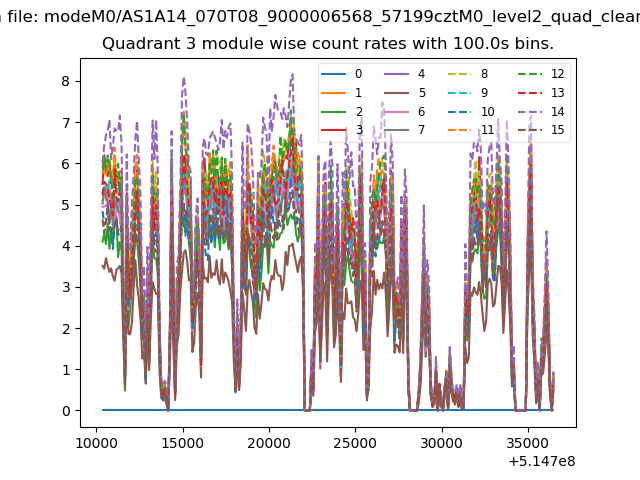
| Module-wise count rates for Quadrant A Data is divided into 100 sec bins |
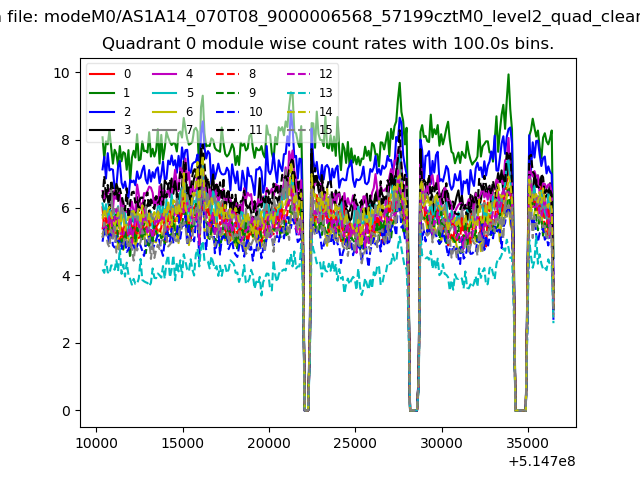 |
 |
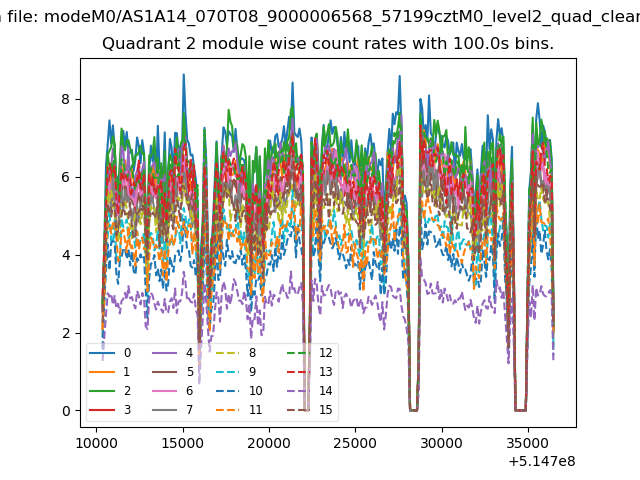
| Module-wise count rates for Quadrant B Data is divided into 100 sec bins |
 |
 |
| Module-wise count rates for Quadrant C Data is divided into 100 sec bins |
 |
 |
| Module-wise count rates for Quadrant D Data is divided into 100 sec bins |
 |
 |
| Parameter | Plot |
|---|---|
| CZT HV Monitor | 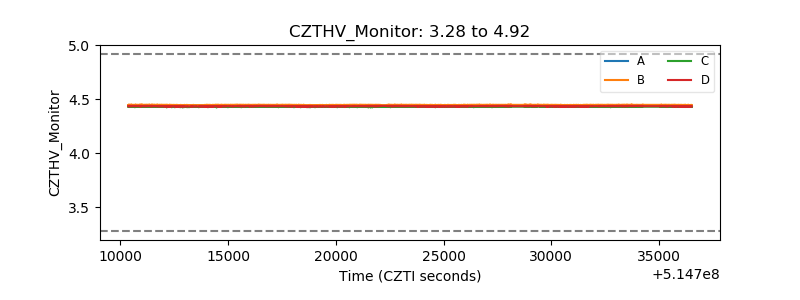 |
| D_VDD | 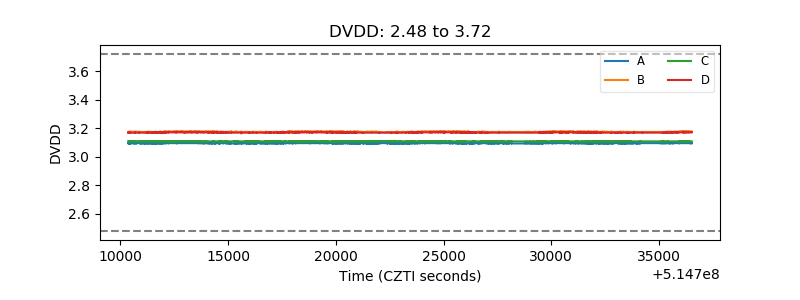 |
| Temperature 1 | 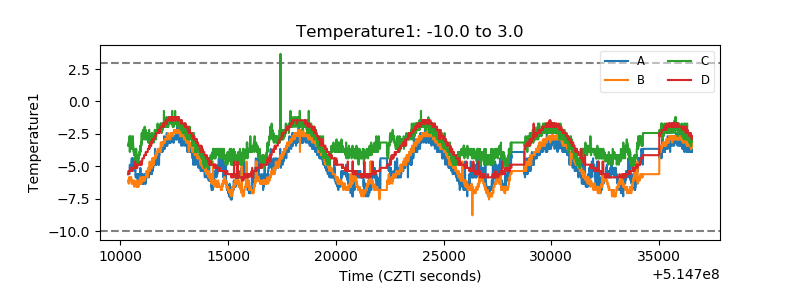 |
| Veto HV Monitor | 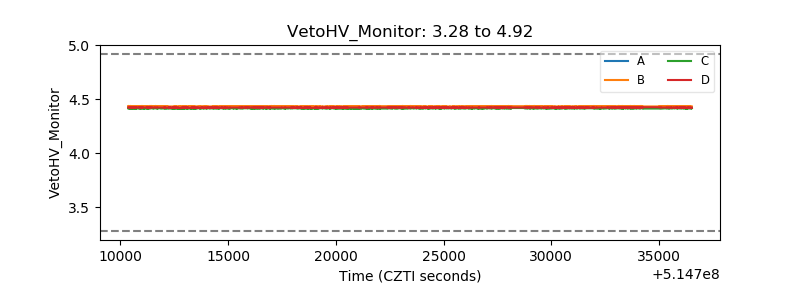 |
| Veto LLD | 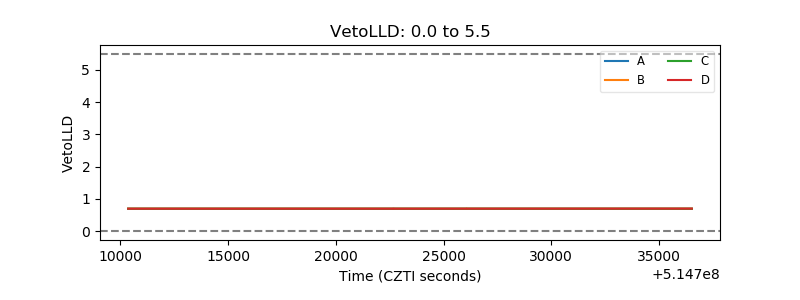 |
| Alpha Counter | 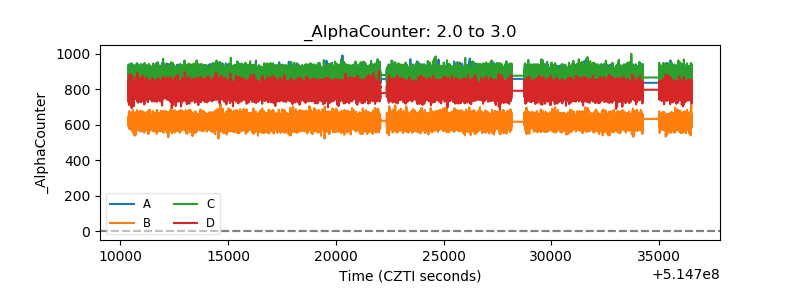 |
| _CPM_Rate | 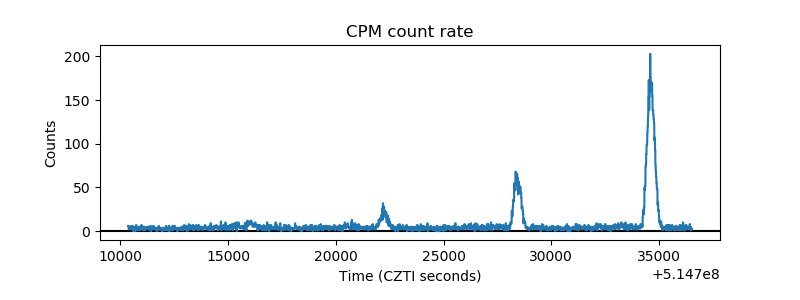 |
| CZT Counter | 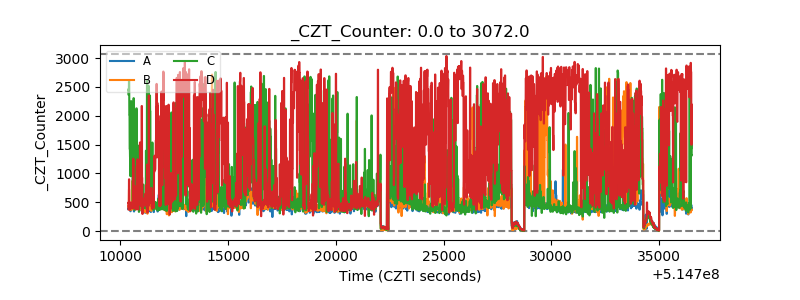 |
| +2.5 Volts monitor | 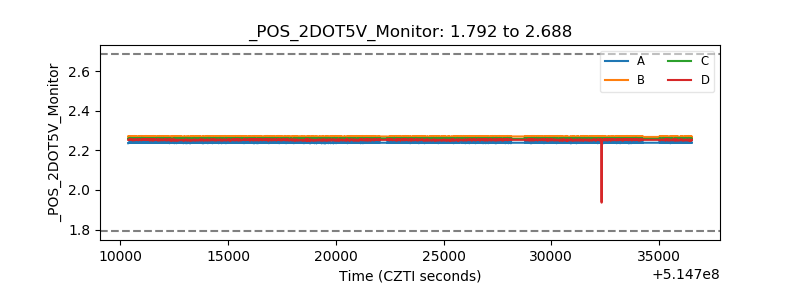 |
| +5 Volts monitor |  |
| _ROLL_ROT | 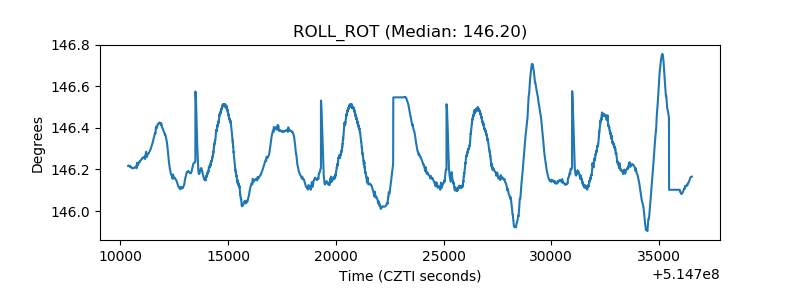 |
| _Roll_DEC | 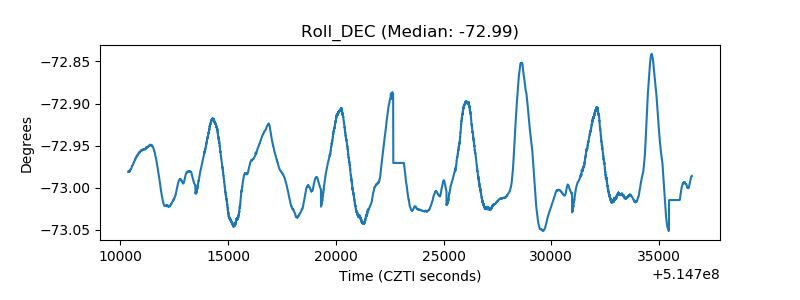 |
| _Roll_RA | 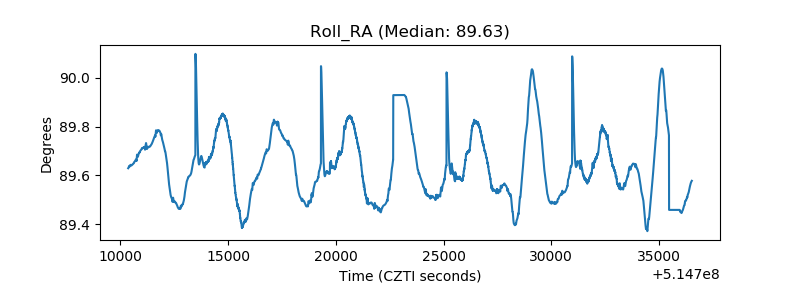 |
| Veto Counter | 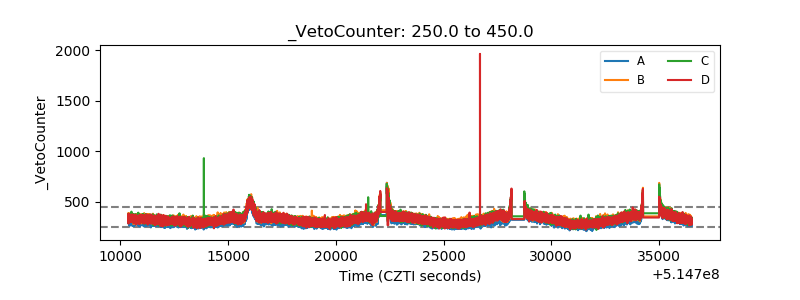 |