| Param | Original file | Final file |
|---|---|---|
| Filename | modeM0/AS1A14_070T08_9000006568_57200cztM0_level2.fits | modeM0/AS1A14_070T08_9000006568_57200cztM0_level2_quad_clean.evt |
| Size (bytes) | 639,763,200 | 83,263,680 |
| Size | 610.1 MB | 79.4 MB |
| Events in quadrant A | 2,842,303 | 611,707 |
| Events in quadrant B | 3,798,183 | 631,752 |
| Events in quadrant C | 5,930,011 | 524,409 |
| Events in quadrant D | 10,617,487 | 308,945 |
| Mode M9 | |||
|---|---|---|---|
| Quadrant | BADHDUFLAG | Total packets | Discarded packets |
| A | 0 | 9 | 0 |
| B | 0 | 9 | 0 |
| C | 0 | 9 | 0 |
| D | 0 | 9 | 0 |
| Mode SS | |||
|---|---|---|---|
| Quadrant | BADHDUFLAG | Total packets | Discarded packets |
| A | 0 | 130 | 0 |
| B | 0 | 130 | 0 |
| C | 0 | 130 | 0 |
| D | 0 | 130 | 0 |
| Mode M0 | |||
|---|---|---|---|
| Quadrant | BADHDUFLAG | Total packets | Discarded packets |
| A | 0 | 13089 | 1 |
| B | 0 | 15843 | 1 |
| C | 0 | 22081 | 1 |
| D | 0 | 35924 | 1 |
| Quadrant | Total seconds | Saturated seconds | Saturation percentage |
|---|---|---|---|
| A | 6363 | 40 | 0.628634% |
| B | 6362 | 335 | 5.265640% |
| C | 6362 | 809 | 12.716127% |
| D | 6362 | 3008 | 47.280729% |
Noise dominated data is calculated using 1-second bins in cleaned event files. If a bin has >2000 counts, and if more than 50% of those come from <1% of pixels, then it is considered to be noise-dominated and hence unusable.
| Quadrant | # 1 sec bins | Bins with >0 counts | Bins with >2000 counts | High rate bins dominated by noise | Noise dominated (total time) | Noise dominated (detector-on time) | Marked lightcurve |
|---|---|---|---|---|---|---|---|
| A | 7298 | 6363 | 4 | 4 | 0.05% | 0.06% | 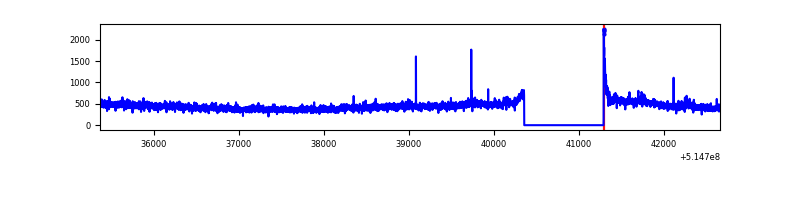 |
| B | 7297 | 6362 | 190 | 190 | 2.60% | 2.99% | 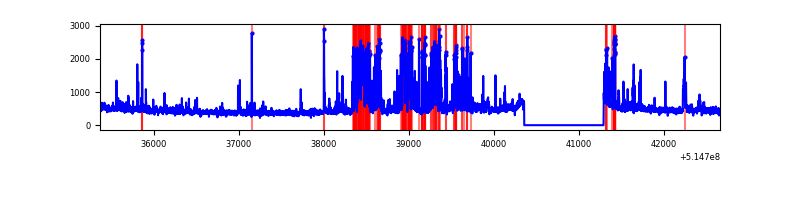 |
| C | 7296 | 6361 | 790 | 790 | 10.83% | 12.42% | 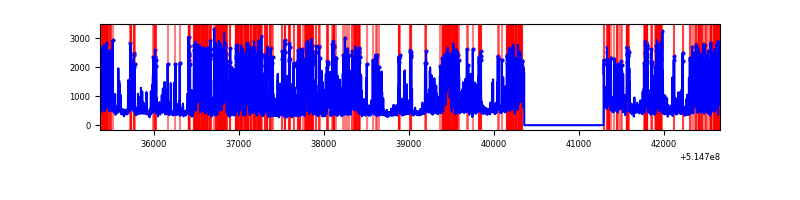 |
| D | 7297 | 6362 | 2985 | 2985 | 40.91% | 46.92% | 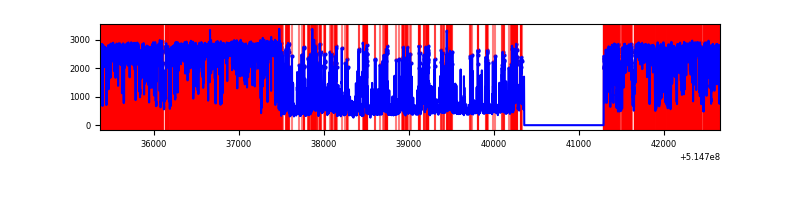 |
Top three noisy pixels from each quadrant. If the there are fewer than three noisy pixels in the level2.evt file, extra rows are filled as -1
| Pixel properties | Quadrant properties | ||||||
|---|---|---|---|---|---|---|---|
| Quadrant | DetID | PixID | Counts | Sigma | Mean | Median | Sigma |
| A | 3 | 14 | 184284 | 1092.93 | 681 | 663 | 168.0 |
| A | 13 | 254 | 10216 | 56.86 | 681 | 663 | 168.0 |
| A | 3 | 137 | 8238 | 45.09 | 681 | 663 | 168.0 |
| B | 5 | 185 | 851047 | 6015.08 | 657 | 633 | 141.4 |
| B | 0 | 183 | 103461 | 727.31 | 657 | 633 | 141.4 |
| B | 10 | 16 | 98276 | 690.64 | 657 | 633 | 141.4 |
| C | 15 | 224 | 3314079 | 19528.66 | 616 | 610 | 169.7 |
| C | 12 | 254 | 54508 | 317.66 | 616 | 610 | 169.7 |
| C | 14 | 254 | 51860 | 302.05 | 616 | 610 | 169.7 |
| D | 12 | 33 | 8065587 | 59498.57 | 470 | 447 | 135.6 |
| D | 2 | 249 | 186393 | 1371.77 | 470 | 447 | 135.6 |
| D | 12 | 3 | 132638 | 975.21 | 470 | 447 | 135.6 |
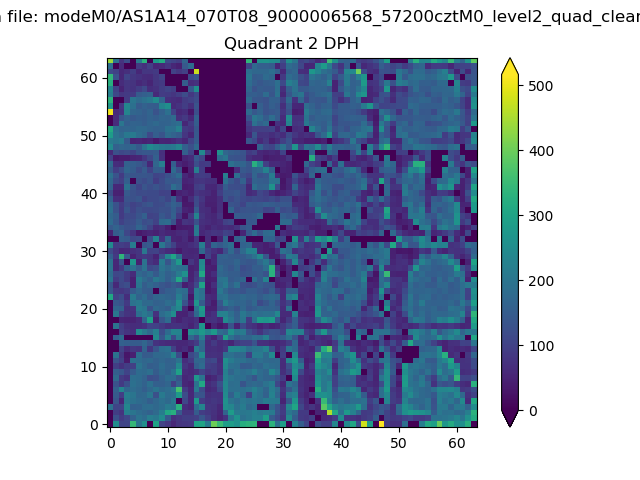
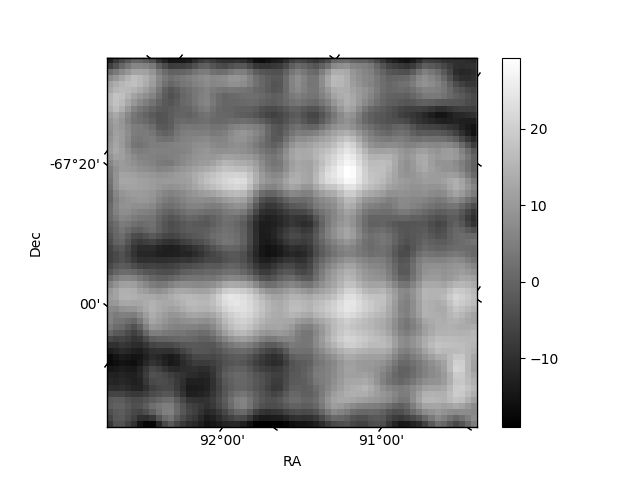
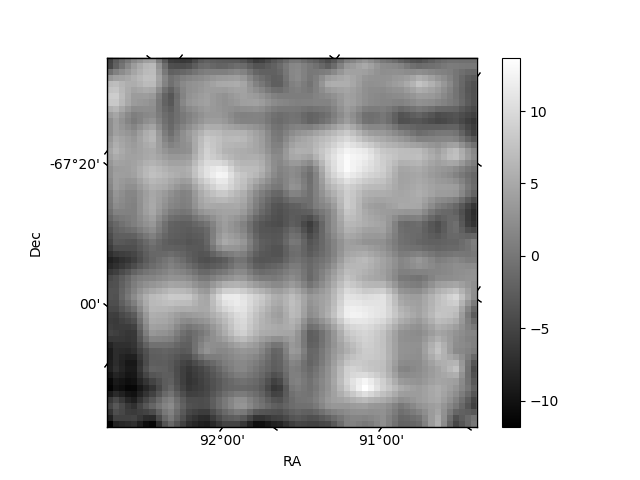
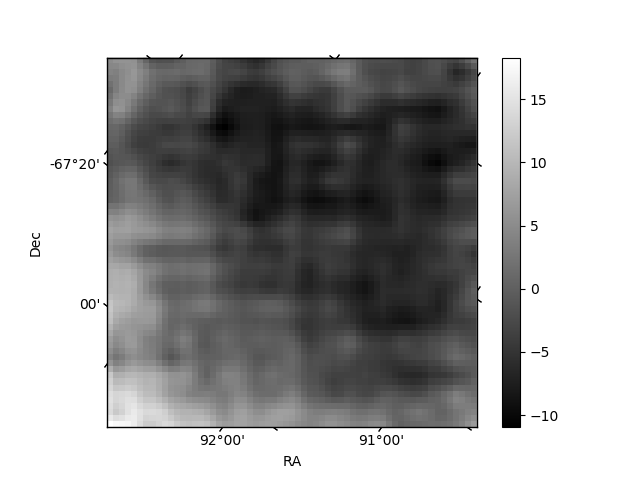
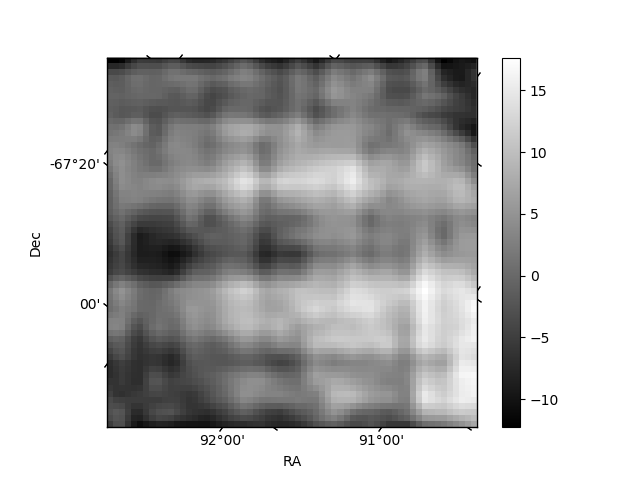
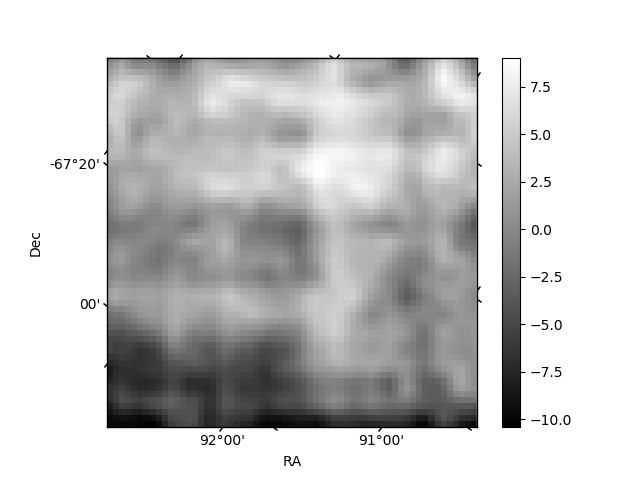
Histogram calculated using DETX and DETY for each event in the final _common_clean file
| Quadrant A | 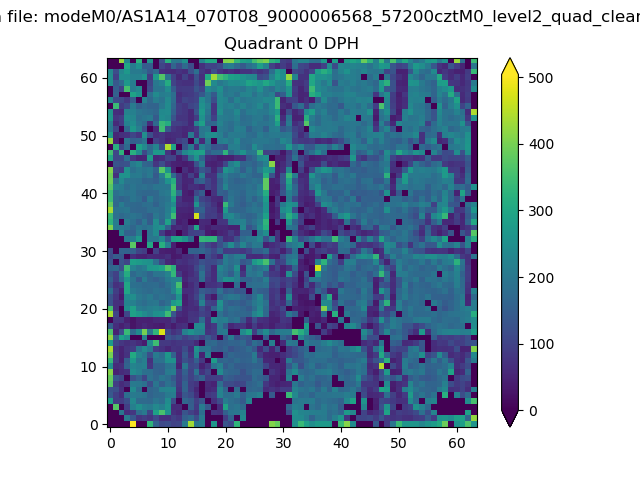 |
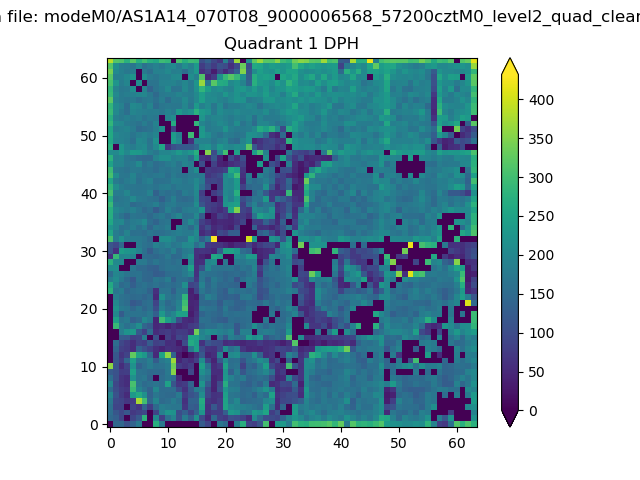 |
Quadrant B |
|---|---|---|---|
| Quadrant D | 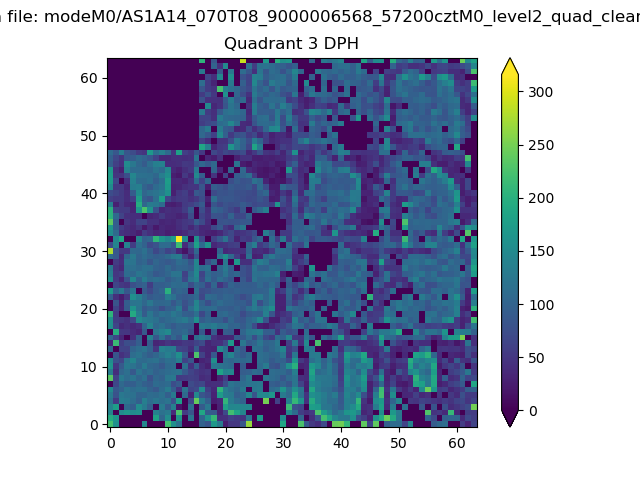 |
 |
Quadrant C |
| Plot type | Count rate plots | Images |
|---|---|---|
| Comparison with Poisson distribution Blue bars denote a histogram of data divided into 1 sec bins. Red curve is a Poisson curve with rate = median count rate of data. |
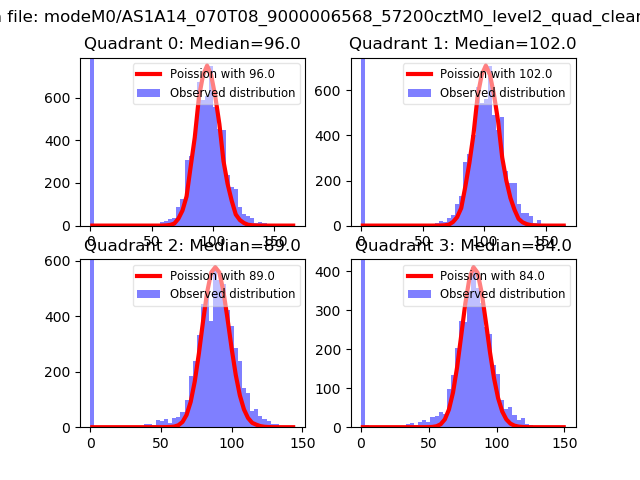 |
 |
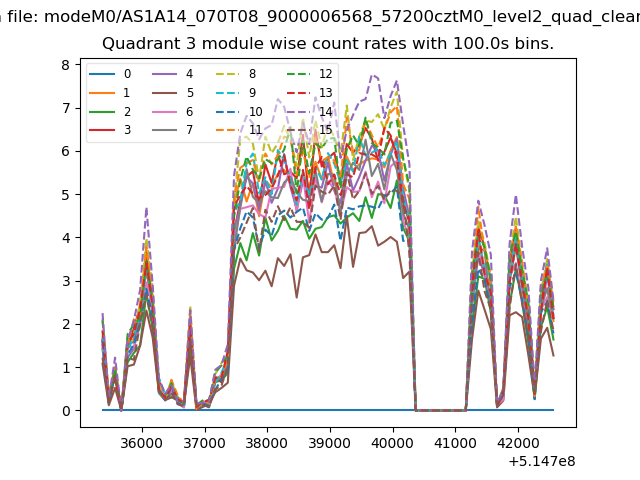
| Quadrant-wise count rates Data is divided into 100 sec bins |
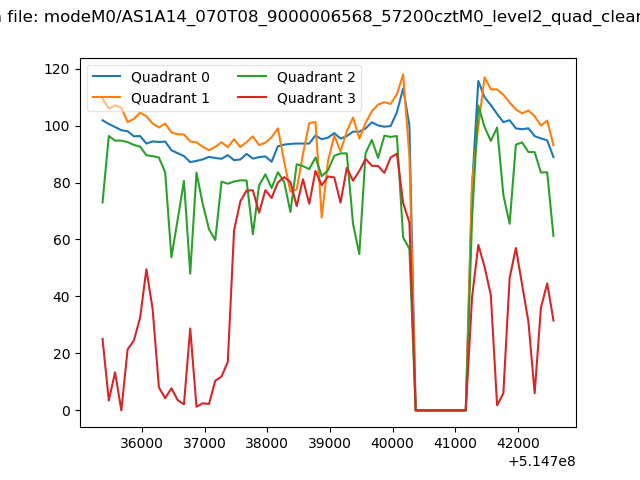 |
|
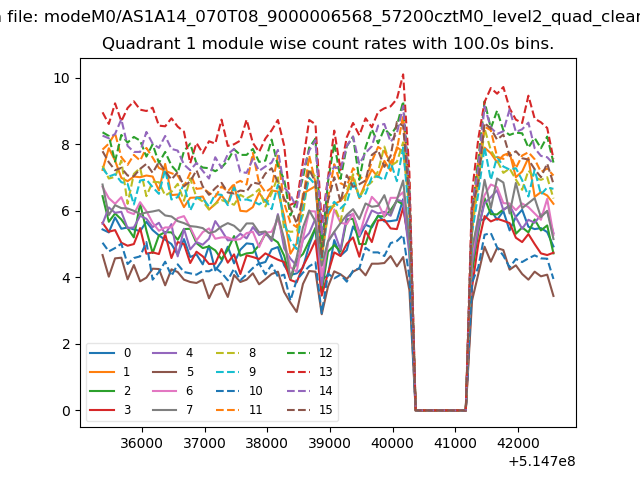
| Module-wise count rates for Quadrant A Data is divided into 100 sec bins |
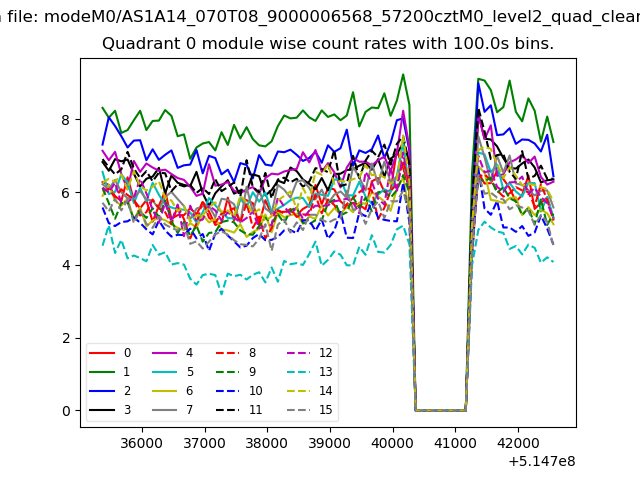 |
 |
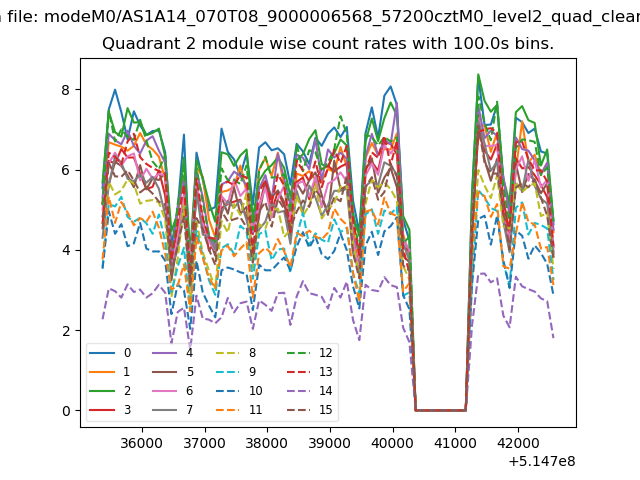
| Module-wise count rates for Quadrant B Data is divided into 100 sec bins |
 |
 |
| Module-wise count rates for Quadrant C Data is divided into 100 sec bins |
 |
 |
| Module-wise count rates for Quadrant D Data is divided into 100 sec bins |
 |
 |
| Parameter | Plot |
|---|---|
| CZT HV Monitor | 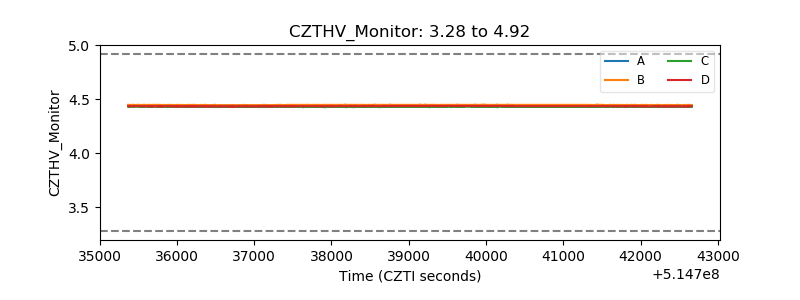 |
| D_VDD | 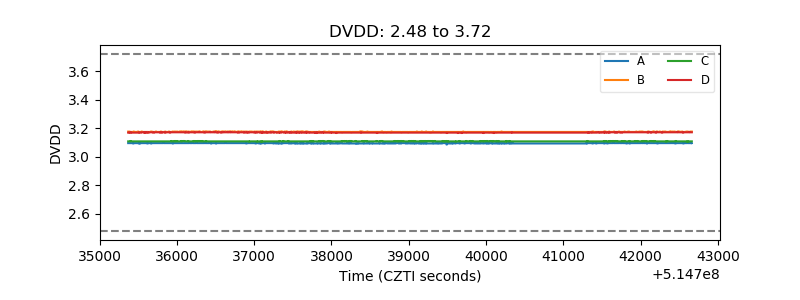 |
| Temperature 1 | 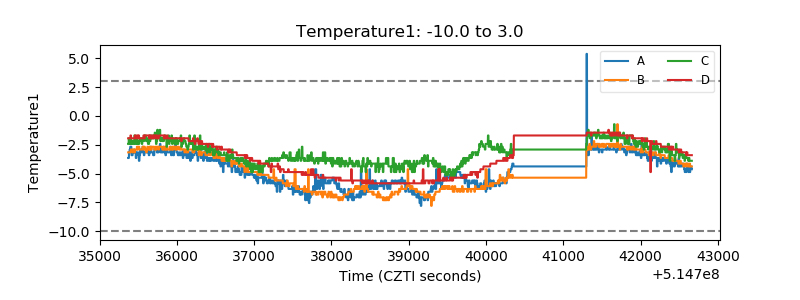 |
| Veto HV Monitor | 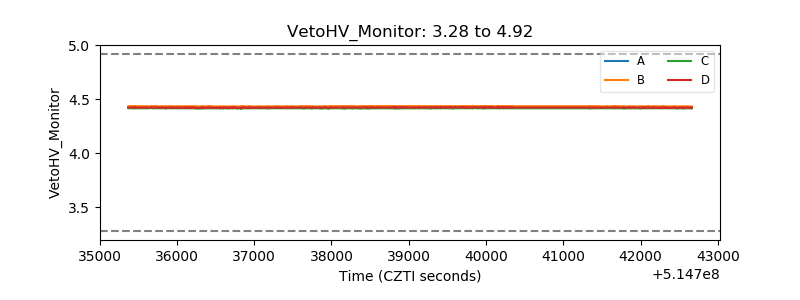 |
| Veto LLD | 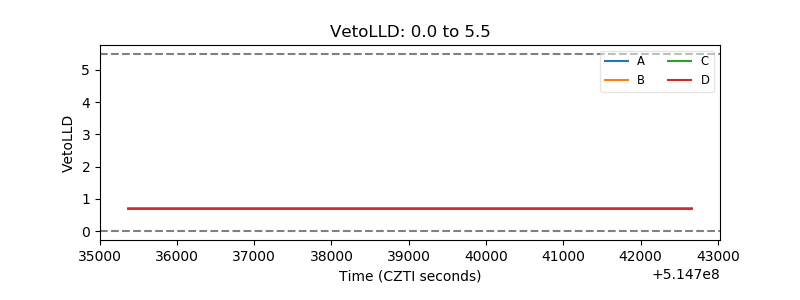 |
| Alpha Counter | 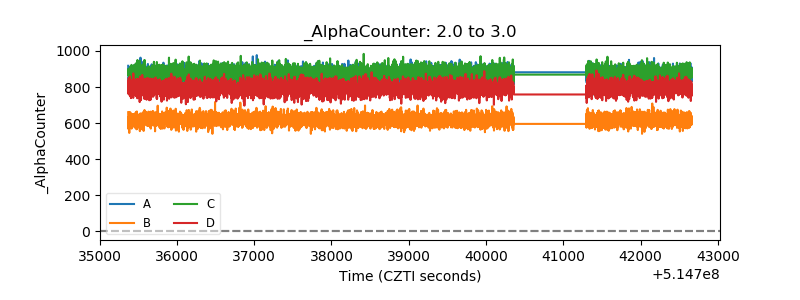 |
| _CPM_Rate | 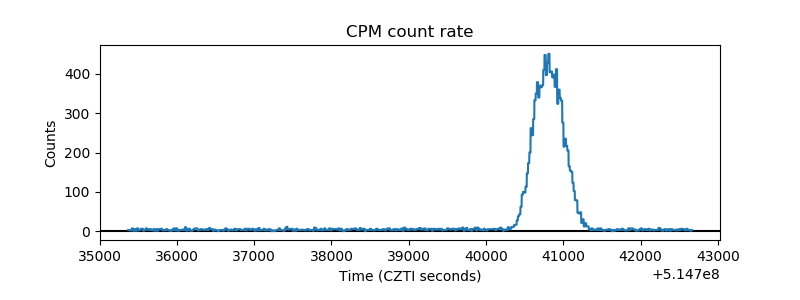 |
| CZT Counter | 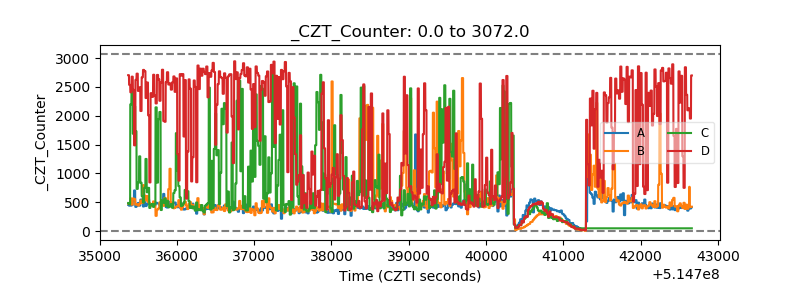 |
| +2.5 Volts monitor | 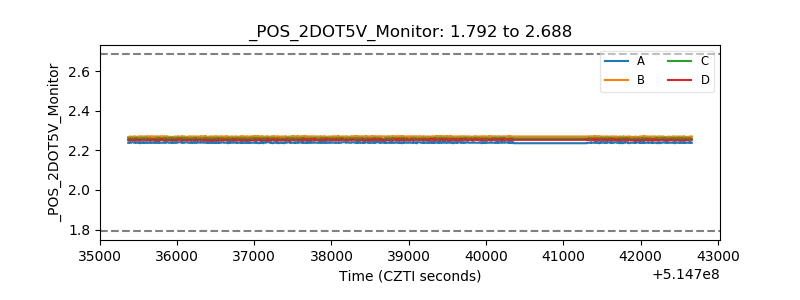 |
| +5 Volts monitor | 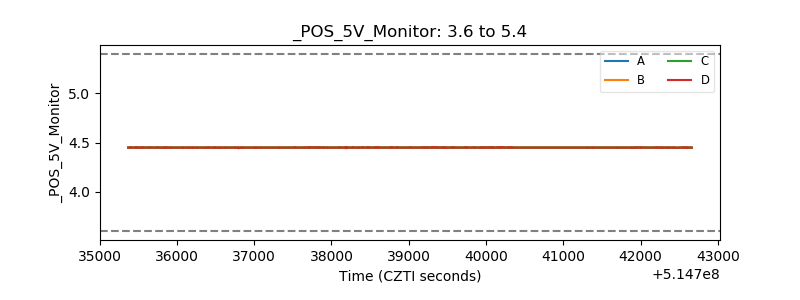 |
| _ROLL_ROT | 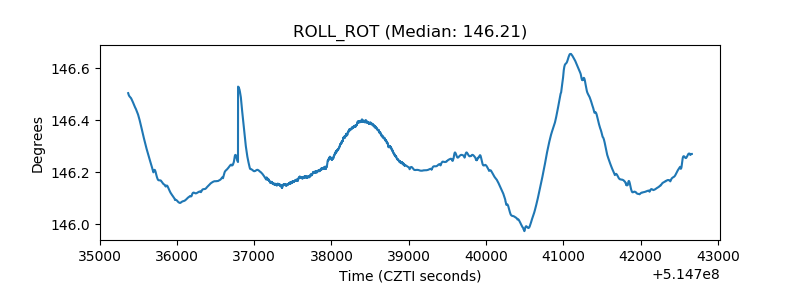 |
| _Roll_DEC | 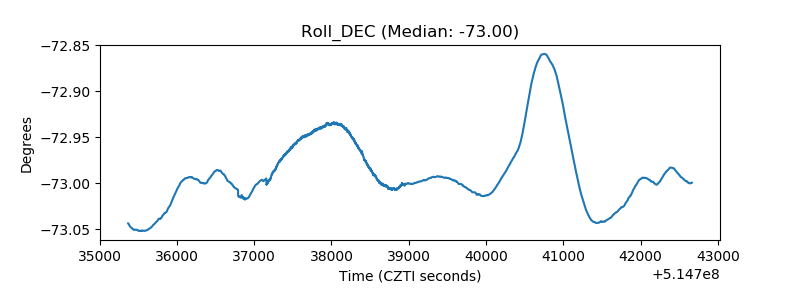 |
| _Roll_RA | 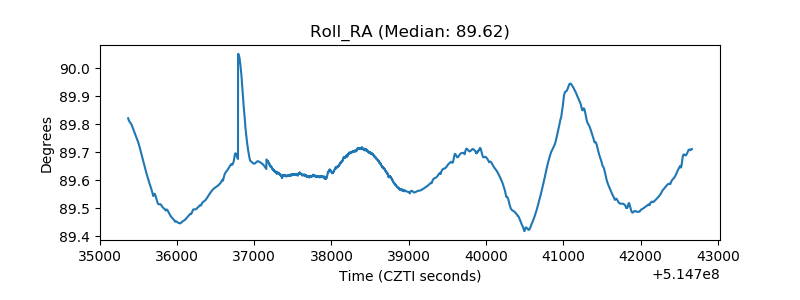 |
| Veto Counter | 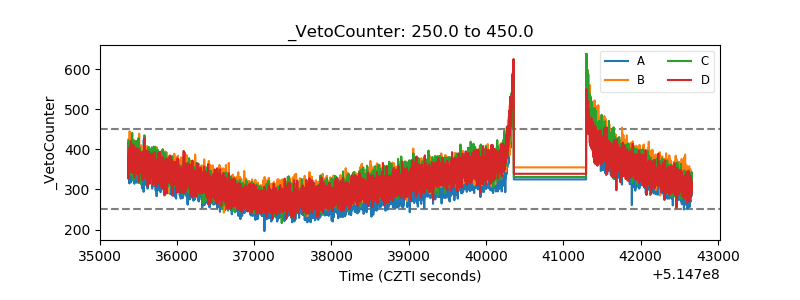 |