| Param | Original file | Final file |
|---|---|---|
| Filename | modeM0/AS1A14_070T08_9000006568_57204cztM0_level2.fits | modeM0/AS1A14_070T08_9000006568_57204cztM0_level2_quad_clean.evt |
| Size (bytes) | 596,309,760 | 87,514,560 |
| Size | 568.7 MB | 83.5 MB |
| Events in quadrant A | 2,754,981 | 642,386 |
| Events in quadrant B | 3,603,715 | 677,708 |
| Events in quadrant C | 5,941,357 | 539,786 |
| Events in quadrant D | 9,281,454 | 348,027 |
| Mode M9 | |||
|---|---|---|---|
| Quadrant | BADHDUFLAG | Total packets | Discarded packets |
| A | 0 | 18 | 0 |
| B | 0 | 19 | 0 |
| C | 0 | 19 | 0 |
| D | 0 | 19 | 0 |
| Mode SS | |||
|---|---|---|---|
| Quadrant | BADHDUFLAG | Total packets | Discarded packets |
| A | 0 | 128 | 0 |
| B | 0 | 128 | 0 |
| C | 0 | 128 | 0 |
| D | 0 | 128 | 0 |
| Mode M0 | |||
|---|---|---|---|
| Quadrant | BADHDUFLAG | Total packets | Discarded packets |
| A | 0 | 12950 | 2 |
| B | 0 | 15238 | 2 |
| C | 0 | 22122 | 6 |
| D | 0 | 32006 | 2 |
| Quadrant | Total seconds | Saturated seconds | Saturation percentage |
|---|---|---|---|
| A | 6333 | 12 | 0.189484% |
| B | 6333 | 201 | 3.173851% |
| C | 6332 | 847 | 13.376500% |
| D | 6332 | 2473 | 39.055591% |
Noise dominated data is calculated using 1-second bins in cleaned event files. If a bin has >2000 counts, and if more than 50% of those come from <1% of pixels, then it is considered to be noise-dominated and hence unusable.
| Quadrant | # 1 sec bins | Bins with >0 counts | Bins with >2000 counts | High rate bins dominated by noise | Noise dominated (total time) | Noise dominated (detector-on time) | Marked lightcurve |
|---|---|---|---|---|---|---|---|
| A | 7547 | 6332 | 3 | 3 | 0.04% | 0.05% | 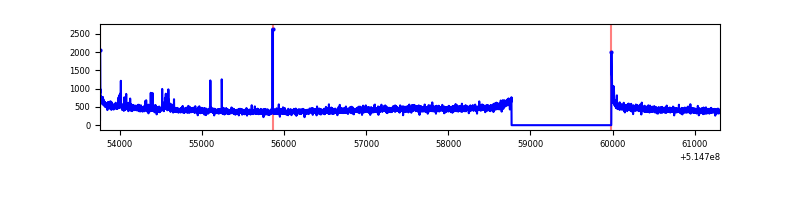 |
| B | 7547 | 6332 | 136 | 136 | 1.80% | 2.15% | 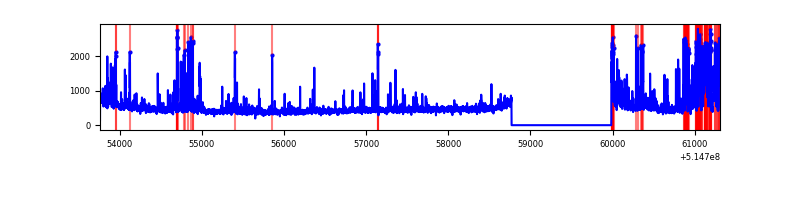 |
| C | 7546 | 6331 | 800 | 800 | 10.60% | 12.64% | 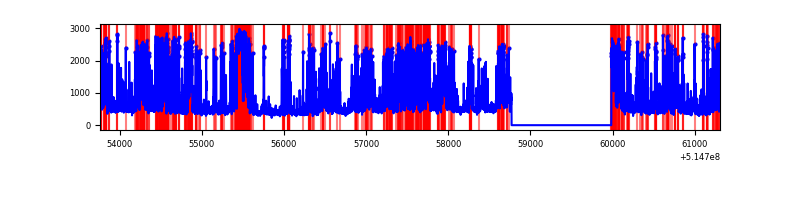 |
| D | 7546 | 6331 | 2468 | 2468 | 32.71% | 38.98% | 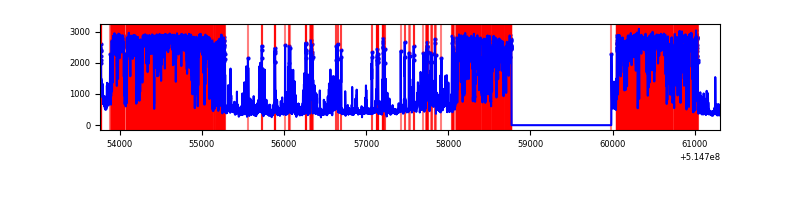 |
Top three noisy pixels from each quadrant. If the there are fewer than three noisy pixels in the level2.evt file, extra rows are filled as -1
| Pixel properties | Quadrant properties | ||||||
|---|---|---|---|---|---|---|---|
| Quadrant | DetID | PixID | Counts | Sigma | Mean | Median | Sigma |
| A | 3 | 14 | 31467 | 181.96 | 687 | 670 | 169.3 |
| A | 8 | 6 | 17175 | 97.52 | 687 | 670 | 169.3 |
| A | 13 | 248 | 15461 | 87.39 | 687 | 670 | 169.3 |
| B | 5 | 185 | 495498 | 3377.89 | 679 | 653 | 146.5 |
| B | 7 | 252 | 119697 | 812.61 | 679 | 653 | 146.5 |
| B | 10 | 16 | 75653 | 511.96 | 679 | 653 | 146.5 |
| C | 15 | 224 | 3301167 | 19246.33 | 622 | 615 | 171.5 |
| C | 14 | 254 | 74048 | 428.21 | 622 | 615 | 171.5 |
| C | 7 | 247 | 34457 | 197.34 | 622 | 615 | 171.5 |
| D | 12 | 33 | 6625147 | 46969.6 | 490 | 465 | 141.0 |
| D | 2 | 249 | 225153 | 1593.06 | 490 | 465 | 141.0 |
| D | 12 | 128 | 195954 | 1386.03 | 490 | 465 | 141.0 |
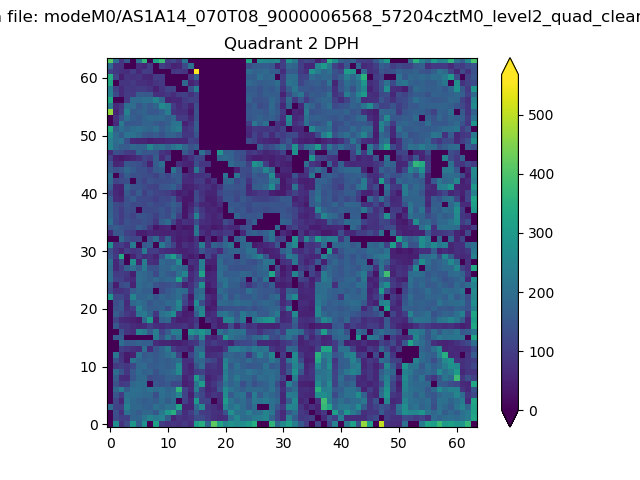
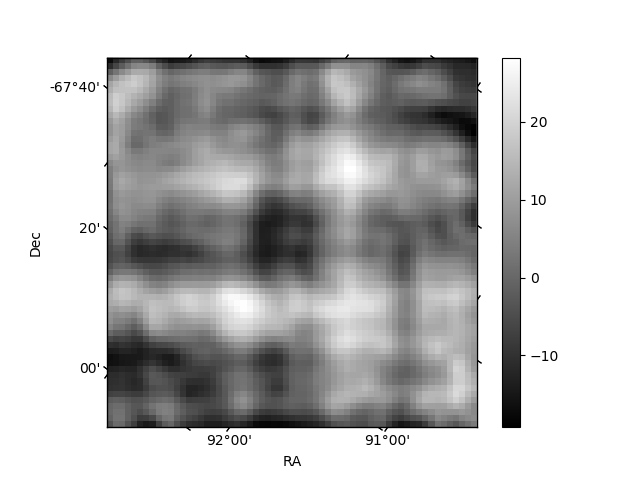
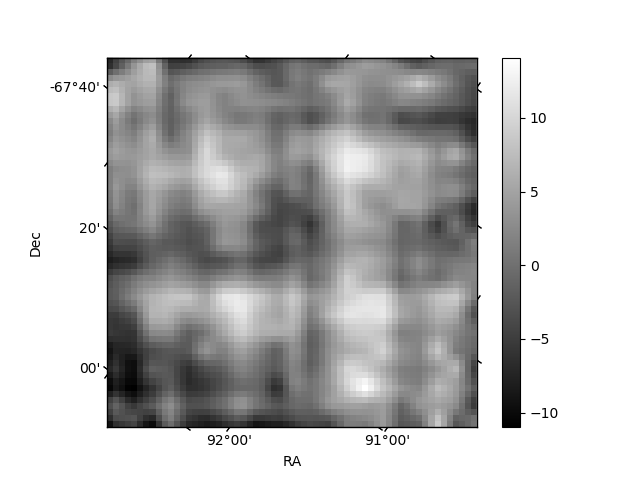
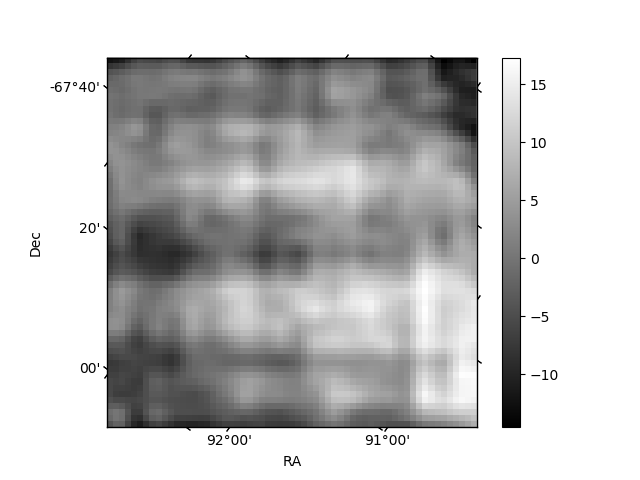
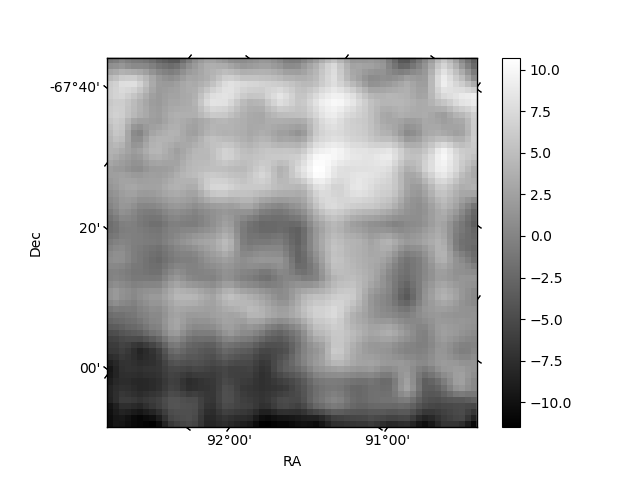
Histogram calculated using DETX and DETY for each event in the final _common_clean file
| Quadrant A | 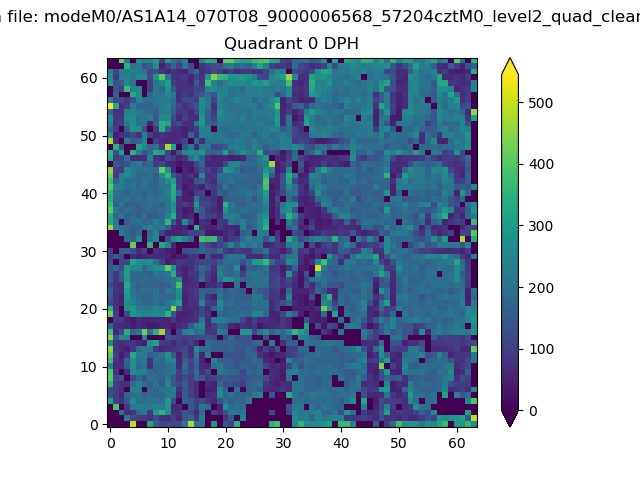 |
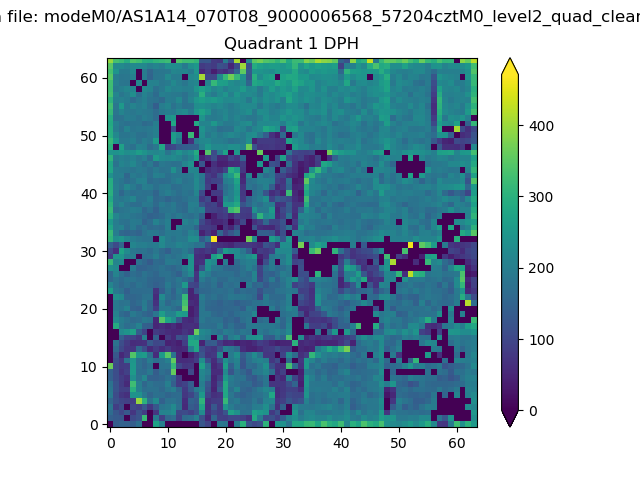 |
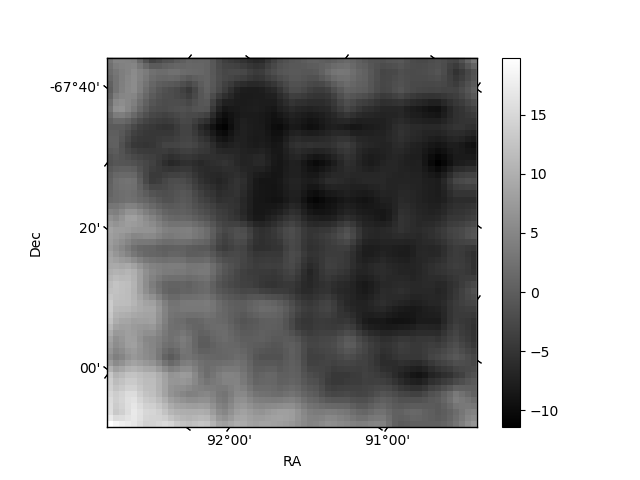
Quadrant B |
|---|---|---|---|
| Quadrant D | 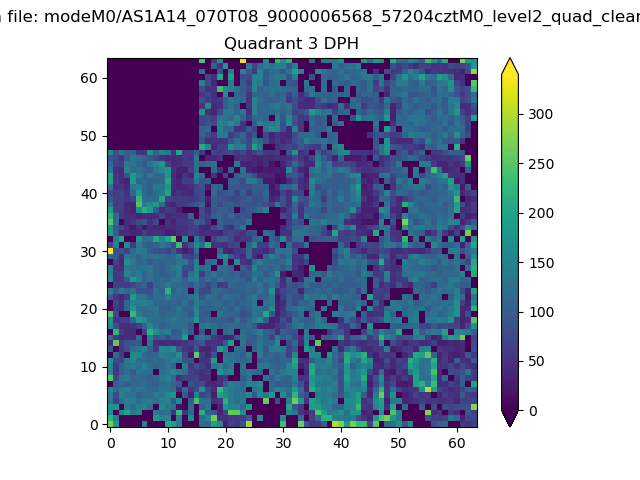 |
 |
Quadrant C |
| Plot type | Count rate plots | Images |
|---|---|---|
| Comparison with Poisson distribution Blue bars denote a histogram of data divided into 1 sec bins. Red curve is a Poisson curve with rate = median count rate of data. |
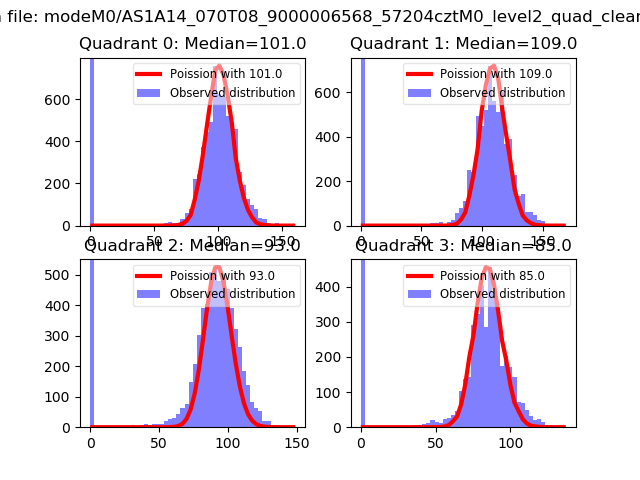 |
 |
| Quadrant-wise count rates Data is divided into 100 sec bins |
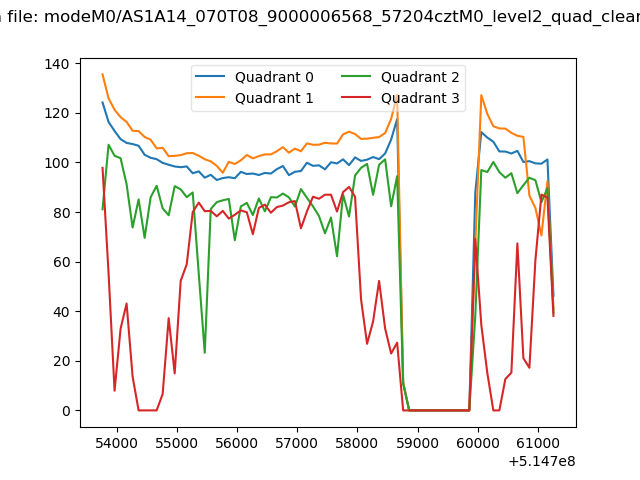 |
|
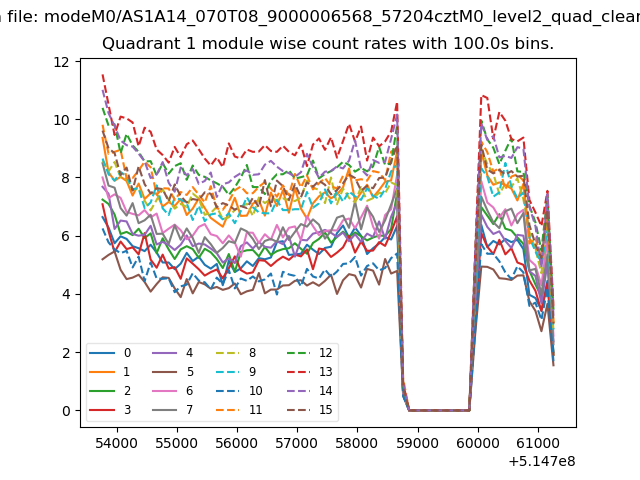
| Module-wise count rates for Quadrant A Data is divided into 100 sec bins |
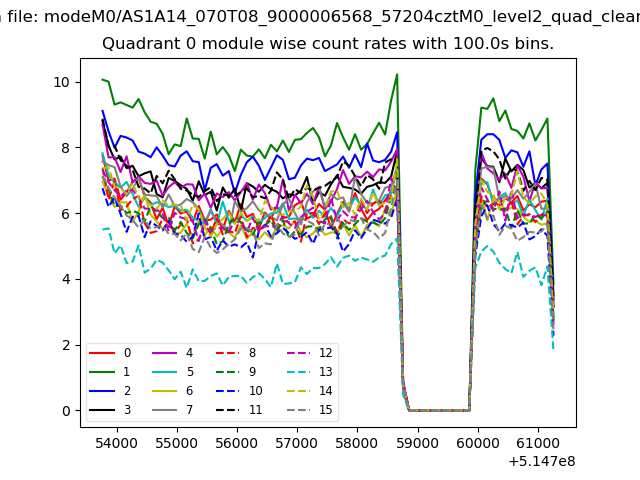 |
 |
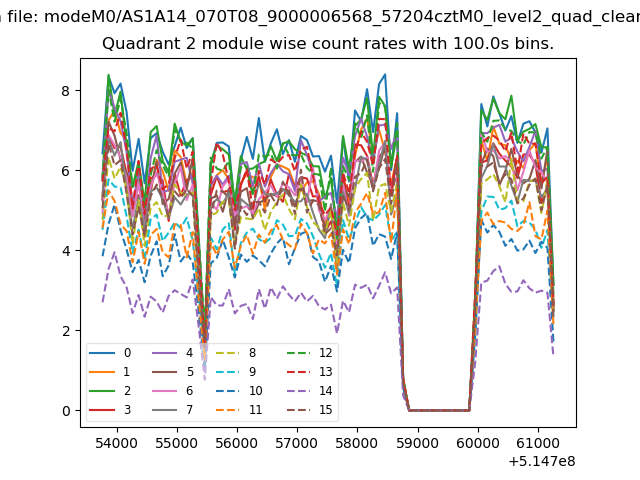
| Module-wise count rates for Quadrant B Data is divided into 100 sec bins |
 |
 |
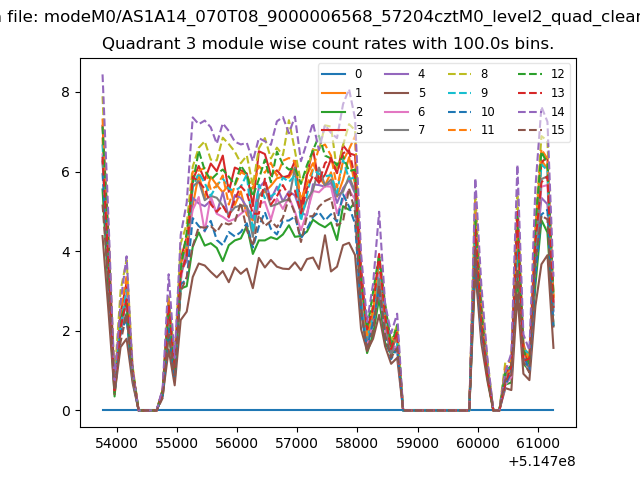
| Module-wise count rates for Quadrant C Data is divided into 100 sec bins |
 |
 |
| Module-wise count rates for Quadrant D Data is divided into 100 sec bins |
 |
 |
| Parameter | Plot |
|---|---|
| CZT HV Monitor | 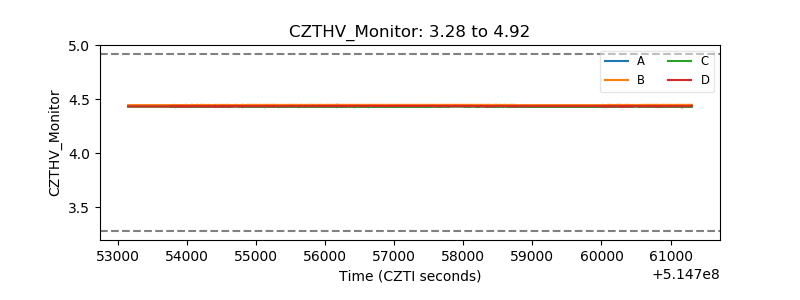 |
| D_VDD | 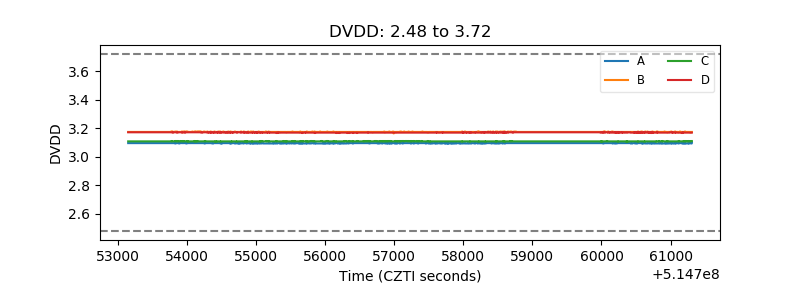 |
| Temperature 1 | 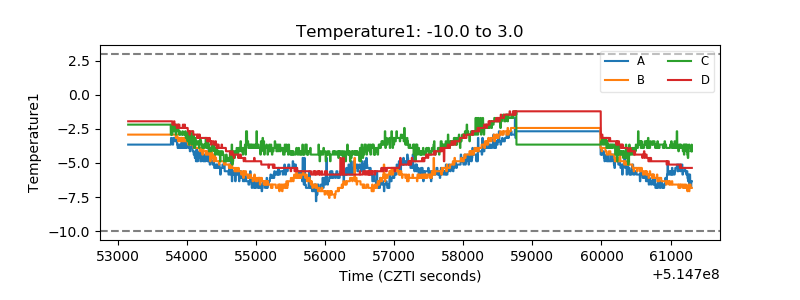 |
| Veto HV Monitor | 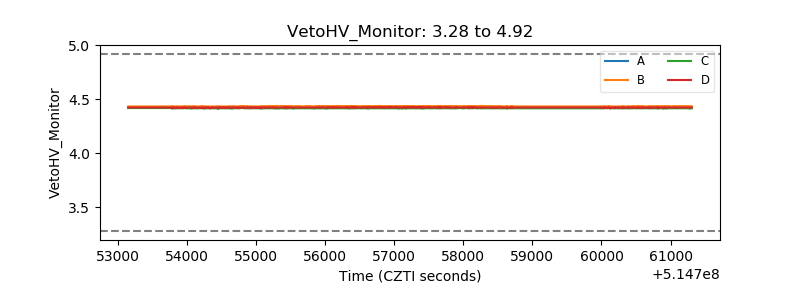 |
| Veto LLD | 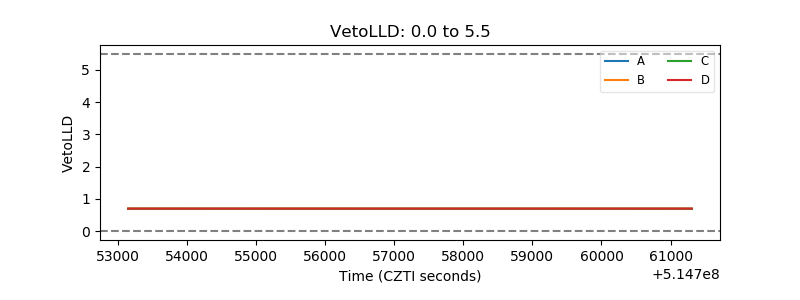 |
| Alpha Counter | 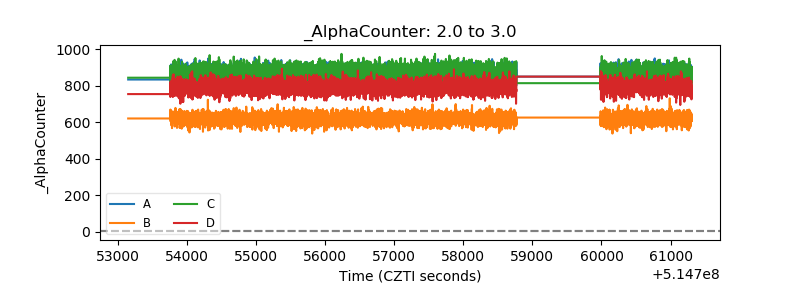 |
| _CPM_Rate | 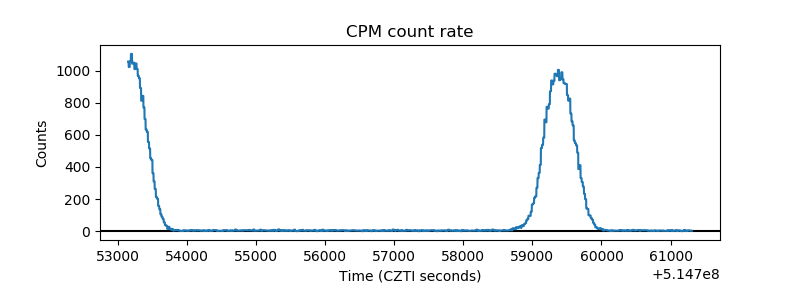 |
| CZT Counter | 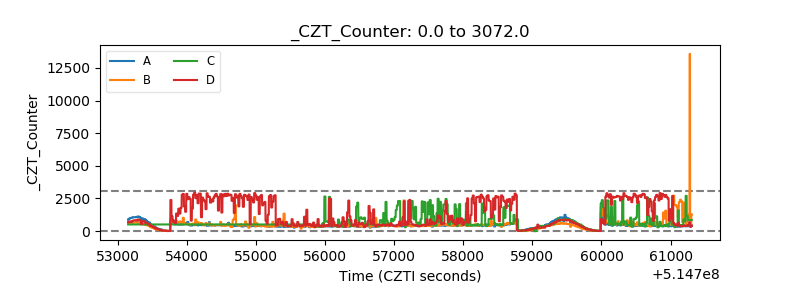 |
| +2.5 Volts monitor | 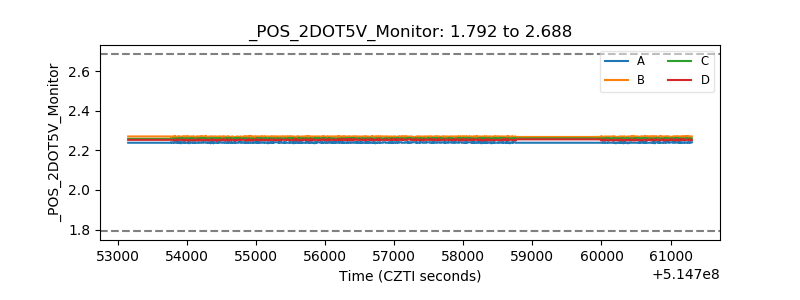 |
| +5 Volts monitor | 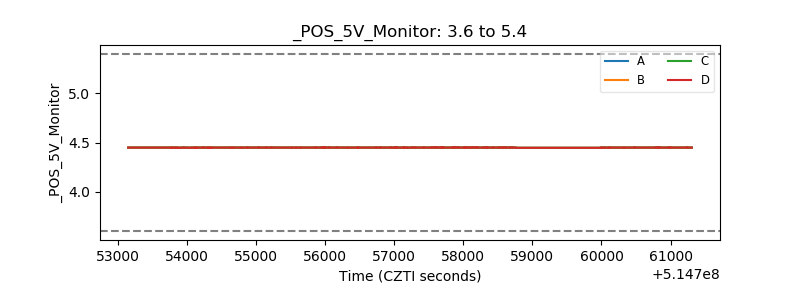 |
| _ROLL_ROT | 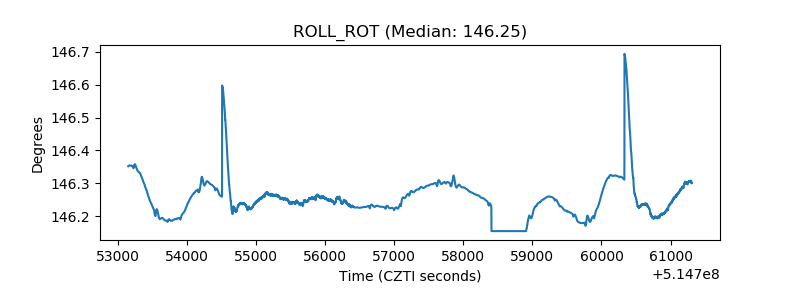 |
| _Roll_DEC | 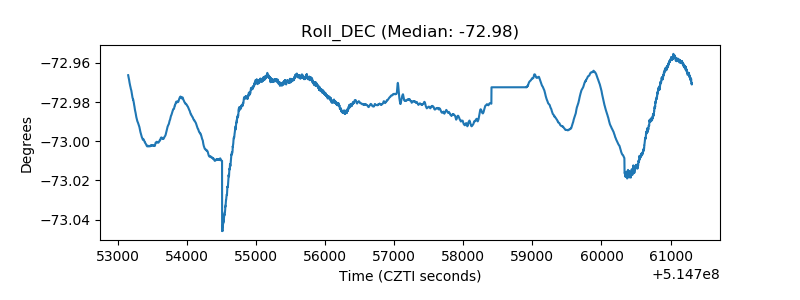 |
| _Roll_RA | 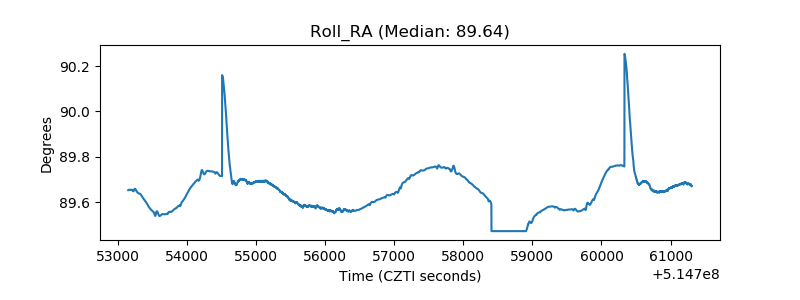 |
| Veto Counter | 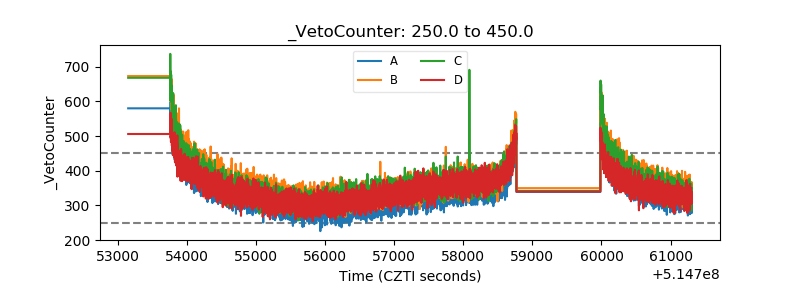 |