| Param | Original file | Final file |
|---|---|---|
| Filename | modeM0/AS1A14_070T08_9000006568_57205cztM0_level2.fits | modeM0/AS1A14_070T08_9000006568_57205cztM0_level2_quad_clean.evt |
| Size (bytes) | 602,254,080 | 87,531,840 |
| Size | 574.4 MB | 83.5 MB |
| Events in quadrant A | 2,726,071 | 639,395 |
| Events in quadrant B | 4,296,383 | 656,108 |
| Events in quadrant C | 5,348,399 | 563,699 |
| Events in quadrant D | 9,427,180 | 346,332 |
| Mode M9 | |||
|---|---|---|---|
| Quadrant | BADHDUFLAG | Total packets | Discarded packets |
| A | 0 | 22 | 0 |
| B | 0 | 23 | 0 |
| C | 0 | 23 | 0 |
| D | 0 | 23 | 0 |
| Mode SS | |||
|---|---|---|---|
| Quadrant | BADHDUFLAG | Total packets | Discarded packets |
| A | 0 | 128 | 0 |
| B | 0 | 128 | 0 |
| C | 0 | 128 | 0 |
| D | 0 | 128 | 0 |
| Mode M0 | |||
|---|---|---|---|
| Quadrant | BADHDUFLAG | Total packets | Discarded packets |
| A | 0 | 13019 | 2 |
| B | 0 | 17186 | 2 |
| C | 0 | 20389 | 4 |
| D | 0 | 32505 | 2 |
| Quadrant | Total seconds | Saturated seconds | Saturation percentage |
|---|---|---|---|
| A | 6378 | 30 | 0.470367% |
| B | 6378 | 444 | 6.961430% |
| C | 6377 | 548 | 8.593382% |
| D | 6377 | 2573 | 40.348126% |
Noise dominated data is calculated using 1-second bins in cleaned event files. If a bin has >2000 counts, and if more than 50% of those come from <1% of pixels, then it is considered to be noise-dominated and hence unusable.
| Quadrant | # 1 sec bins | Bins with >0 counts | Bins with >2000 counts | High rate bins dominated by noise | Noise dominated (total time) | Noise dominated (detector-on time) | Marked lightcurve |
|---|---|---|---|---|---|---|---|
| A | 7552 | 6378 | 4 | 4 | 0.05% | 0.06% | 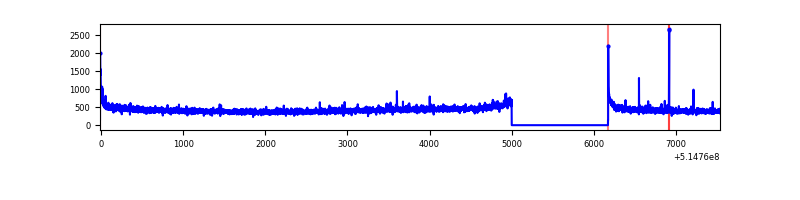 |
| B | 7552 | 6378 | 332 | 332 | 4.40% | 5.21% | 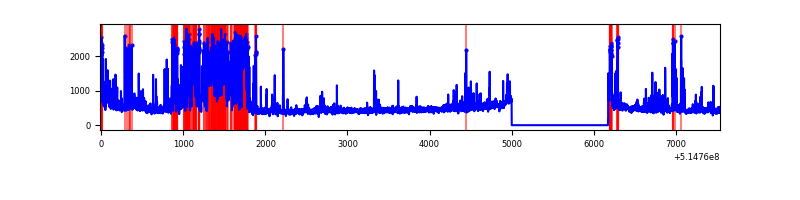 |
| C | 7551 | 6377 | 519 | 519 | 6.87% | 8.14% | 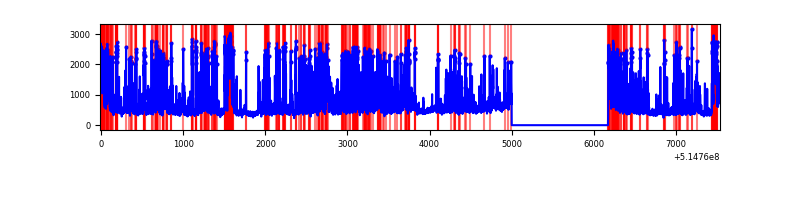 |
| D | 7551 | 6377 | 2637 | 2637 | 34.92% | 41.35% | 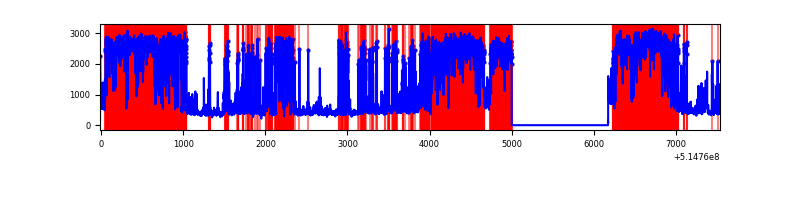 |
Top three noisy pixels from each quadrant. If the there are fewer than three noisy pixels in the level2.evt file, extra rows are filled as -1
| Pixel properties | Quadrant properties | ||||||
|---|---|---|---|---|---|---|---|
| Quadrant | DetID | PixID | Counts | Sigma | Mean | Median | Sigma |
| A | 10 | 251 | 12615 | 70.0 | 687 | 669 | 170.7 |
| A | 8 | 6 | 11543 | 63.72 | 687 | 669 | 170.7 |
| A | 3 | 14 | 10866 | 59.75 | 687 | 669 | 170.7 |
| B | 5 | 185 | 1231763 | 8683.39 | 668 | 644 | 141.8 |
| B | 10 | 16 | 127774 | 896.68 | 668 | 644 | 141.8 |
| B | 10 | 247 | 74989 | 524.37 | 668 | 644 | 141.8 |
| C | 15 | 224 | 2632935 | 14979.95 | 641 | 633 | 175.7 |
| C | 13 | 3 | 97177 | 549.41 | 641 | 633 | 175.7 |
| C | 14 | 254 | 44487 | 249.57 | 641 | 633 | 175.7 |
| D | 12 | 33 | 6914563 | 47928.53 | 503 | 478 | 144.3 |
| D | 2 | 249 | 123391 | 852.03 | 503 | 478 | 144.3 |
| D | 7 | 96 | 120502 | 832.01 | 503 | 478 | 144.3 |
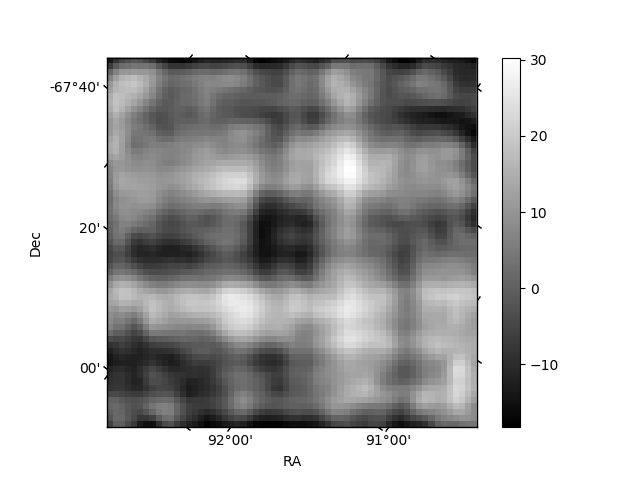
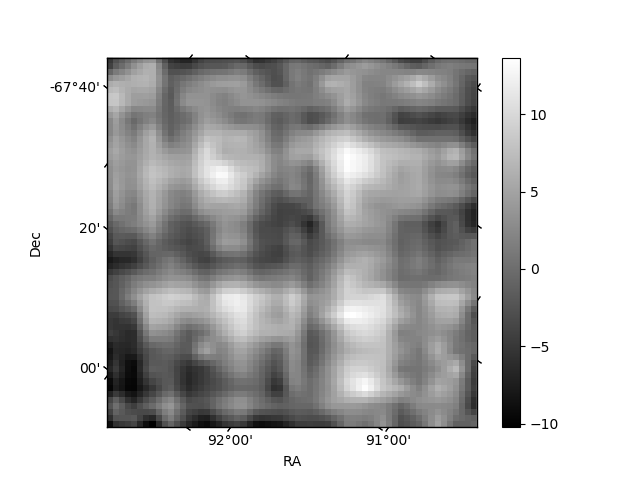
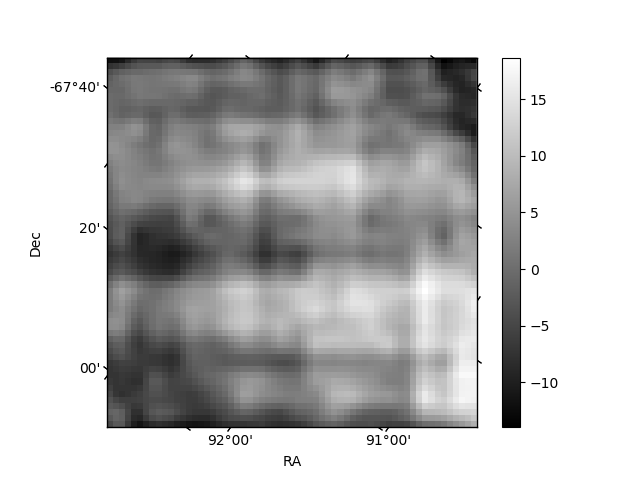
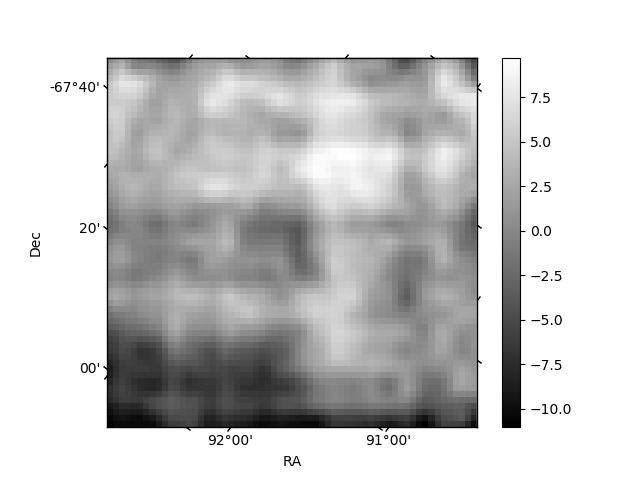
Histogram calculated using DETX and DETY for each event in the final _common_clean file
| Quadrant A | 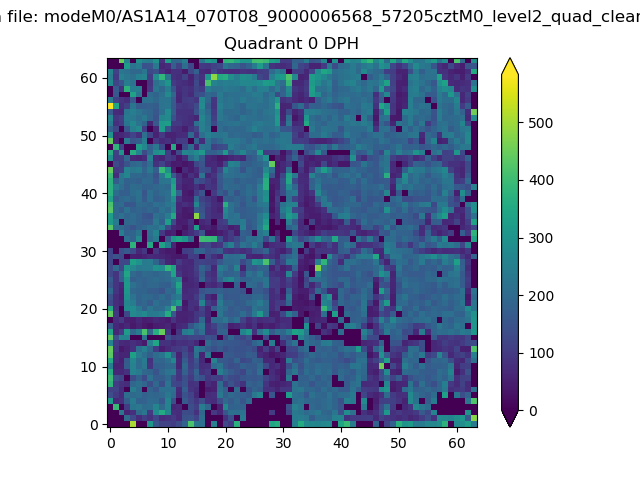 |
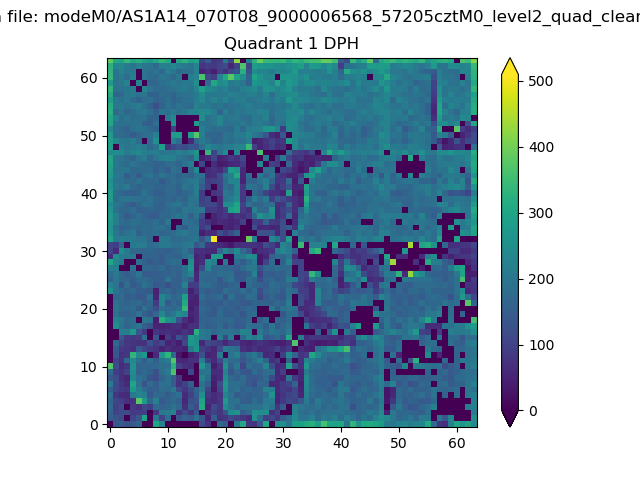 |
Quadrant B |
|---|---|---|---|
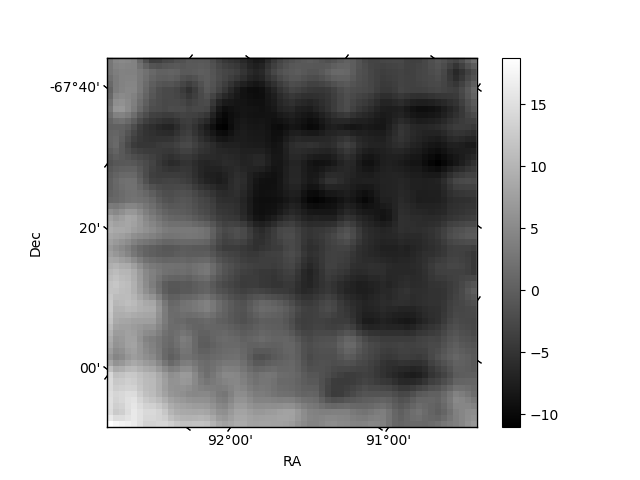
| Quadrant D | 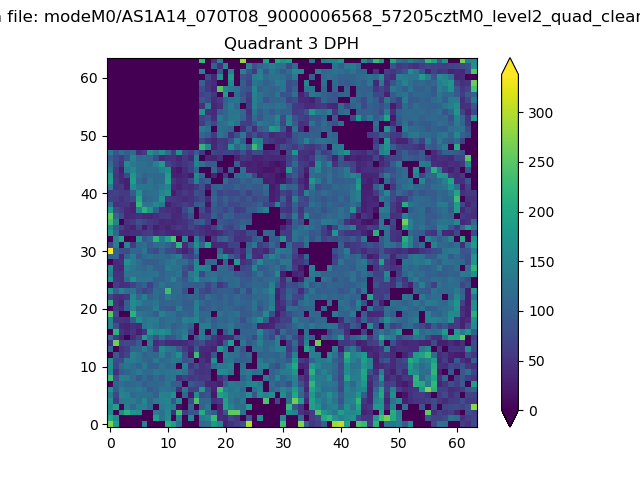 |
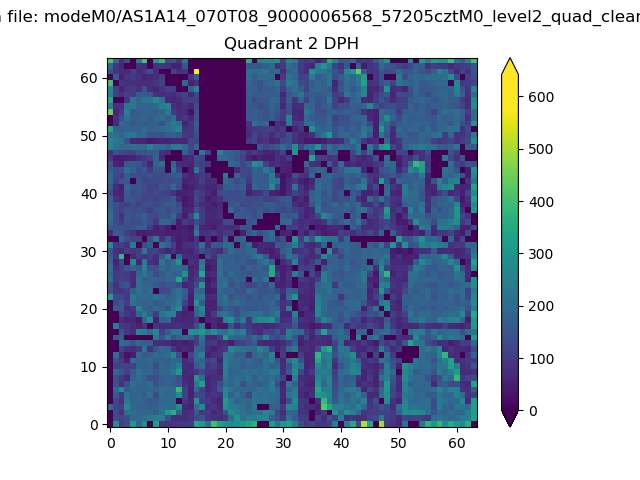 |
Quadrant C |
| Plot type | Count rate plots | Images |
|---|---|---|
| Comparison with Poisson distribution Blue bars denote a histogram of data divided into 1 sec bins. Red curve is a Poisson curve with rate = median count rate of data. |
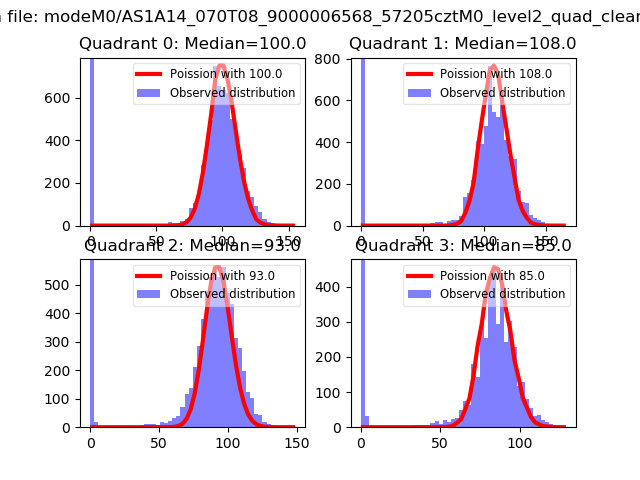 |
 |
| Quadrant-wise count rates Data is divided into 100 sec bins |
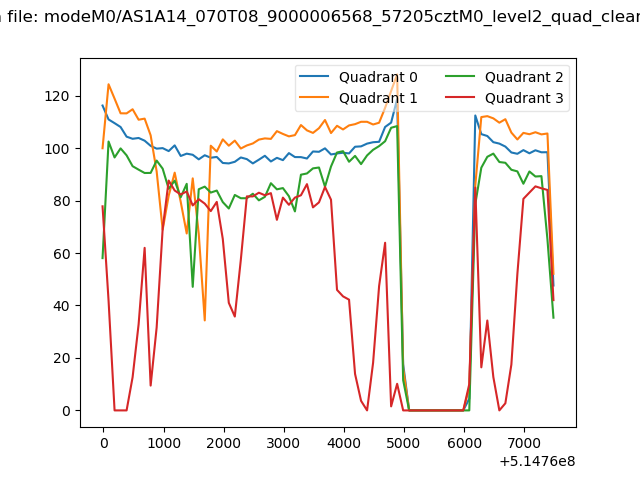 |
|
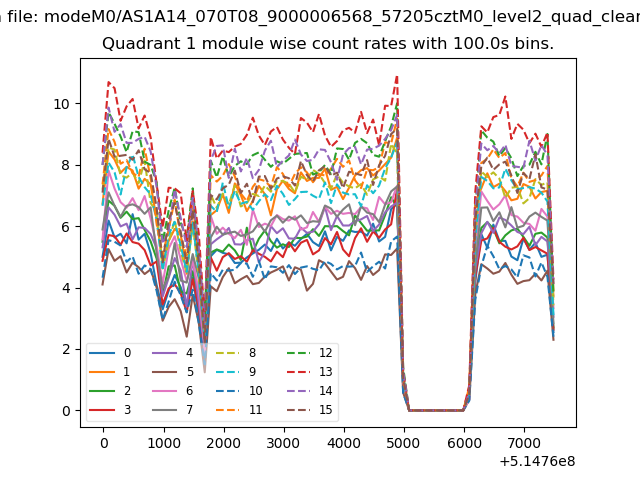
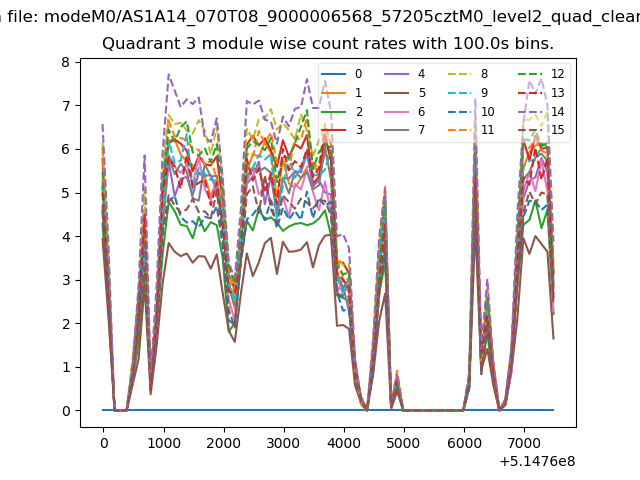
| Module-wise count rates for Quadrant A Data is divided into 100 sec bins |
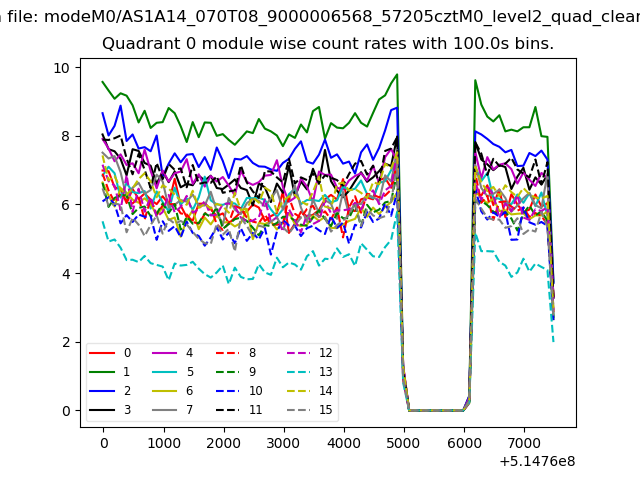 |
 |
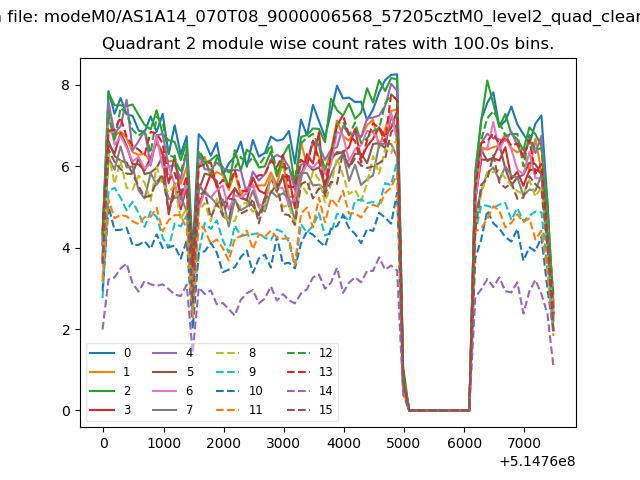
| Module-wise count rates for Quadrant B Data is divided into 100 sec bins |
 |
 |
| Module-wise count rates for Quadrant C Data is divided into 100 sec bins |
 |
 |
| Module-wise count rates for Quadrant D Data is divided into 100 sec bins |
 |
 |
| Parameter | Plot |
|---|---|
| CZT HV Monitor | 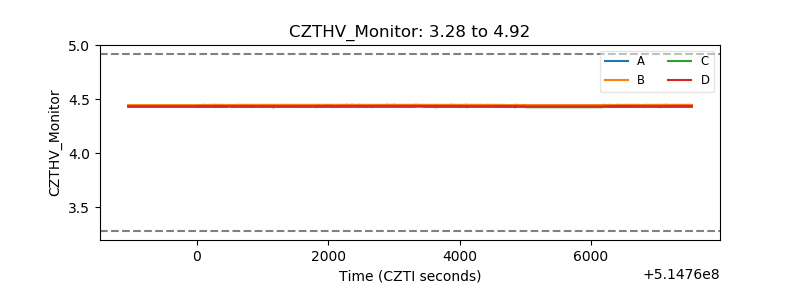 |
| D_VDD | 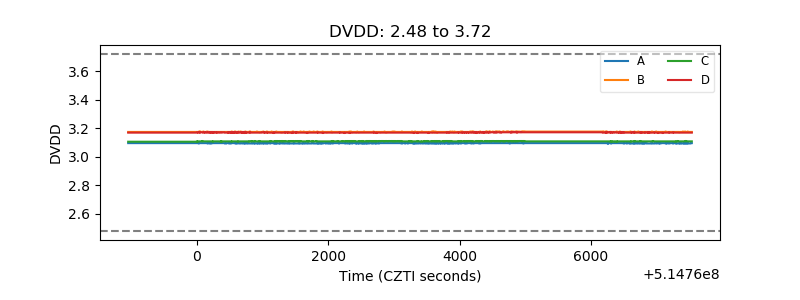 |
| Temperature 1 | 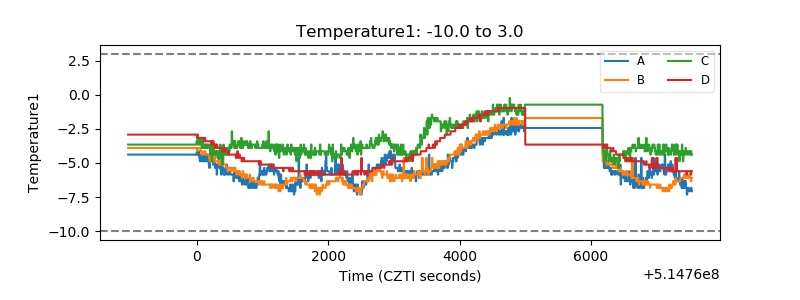 |
| Veto HV Monitor | 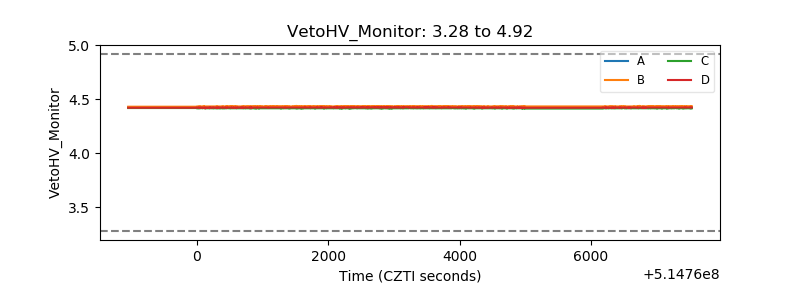 |
| Veto LLD | 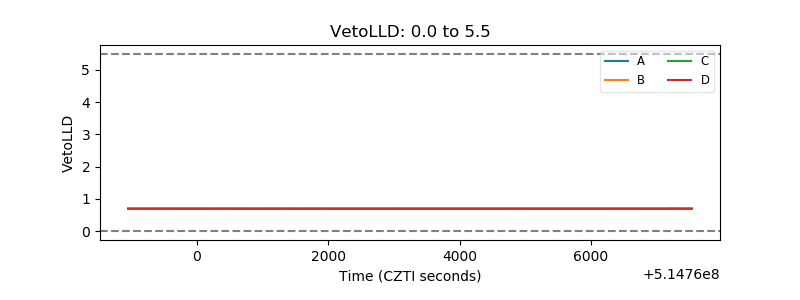 |
| Alpha Counter | 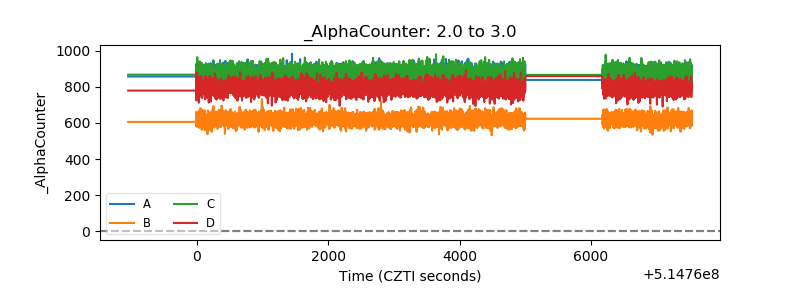 |
| _CPM_Rate | 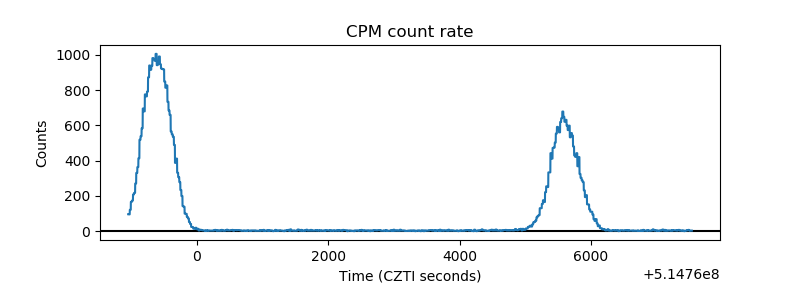 |
| CZT Counter | 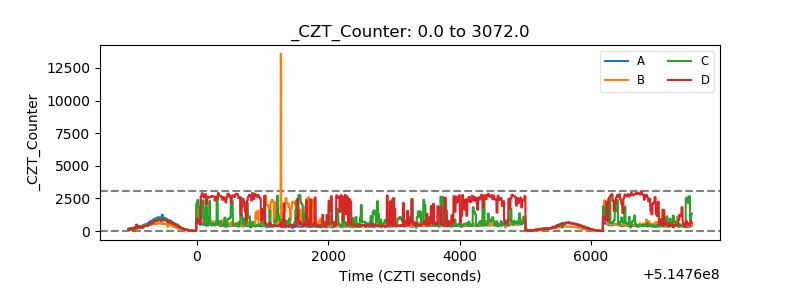 |
| +2.5 Volts monitor | 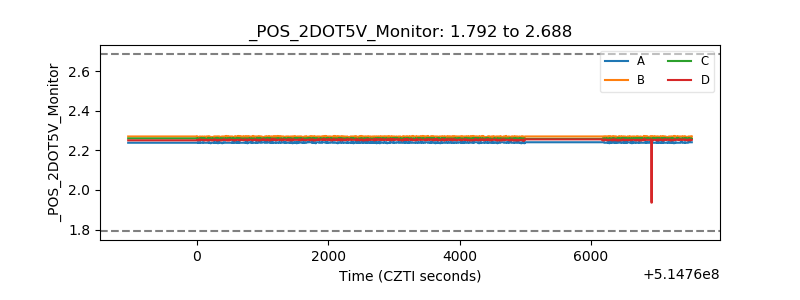 |
| +5 Volts monitor |  |
| _ROLL_ROT | 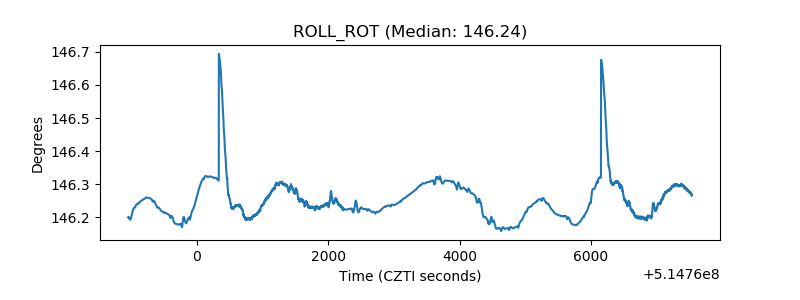 |
| _Roll_DEC | 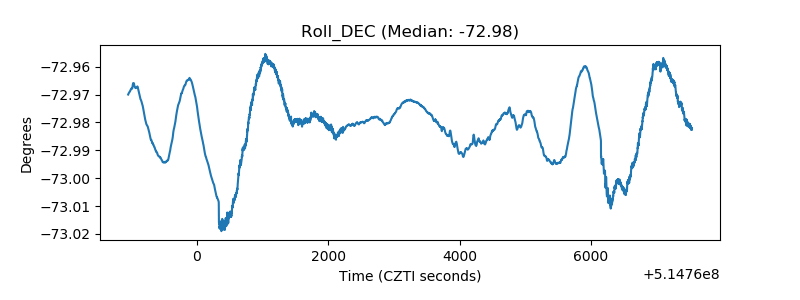 |
| _Roll_RA | 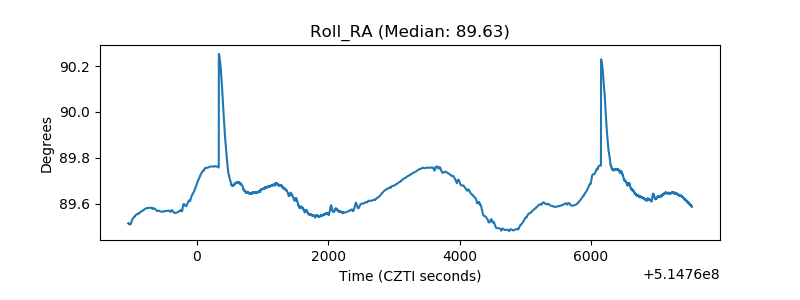 |
| Veto Counter | 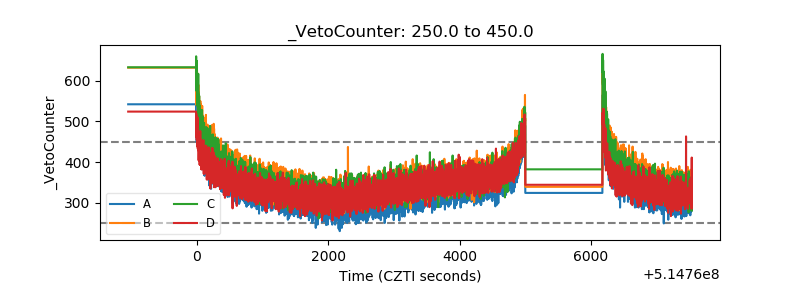 |