| Param | Original file | Final file |
|---|---|---|
| Filename | modeM0/AS1A14_070T08_9000006568_57207cztM0_level2.fits | modeM0/AS1A14_070T08_9000006568_57207cztM0_level2_quad_clean.evt |
| Size (bytes) | 696,983,040 | 83,240,640 |
| Size | 664.7 MB | 79.4 MB |
| Events in quadrant A | 3,201,005 | 598,187 |
| Events in quadrant B | 3,866,490 | 638,928 |
| Events in quadrant C | 6,438,769 | 509,682 |
| Events in quadrant D | 11,734,596 | 272,195 |
| Mode M9 | |||
|---|---|---|---|
| Quadrant | BADHDUFLAG | Total packets | Discarded packets |
| A | 0 | 13 | 0 |
| B | 0 | 14 | 0 |
| C | 0 | 14 | 0 |
| D | 0 | 14 | 0 |
| Mode SS | |||
|---|---|---|---|
| Quadrant | BADHDUFLAG | Total packets | Discarded packets |
| A | 0 | 146 | 0 |
| B | 0 | 146 | 0 |
| C | 0 | 146 | 0 |
| D | 0 | 146 | 0 |
| Mode M0 | |||
|---|---|---|---|
| Quadrant | BADHDUFLAG | Total packets | Discarded packets |
| A | 0 | 15098 | 2 |
| B | 0 | 16696 | 2 |
| C | 0 | 24312 | 2 |
| D | 0 | 39869 | 2 |
| Quadrant | Total seconds | Saturated seconds | Saturation percentage |
|---|---|---|---|
| A | 7195 | 56 | 0.778318% |
| B | 7195 | 295 | 4.100069% |
| C | 7195 | 966 | 13.425990% |
| D | 7195 | 3664 | 50.924253% |
Noise dominated data is calculated using 1-second bins in cleaned event files. If a bin has >2000 counts, and if more than 50% of those come from <1% of pixels, then it is considered to be noise-dominated and hence unusable.
| Quadrant | # 1 sec bins | Bins with >0 counts | Bins with >2000 counts | High rate bins dominated by noise | Noise dominated (total time) | Noise dominated (detector-on time) | Marked lightcurve |
|---|---|---|---|---|---|---|---|
| A | 8233 | 7478 | 14 | 14 | 0.17% | 0.19% | 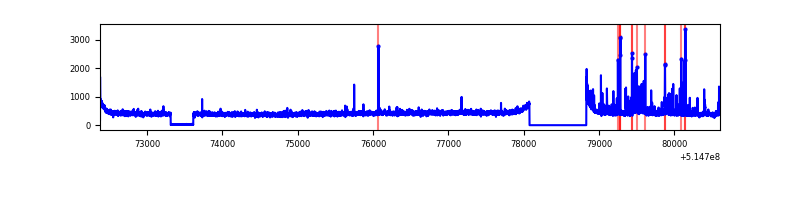 |
| B | 8233 | 7478 | 129 | 129 | 1.57% | 1.73% | 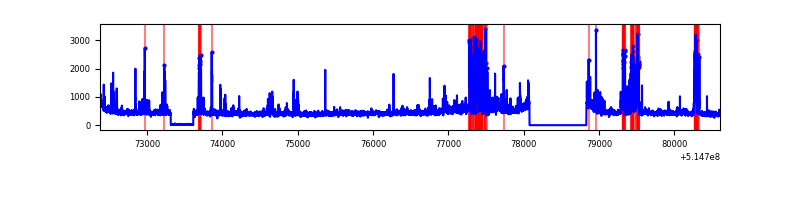 |
| C | 8233 | 7478 | 833 | 833 | 10.12% | 11.14% | 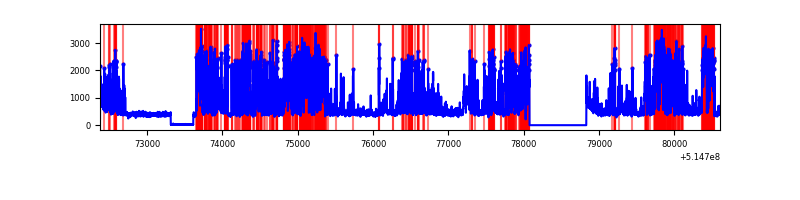 |
| D | 8233 | 7478 | 3272 | 3272 | 39.74% | 43.76% | 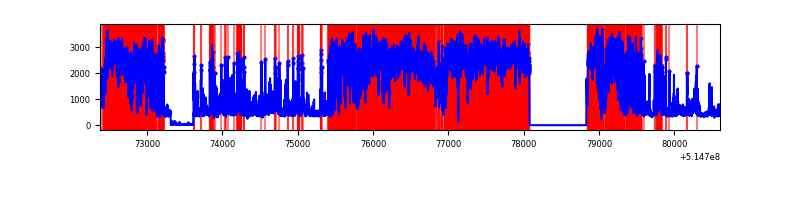 |
Top three noisy pixels from each quadrant. If the there are fewer than three noisy pixels in the level2.evt file, extra rows are filled as -1
| Pixel properties | Quadrant properties | ||||||
|---|---|---|---|---|---|---|---|
| Quadrant | DetID | PixID | Counts | Sigma | Mean | Median | Sigma |
| A | 3 | 95 | 193173 | 1019.68 | 764 | 742 | 188.7 |
| A | 4 | 249 | 14151 | 71.05 | 764 | 742 | 188.7 |
| A | 13 | 254 | 11123 | 55.01 | 764 | 742 | 188.7 |
| B | 0 | 213 | 352739 | 2191.1 | 750 | 723 | 160.7 |
| B | 5 | 185 | 278689 | 1730.18 | 750 | 723 | 160.7 |
| B | 0 | 199 | 57728 | 354.82 | 750 | 723 | 160.7 |
| C | 15 | 224 | 3532148 | 18638.36 | 700 | 693 | 189.5 |
| C | 12 | 254 | 115023 | 603.41 | 700 | 693 | 189.5 |
| C | 7 | 220 | 16072 | 81.17 | 700 | 693 | 189.5 |
| D | 12 | 33 | 8531457 | 64769.04 | 465 | 443 | 131.7 |
| D | 12 | 128 | 510139 | 3869.71 | 465 | 443 | 131.7 |
| D | 8 | 240 | 330844 | 2508.47 | 465 | 443 | 131.7 |
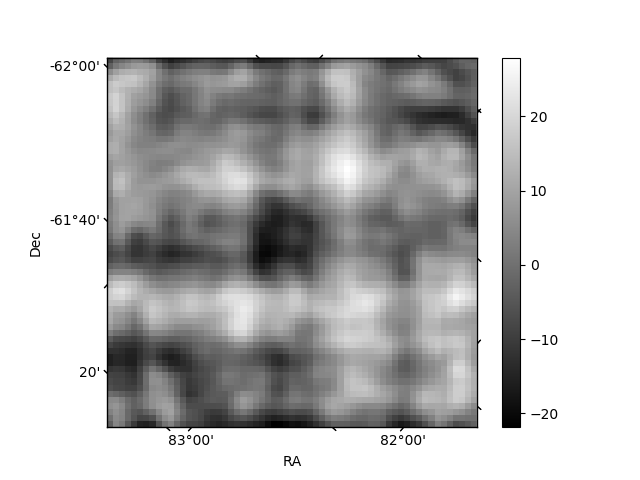
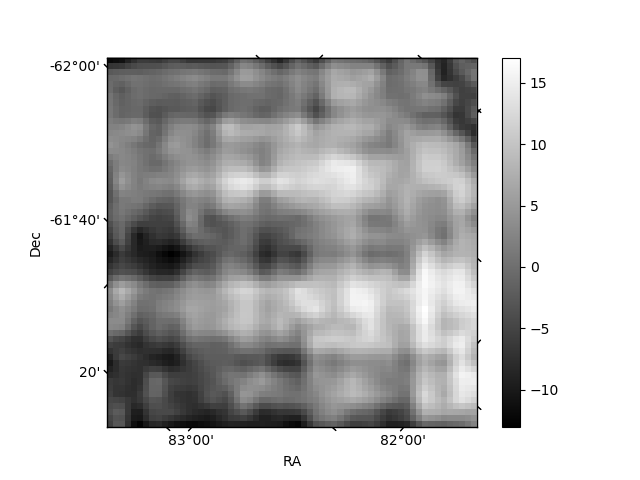
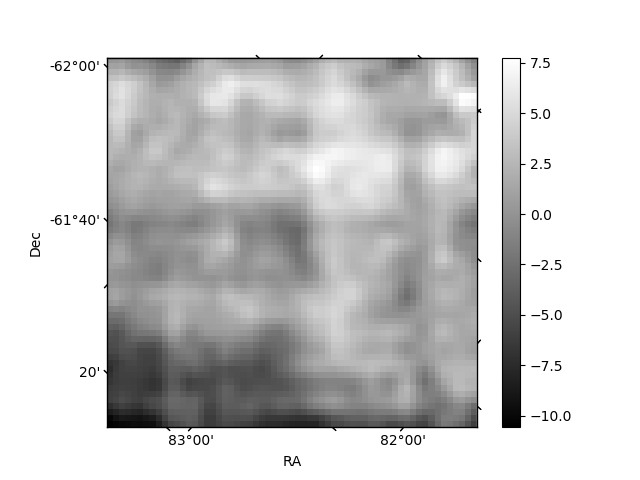
Histogram calculated using DETX and DETY for each event in the final _common_clean file
| Quadrant A | 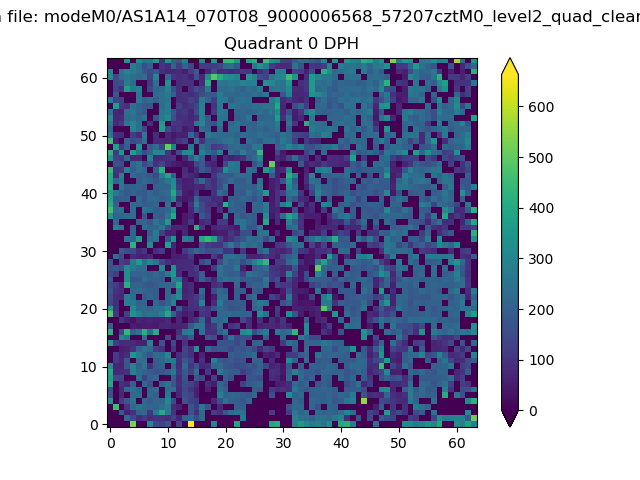 |
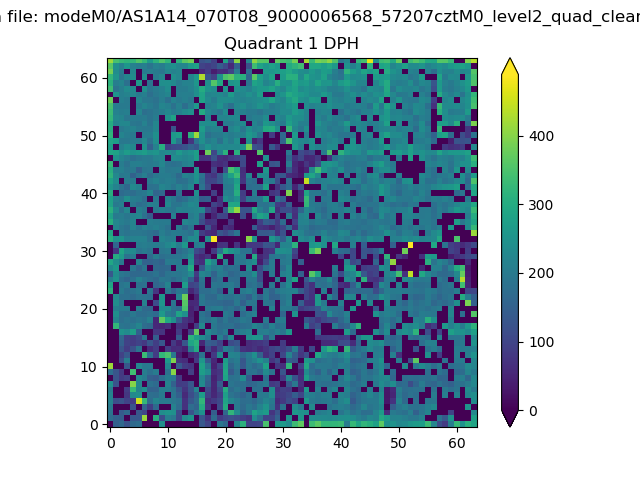 |
Quadrant B |
|---|---|---|---|
| Quadrant D | 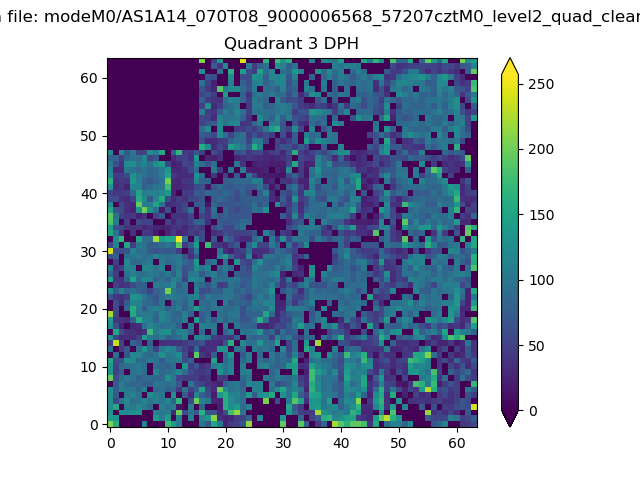 |
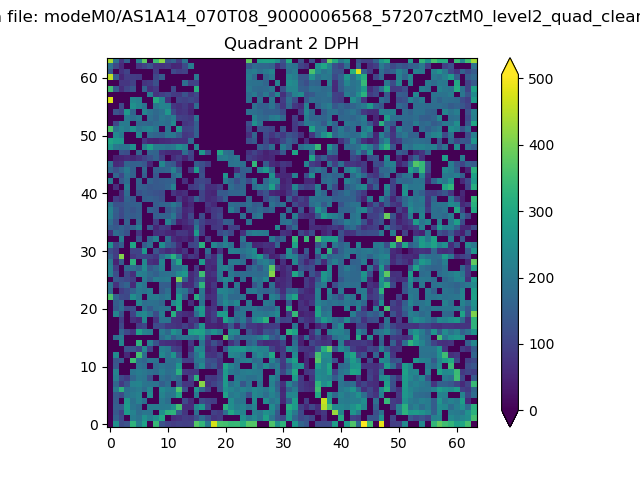 |
Quadrant C |
| Plot type | Count rate plots | Images |
|---|---|---|
| Comparison with Poisson distribution Blue bars denote a histogram of data divided into 1 sec bins. Red curve is a Poisson curve with rate = median count rate of data. |
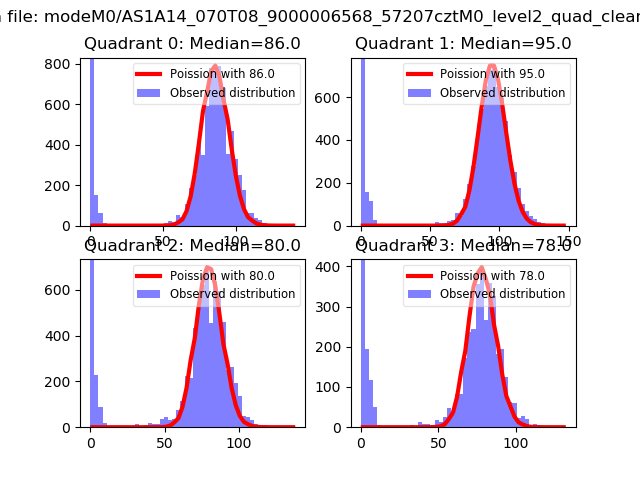 |
 |
| Quadrant-wise count rates Data is divided into 100 sec bins |
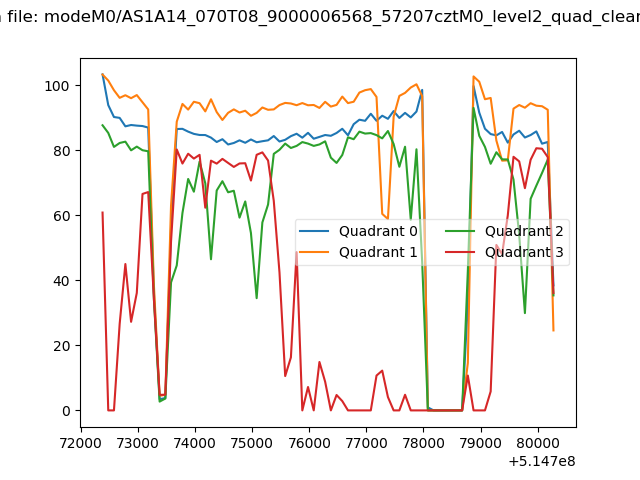 |
|
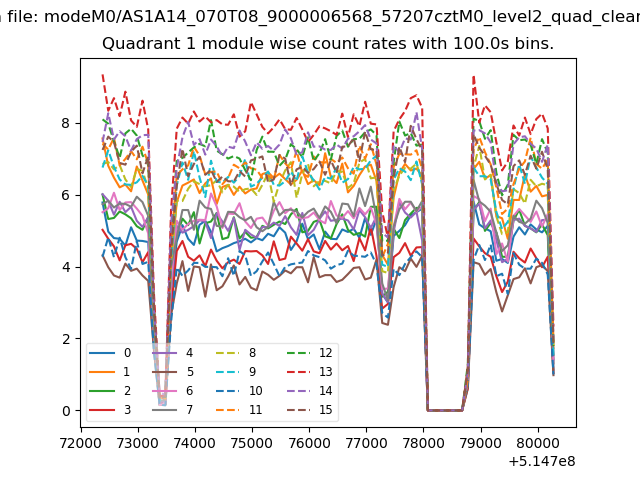
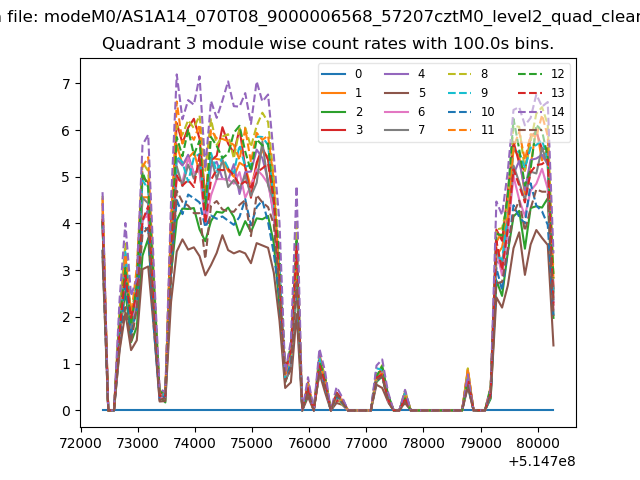
| Module-wise count rates for Quadrant A Data is divided into 100 sec bins |
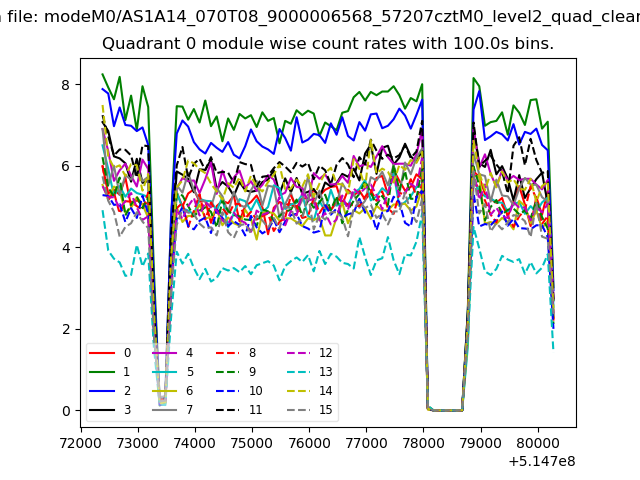 |
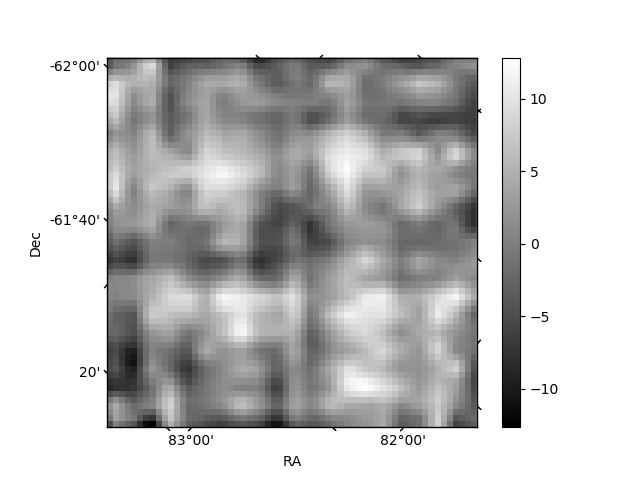 |
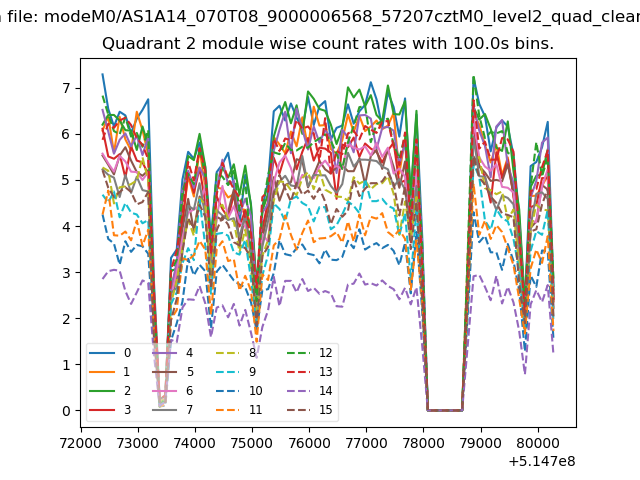
| Module-wise count rates for Quadrant B Data is divided into 100 sec bins |
 |
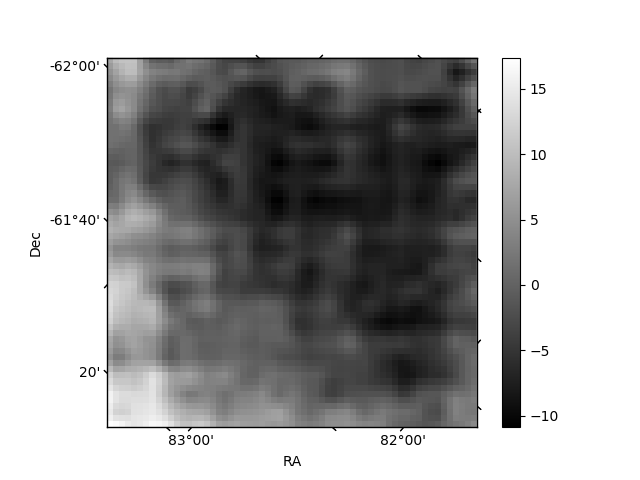 |
| Module-wise count rates for Quadrant C Data is divided into 100 sec bins |
 |
 |
| Module-wise count rates for Quadrant D Data is divided into 100 sec bins |
 |
 |
| Parameter | Plot |
|---|---|
| CZT HV Monitor | 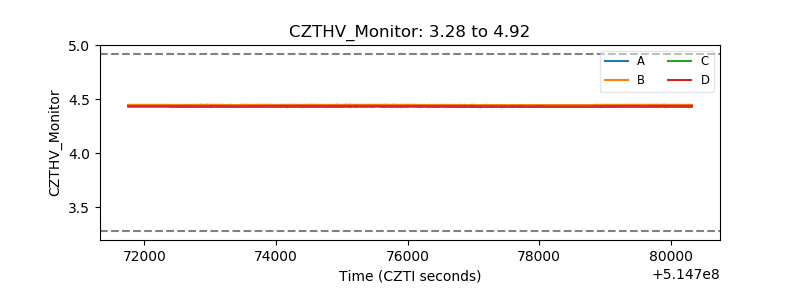 |
| D_VDD | 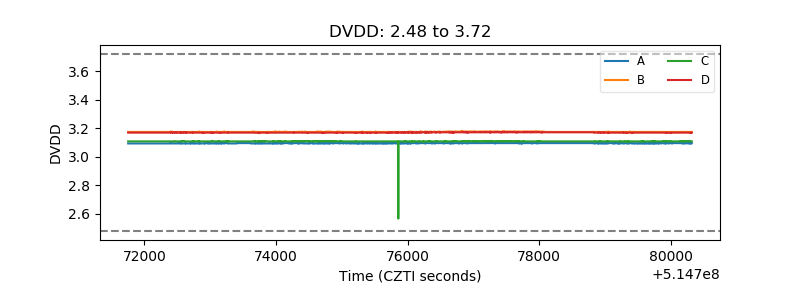 |
| Temperature 1 | 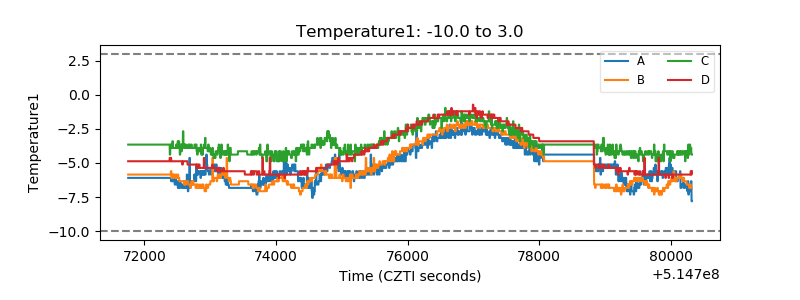 |
| Veto HV Monitor |  |
| Veto LLD | 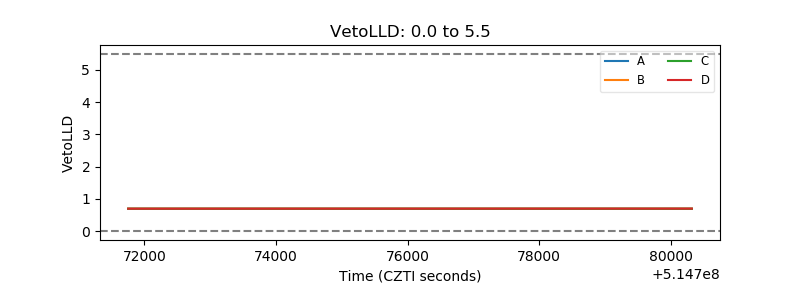 |
| Alpha Counter | 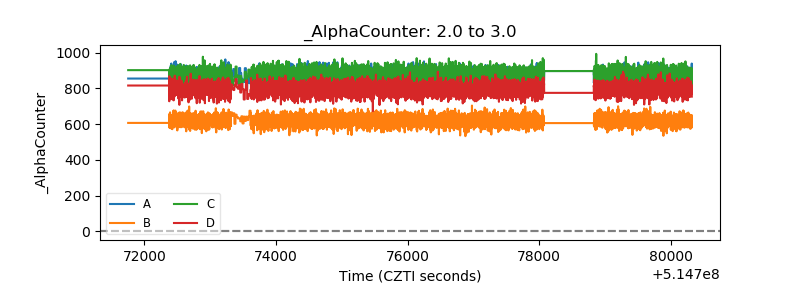 |
| _CPM_Rate | 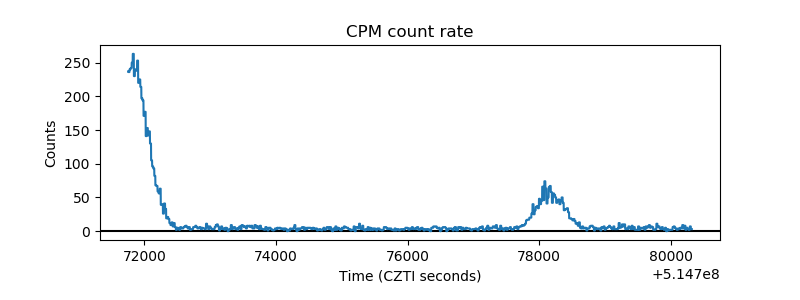 |
| CZT Counter | 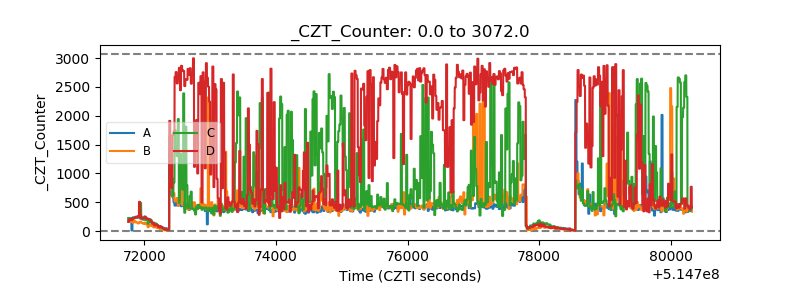 |
| +2.5 Volts monitor | 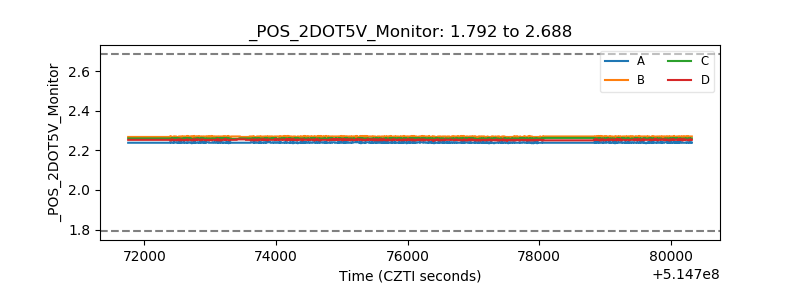 |
| +5 Volts monitor |  |
| _ROLL_ROT | 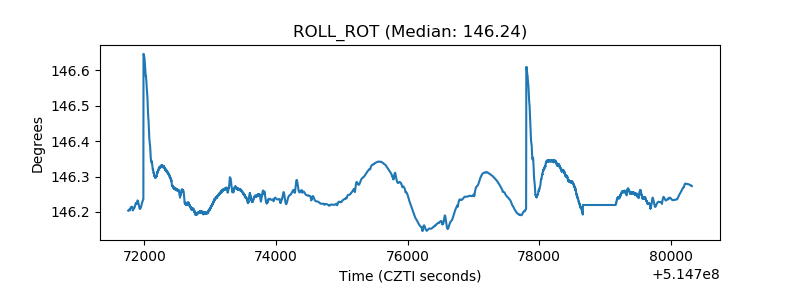 |
| _Roll_DEC | 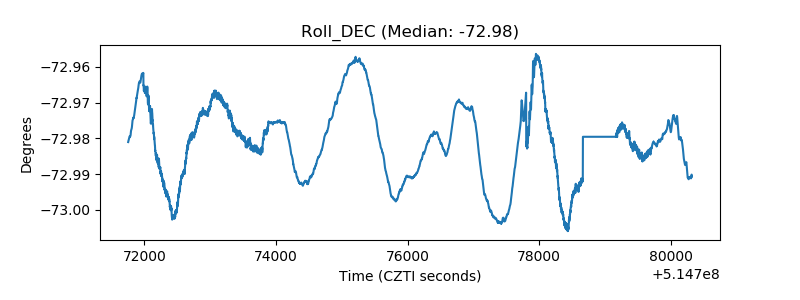 |
| _Roll_RA | 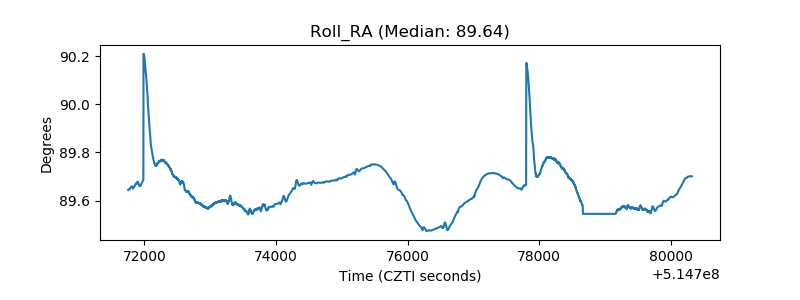 |
| Veto Counter | 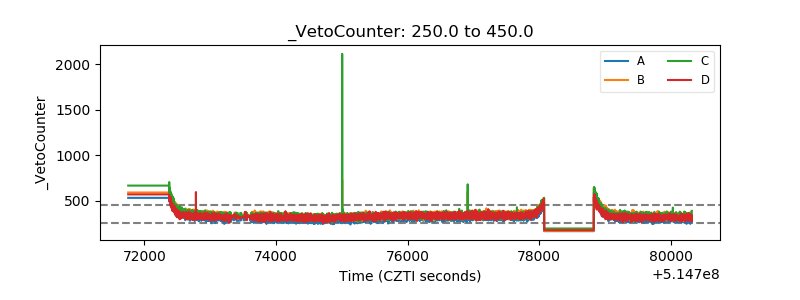 |