| Param | Original file | Final file |
|---|---|---|
| Filename | modeM0/AS1A14_070T08_9000006568_57208cztM0_level2.fits | modeM0/AS1A14_070T08_9000006568_57208cztM0_level2_quad_clean.evt |
| Size (bytes) | 753,572,160 | 89,812,800 |
| Size | 718.7 MB | 85.7 MB |
| Events in quadrant A | 3,633,669 | 669,264 |
| Events in quadrant B | 3,955,702 | 701,534 |
| Events in quadrant C | 8,035,199 | 524,818 |
| Events in quadrant D | 11,706,104 | 317,890 |
| Mode M9 | |||
|---|---|---|---|
| Quadrant | BADHDUFLAG | Total packets | Discarded packets |
| A | 0 | 1 | 0 |
| B | 0 | 1 | 0 |
| C | 0 | 1 | 0 |
| D | 0 | 1 | 0 |
| Mode SS | |||
|---|---|---|---|
| Quadrant | BADHDUFLAG | Total packets | Discarded packets |
| A | 0 | 146 | 0 |
| B | 0 | 146 | 0 |
| C | 0 | 146 | 0 |
| D | 0 | 146 | 0 |
| Mode M0 | |||
|---|---|---|---|
| Quadrant | BADHDUFLAG | Total packets | Discarded packets |
| A | 0 | 16327 | 1 |
| B | 0 | 17005 | 1 |
| C | 0 | 28952 | 1 |
| D | 0 | 39893 | 1 |
| Quadrant | Total seconds | Saturated seconds | Saturation percentage |
|---|---|---|---|
| A | 7266 | 275 | 3.784751% |
| B | 7267 | 441 | 6.068529% |
| C | 7266 | 1682 | 23.148913% |
| D | 7266 | 3592 | 49.435728% |
Noise dominated data is calculated using 1-second bins in cleaned event files. If a bin has >2000 counts, and if more than 50% of those come from <1% of pixels, then it is considered to be noise-dominated and hence unusable.
| Quadrant | # 1 sec bins | Bins with >0 counts | Bins with >2000 counts | High rate bins dominated by noise | Noise dominated (total time) | Noise dominated (detector-on time) | Marked lightcurve |
|---|---|---|---|---|---|---|---|
| A | 7321 | 7267 | 69 | 69 | 0.94% | 0.95% | 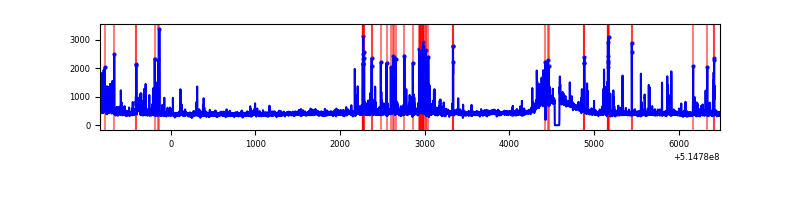 |
| B | 7322 | 7268 | 115 | 115 | 1.57% | 1.58% | 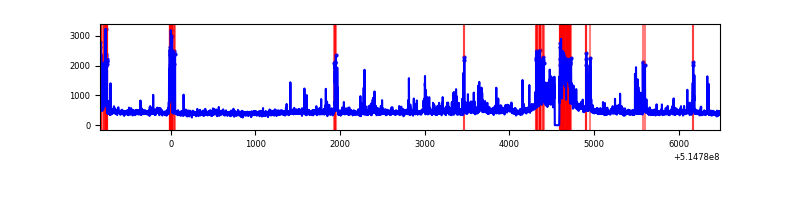 |
| C | 7321 | 7267 | 1251 | 1251 | 17.09% | 17.21% | 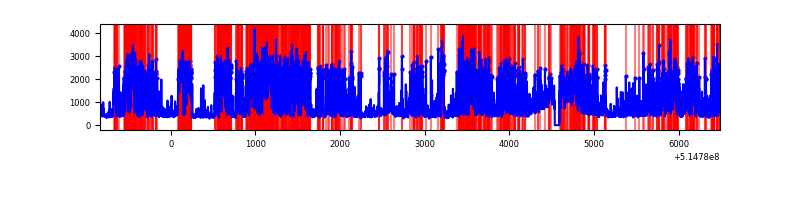 |
| D | 7321 | 7267 | 3072 | 3072 | 41.96% | 42.27% | 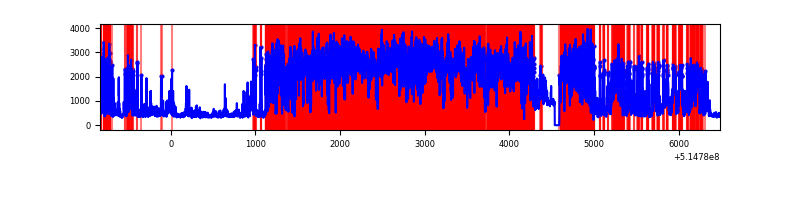 |
Top three noisy pixels from each quadrant. If the there are fewer than three noisy pixels in the level2.evt file, extra rows are filled as -1
| Pixel properties | Quadrant properties | ||||||
|---|---|---|---|---|---|---|---|
| Quadrant | DetID | PixID | Counts | Sigma | Mean | Median | Sigma |
| A | 3 | 95 | 540722 | 2792.7 | 784 | 763 | 193.3 |
| A | 4 | 249 | 22415 | 111.99 | 784 | 763 | 193.3 |
| A | 4 | 3 | 12621 | 61.33 | 784 | 763 | 193.3 |
| B | 5 | 185 | 527039 | 3220.2 | 761 | 730 | 163.4 |
| B | 10 | 247 | 113373 | 689.2 | 761 | 730 | 163.4 |
| B | 0 | 213 | 87351 | 529.98 | 761 | 730 | 163.4 |
| C | 15 | 224 | 4924903 | 26238.41 | 696 | 690 | 187.7 |
| C | 12 | 254 | 222605 | 1182.46 | 696 | 690 | 187.7 |
| C | 12 | 252 | 75029 | 396.11 | 696 | 690 | 187.7 |
| D | 12 | 33 | 9156599 | 64035.98 | 512 | 486 | 143.0 |
| D | 2 | 31 | 165800 | 1156.17 | 512 | 486 | 143.0 |
| D | 8 | 240 | 127904 | 891.13 | 512 | 486 | 143.0 |
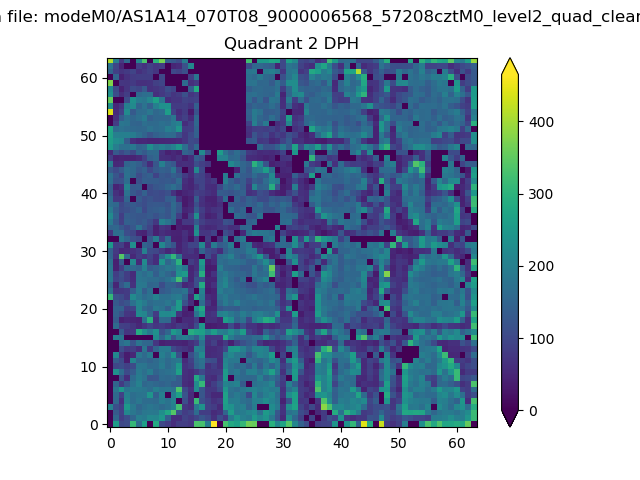
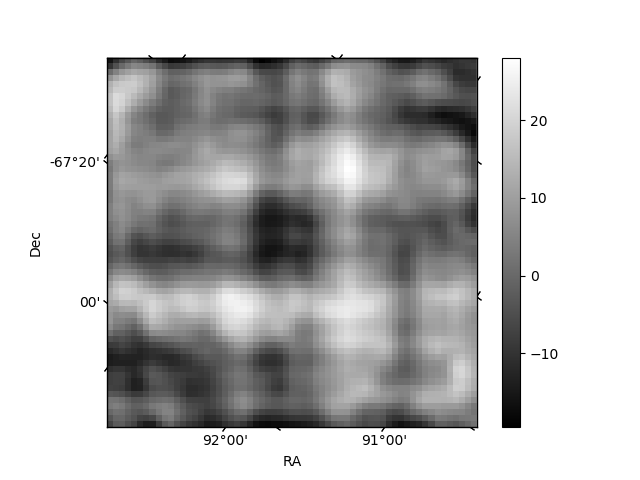
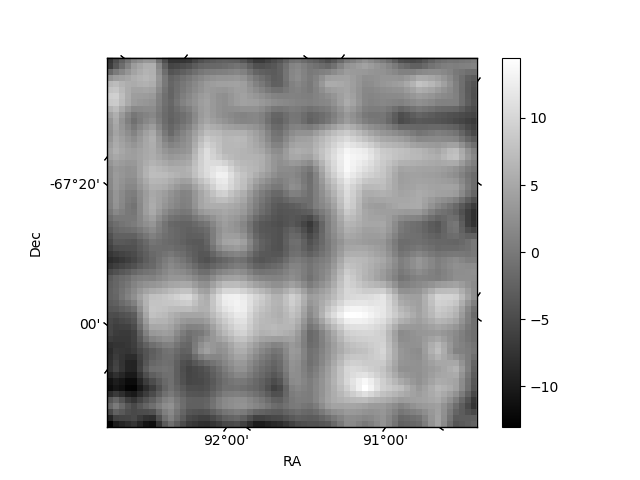
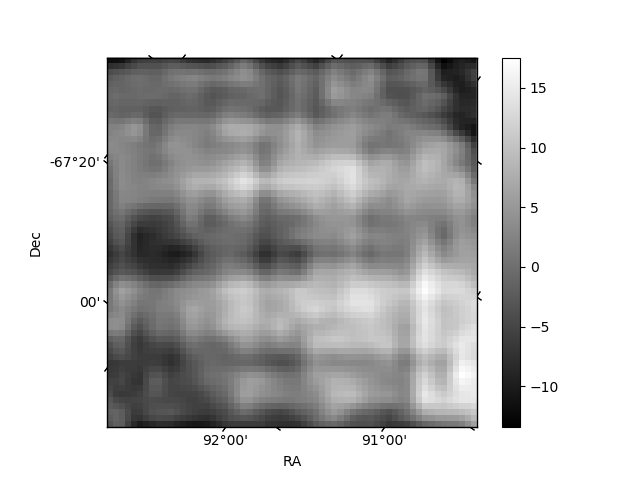
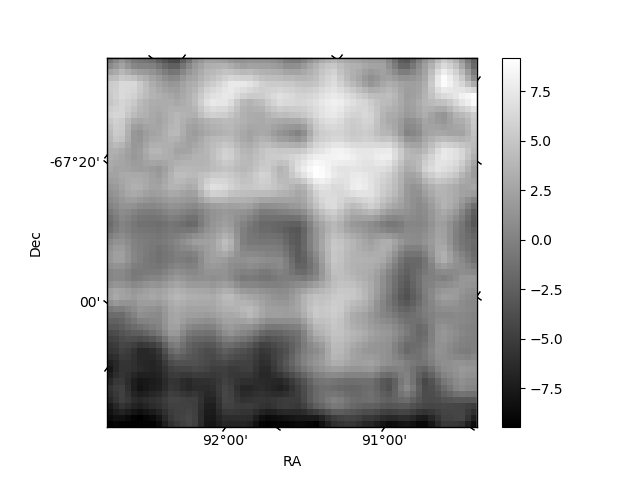
Histogram calculated using DETX and DETY for each event in the final _common_clean file
| Quadrant A | 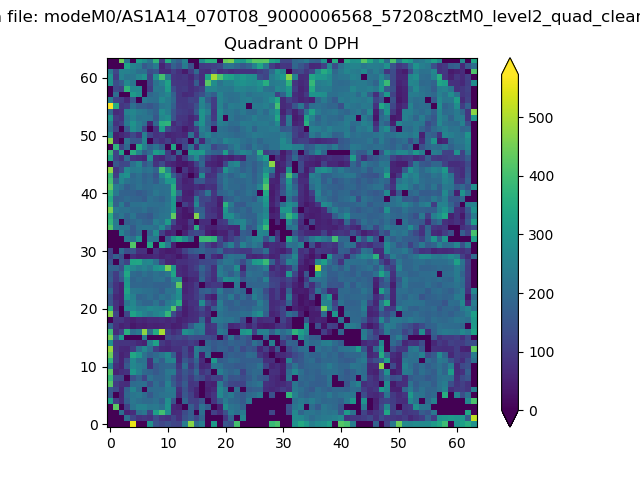 |
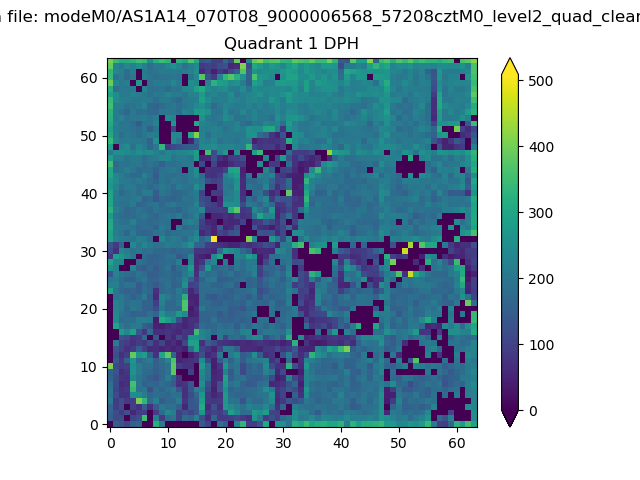 |
Quadrant B |
|---|---|---|---|
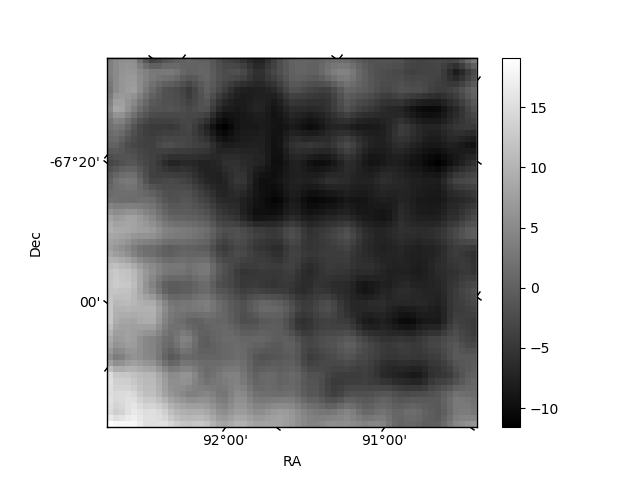
| Quadrant D | 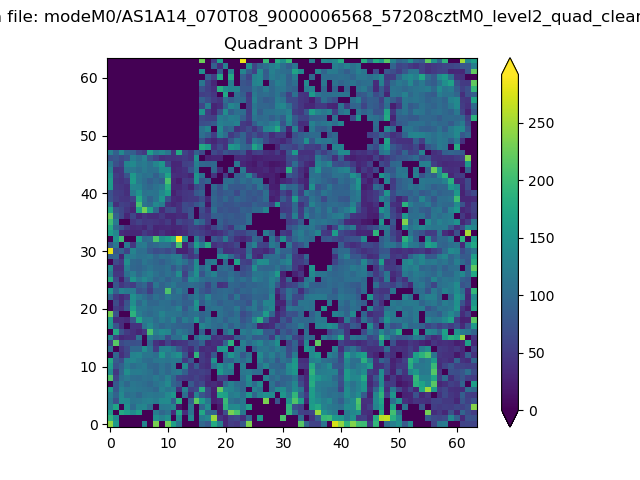 |
 |
Quadrant C |
| Plot type | Count rate plots | Images |
|---|---|---|
| Comparison with Poisson distribution Blue bars denote a histogram of data divided into 1 sec bins. Red curve is a Poisson curve with rate = median count rate of data. |
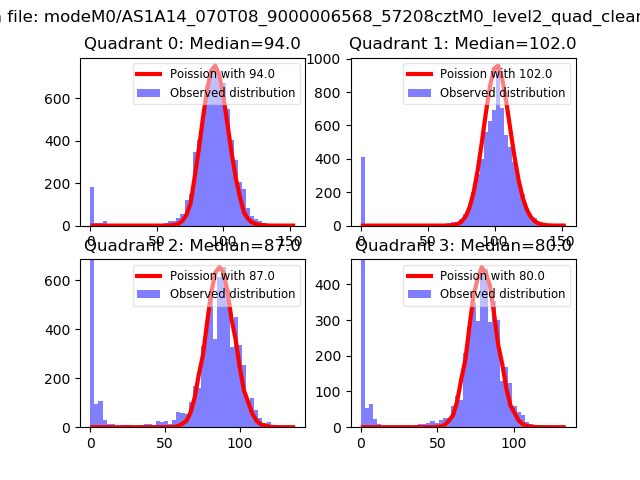 |
 |
| Quadrant-wise count rates Data is divided into 100 sec bins |
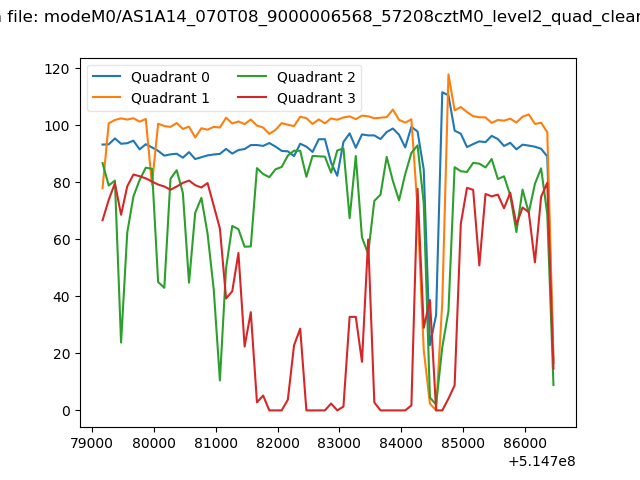 |
|
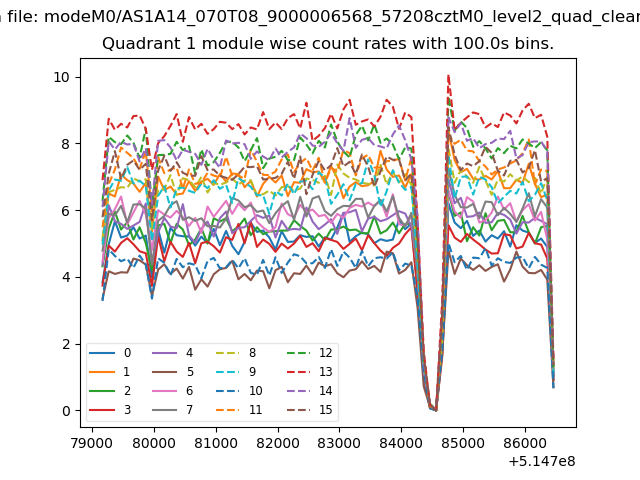
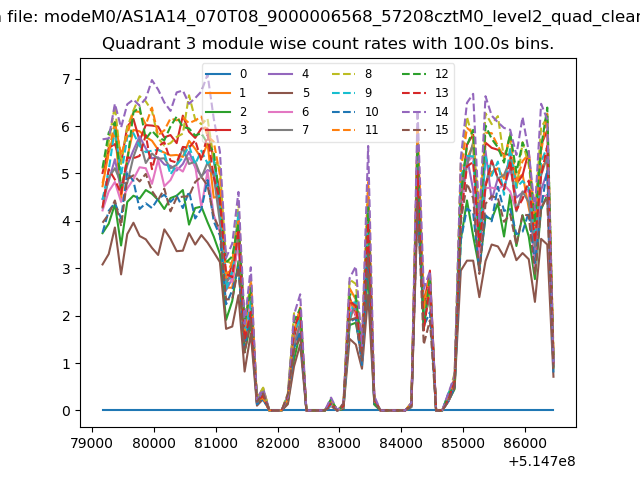
| Module-wise count rates for Quadrant A Data is divided into 100 sec bins |
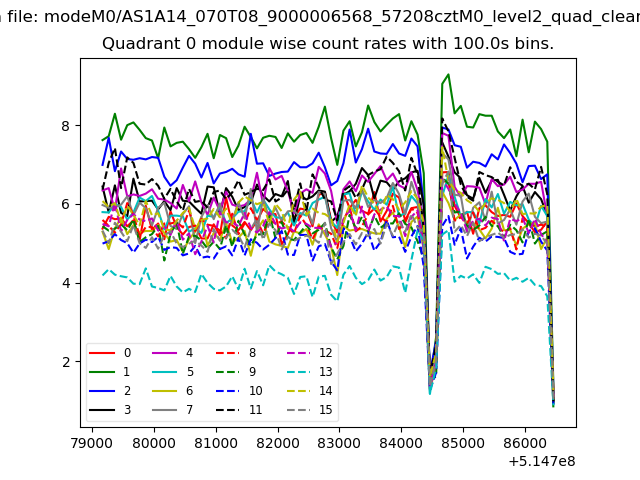 |
 |
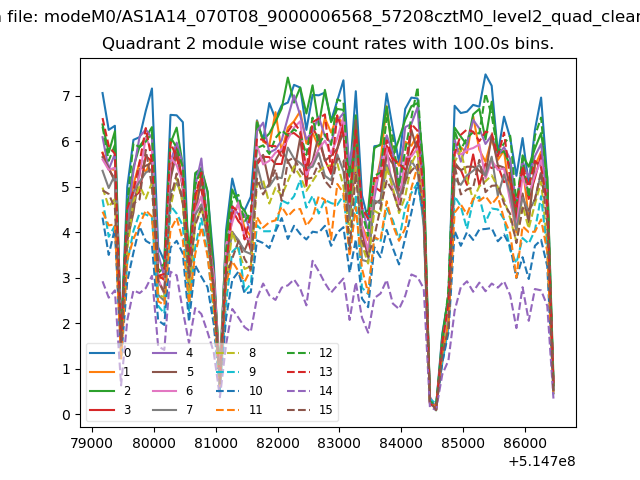
| Module-wise count rates for Quadrant B Data is divided into 100 sec bins |
 |
 |
| Module-wise count rates for Quadrant C Data is divided into 100 sec bins |
 |
 |
| Module-wise count rates for Quadrant D Data is divided into 100 sec bins |
 |
 |
| Parameter | Plot |
|---|---|
| CZT HV Monitor | 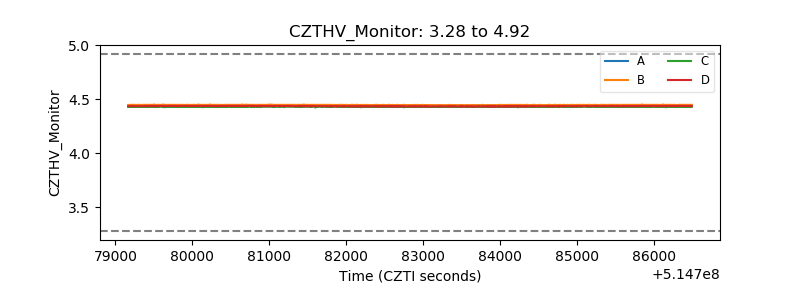 |
| D_VDD | 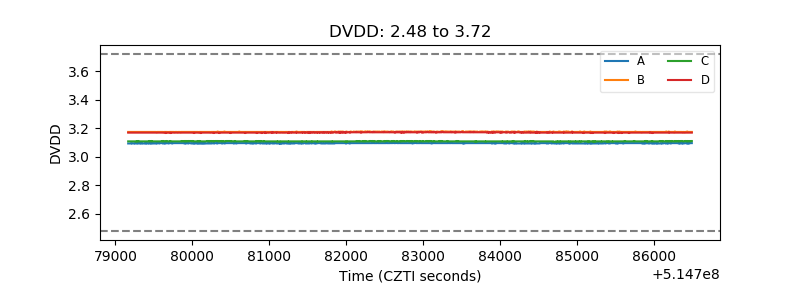 |
| Temperature 1 | 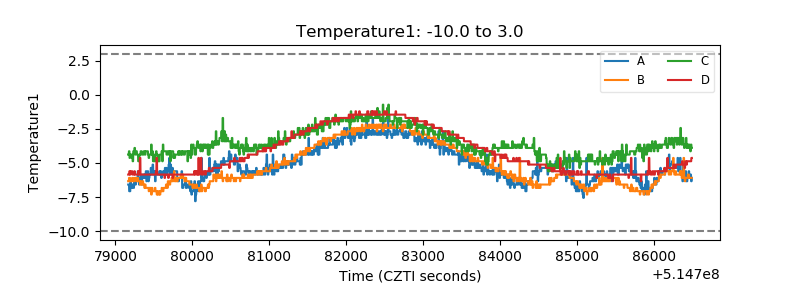 |
| Veto HV Monitor | 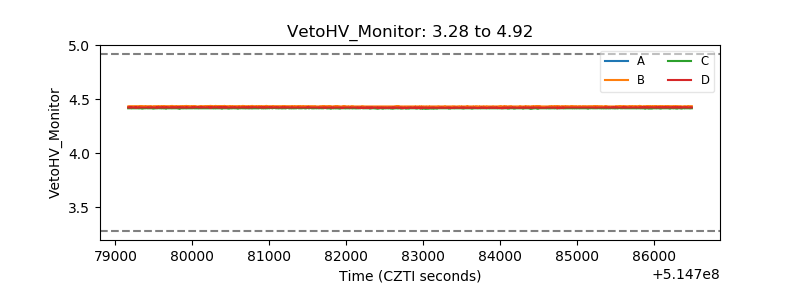 |
| Veto LLD | 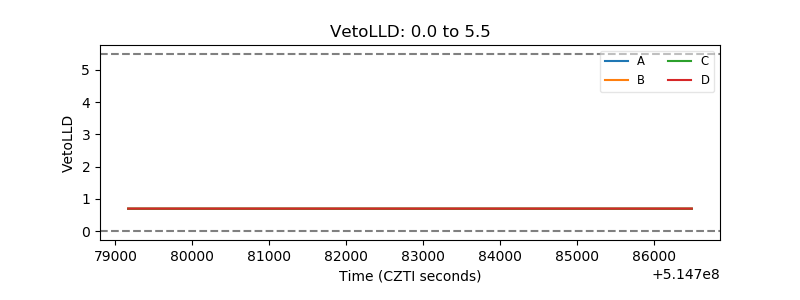 |
| Alpha Counter | 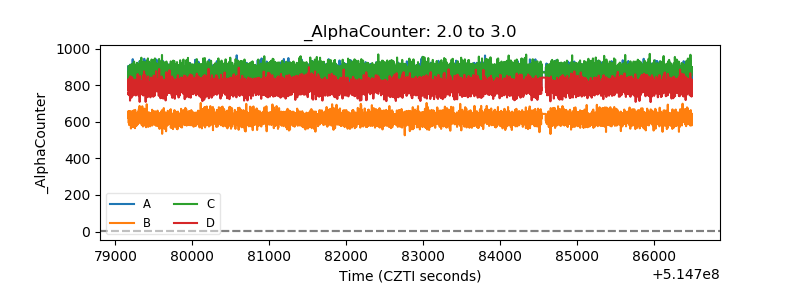 |
| _CPM_Rate | 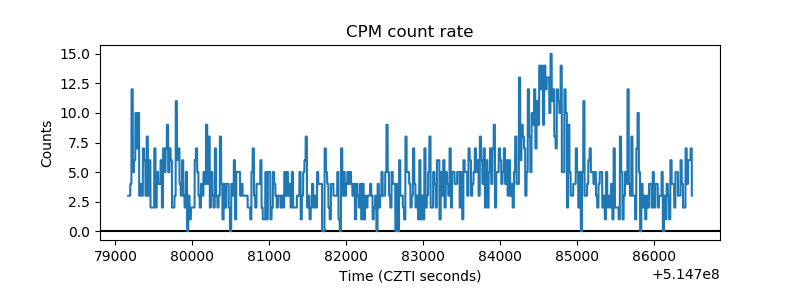 |
| CZT Counter | 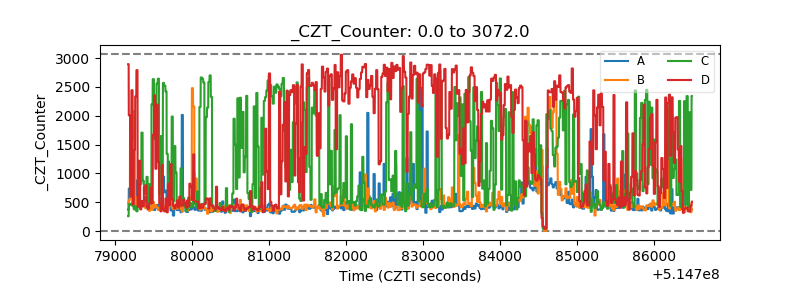 |
| +2.5 Volts monitor |  |
| +5 Volts monitor | 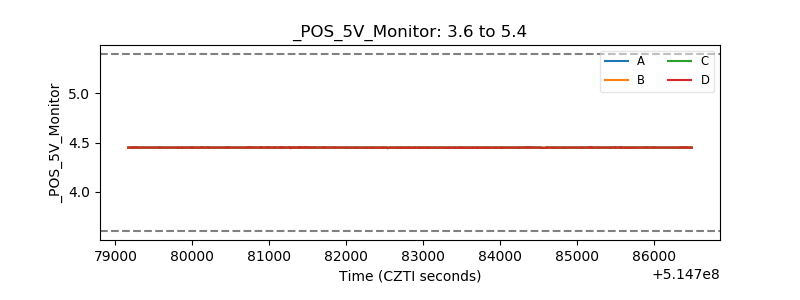 |
| _ROLL_ROT | 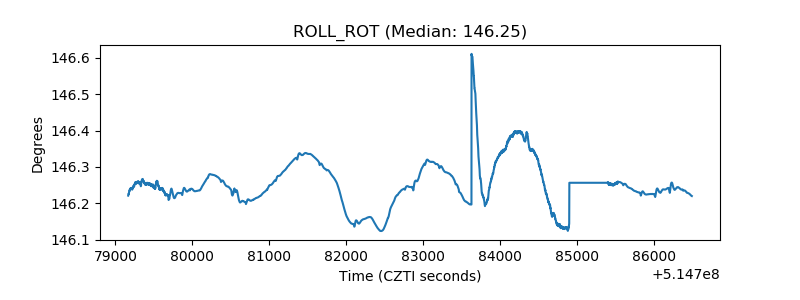 |
| _Roll_DEC | 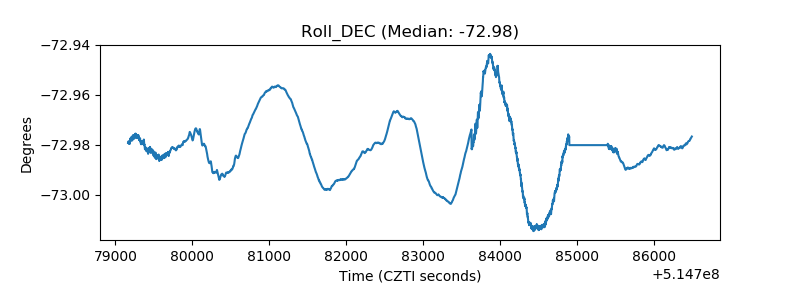 |
| _Roll_RA | 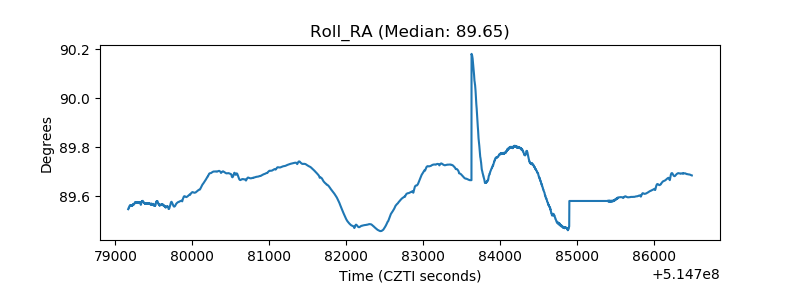 |
| Veto Counter | 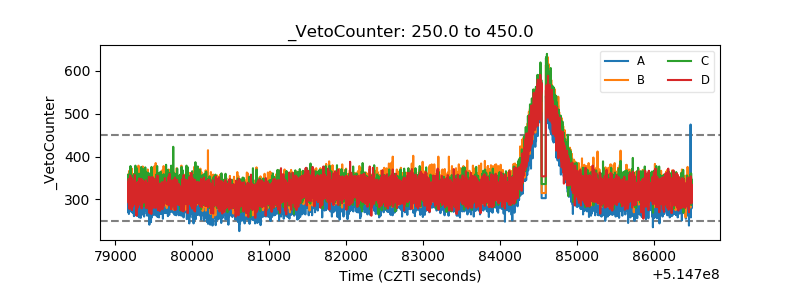 |