| Param | Original file | Final file |
|---|---|---|
| Filename | modeM0/AS1A14_070T08_9000006568_57209cztM0_level2.fits | modeM0/AS1A14_070T08_9000006568_57209cztM0_level2_quad_clean.evt |
| Size (bytes) | 723,971,520 | 92,131,200 |
| Size | 690.4 MB | 87.9 MB |
| Events in quadrant A | 3,289,309 | 679,477 |
| Events in quadrant B | 3,409,914 | 740,428 |
| Events in quadrant C | 8,110,290 | 538,797 |
| Events in quadrant D | 11,426,420 | 325,829 |
| Mode SS | |||
|---|---|---|---|
| Quadrant | BADHDUFLAG | Total packets | Discarded packets |
| A | 0 | 144 | 0 |
| B | 0 | 144 | 0 |
| C | 0 | 144 | 0 |
| D | 0 | 144 | 0 |
| Mode M0 | |||
|---|---|---|---|
| Quadrant | BADHDUFLAG | Total packets | Discarded packets |
| A | 0 | 15318 | 0 |
| B | 0 | 15167 | 0 |
| C | 0 | 29159 | 0 |
| D | 0 | 38983 | 1 |
| Quadrant | Total seconds | Saturated seconds | Saturation percentage |
|---|---|---|---|
| A | 7254 | 62 | 0.854701% |
| B | 7254 | 28 | 0.385994% |
| C | 7254 | 1520 | 20.953956% |
| D | 7253 | 3496 | 48.200745% |
Noise dominated data is calculated using 1-second bins in cleaned event files. If a bin has >2000 counts, and if more than 50% of those come from <1% of pixels, then it is considered to be noise-dominated and hence unusable.
| Quadrant | # 1 sec bins | Bins with >0 counts | Bins with >2000 counts | High rate bins dominated by noise | Noise dominated (total time) | Noise dominated (detector-on time) | Marked lightcurve |
|---|---|---|---|---|---|---|---|
| A | 7254 | 7254 | 52 | 52 | 0.72% | 0.72% | 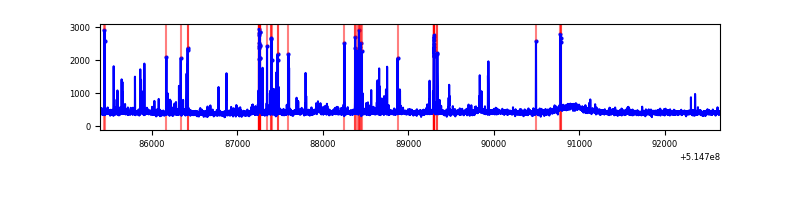 |
| B | 7254 | 7254 | 6 | 6 | 0.08% | 0.08% | 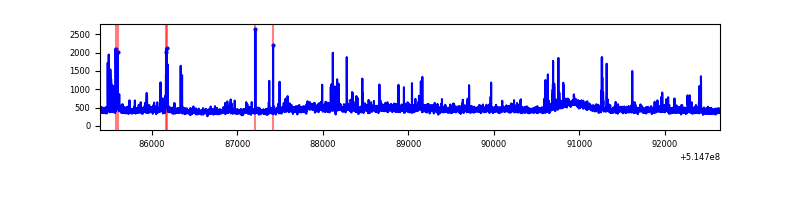 |
| C | 7254 | 7254 | 1185 | 1185 | 16.34% | 16.34% | 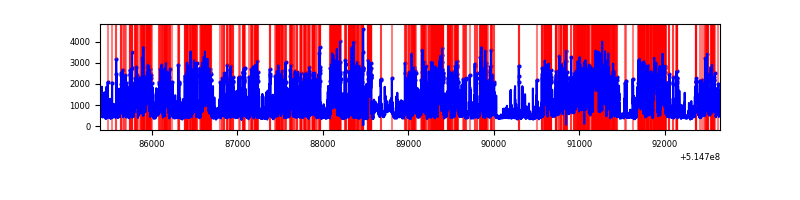 |
| D | 7253 | 7253 | 2957 | 2957 | 40.77% | 40.77% | 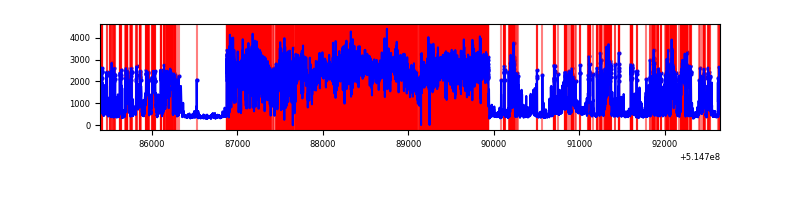 |
Top three noisy pixels from each quadrant. If the there are fewer than three noisy pixels in the level2.evt file, extra rows are filled as -1
| Pixel properties | Quadrant properties | ||||||
|---|---|---|---|---|---|---|---|
| Quadrant | DetID | PixID | Counts | Sigma | Mean | Median | Sigma |
| A | 3 | 95 | 247857 | 1321.24 | 763 | 746 | 187.0 |
| A | 4 | 236 | 41611 | 218.5 | 763 | 746 | 187.0 |
| A | 4 | 249 | 17908 | 91.76 | 763 | 746 | 187.0 |
| B | 0 | 199 | 100293 | 610.29 | 762 | 731 | 163.1 |
| B | 5 | 185 | 86837 | 527.8 | 762 | 731 | 163.1 |
| B | 1 | 238 | 53374 | 322.69 | 762 | 731 | 163.1 |
| C | 15 | 224 | 4618688 | 24785.07 | 680 | 675 | 186.3 |
| C | 12 | 254 | 578819 | 3102.92 | 680 | 675 | 186.3 |
| C | 12 | 252 | 115587 | 616.74 | 680 | 675 | 186.3 |
| D | 12 | 33 | 8845085 | 61842.16 | 504 | 478 | 143.0 |
| D | 8 | 240 | 239504 | 1671.28 | 504 | 478 | 143.0 |
| D | 2 | 31 | 111770 | 778.16 | 504 | 478 | 143.0 |
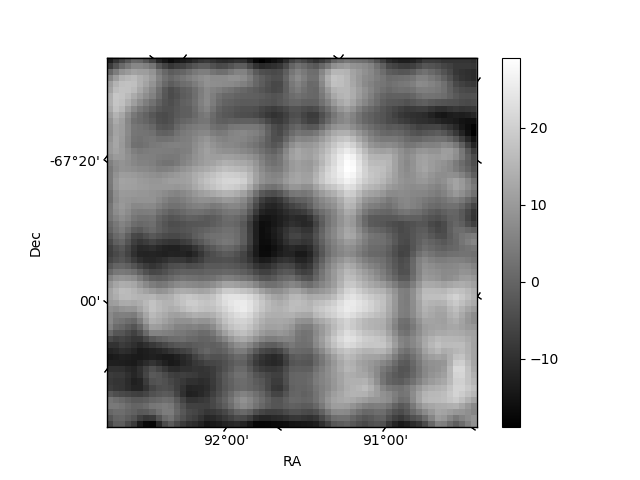
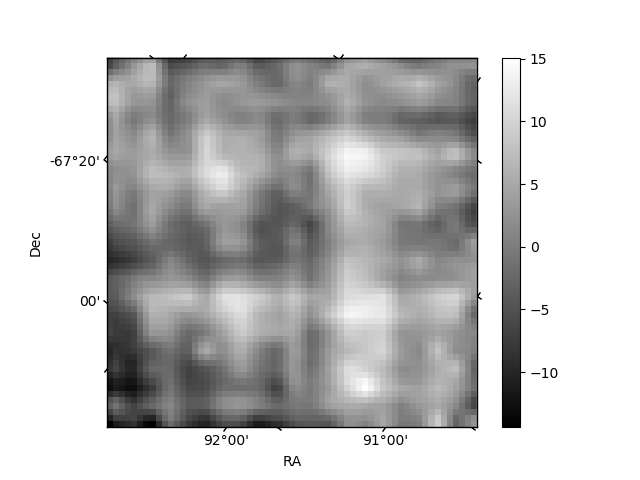
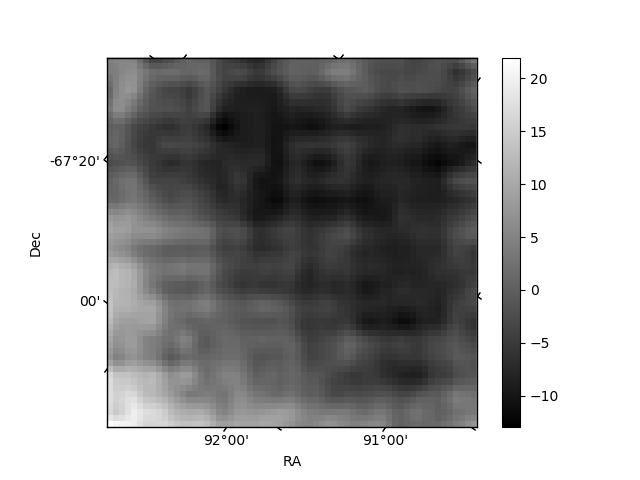
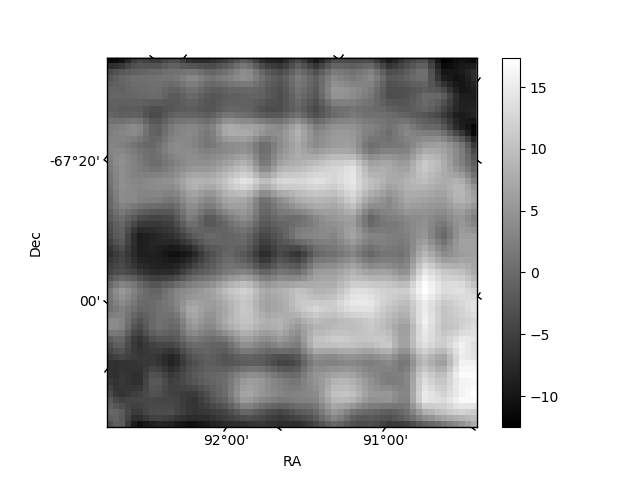
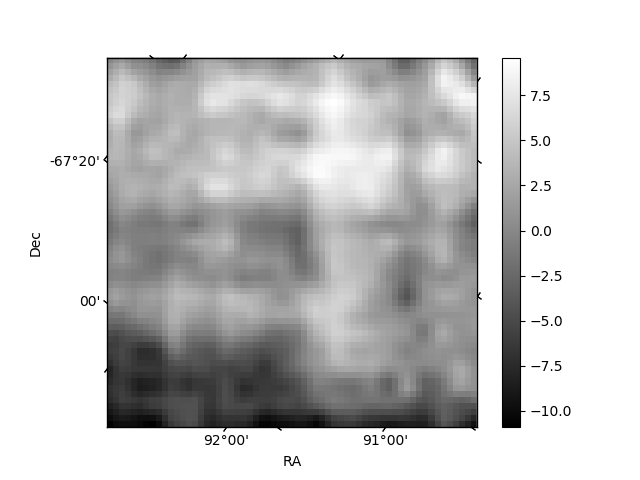
Histogram calculated using DETX and DETY for each event in the final _common_clean file
| Quadrant A | 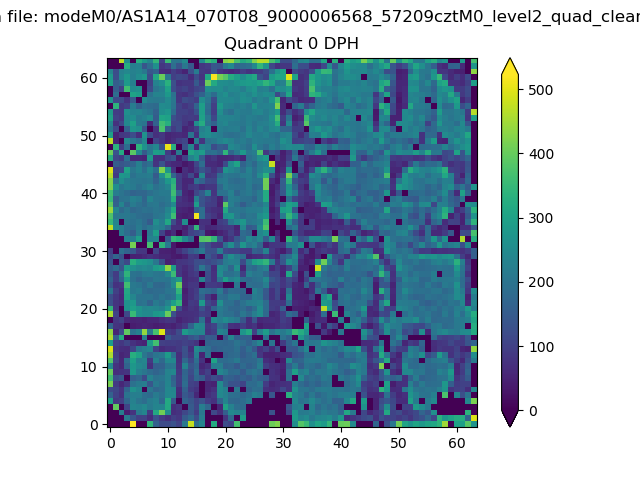 |
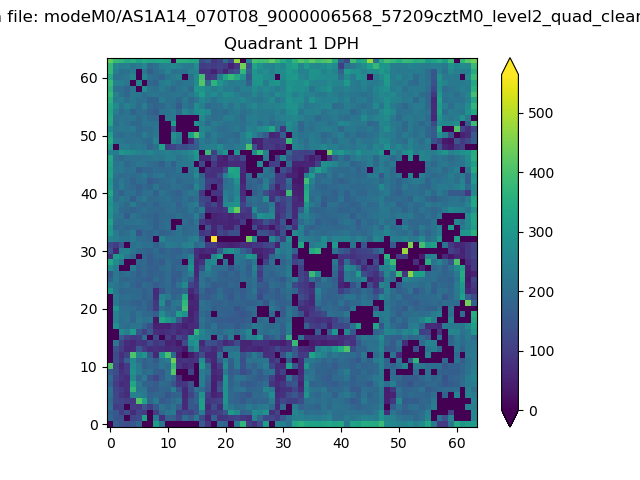 |
Quadrant B |
|---|---|---|---|
| Quadrant D | 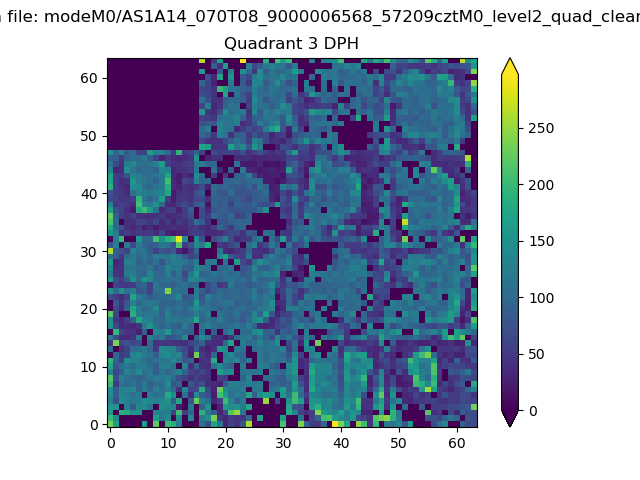 |
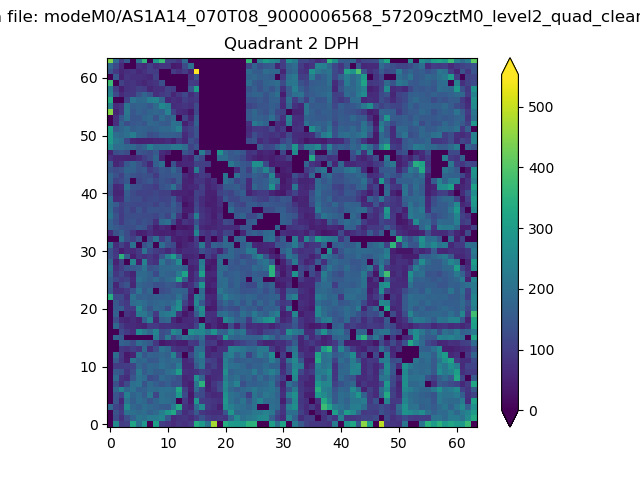 |
Quadrant C |
| Plot type | Count rate plots | Images |
|---|---|---|
| Comparison with Poisson distribution Blue bars denote a histogram of data divided into 1 sec bins. Red curve is a Poisson curve with rate = median count rate of data. |
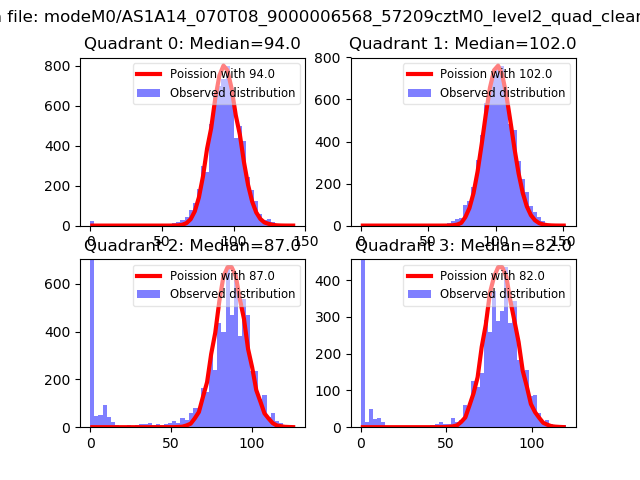 |
 |
| Quadrant-wise count rates Data is divided into 100 sec bins |
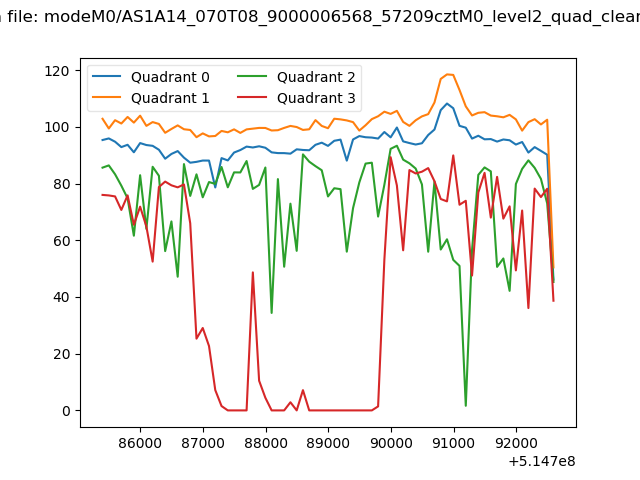 |
|
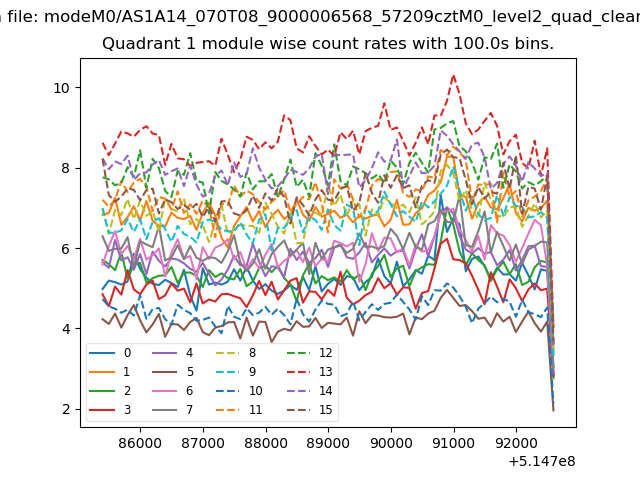
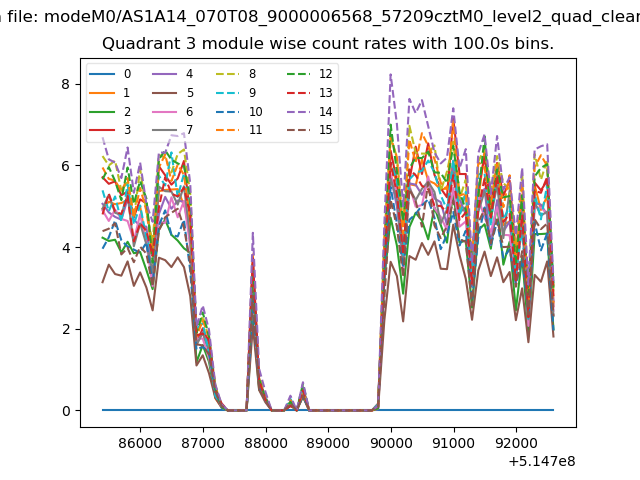
| Module-wise count rates for Quadrant A Data is divided into 100 sec bins |
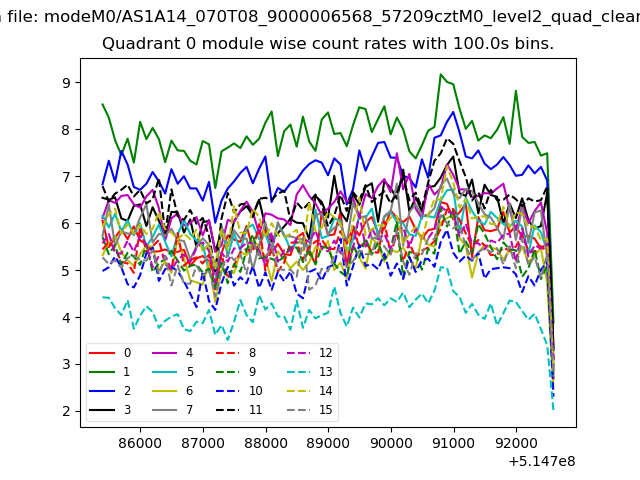 |
 |
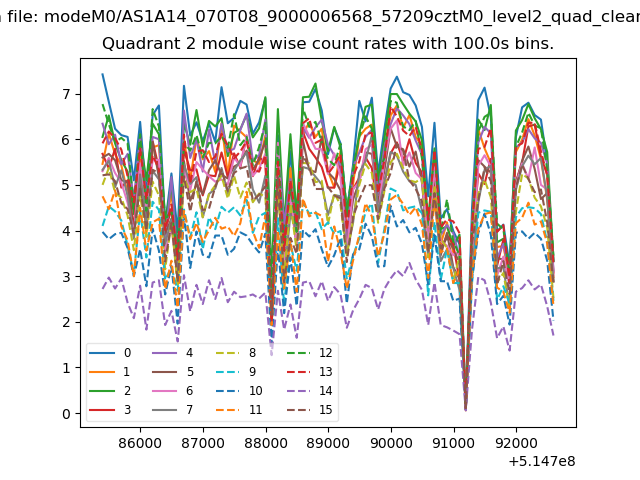
| Module-wise count rates for Quadrant B Data is divided into 100 sec bins |
 |
 |
| Module-wise count rates for Quadrant C Data is divided into 100 sec bins |
 |
 |
| Module-wise count rates for Quadrant D Data is divided into 100 sec bins |
 |
 |
| Parameter | Plot |
|---|---|
| CZT HV Monitor | 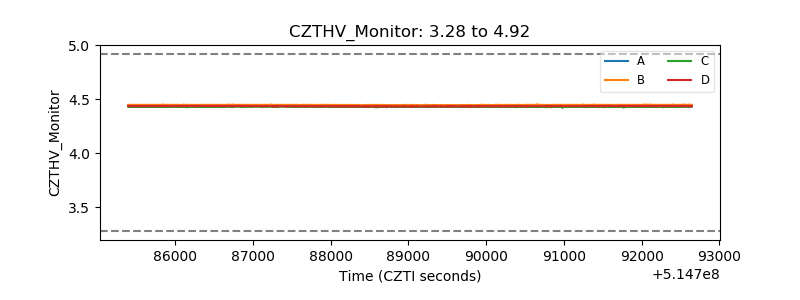 |
| D_VDD | 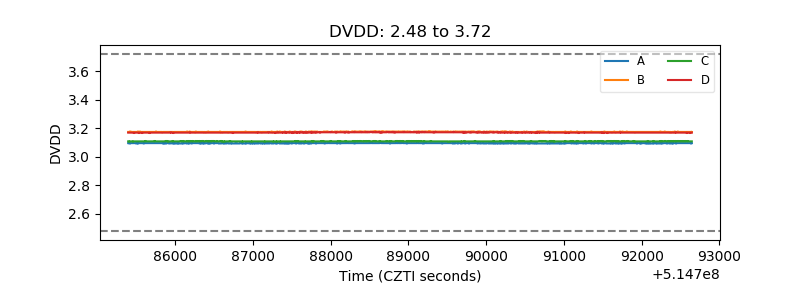 |
| Temperature 1 | 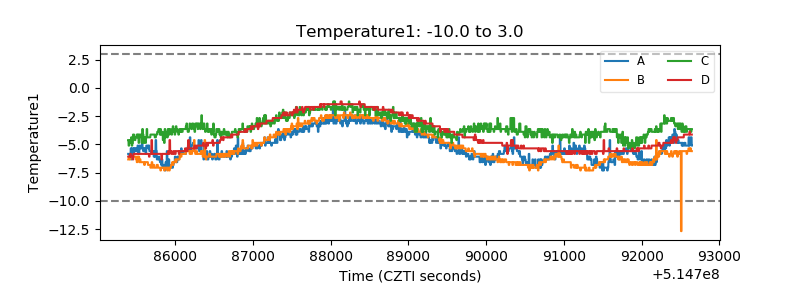 |
| Veto HV Monitor |  |
| Veto LLD | 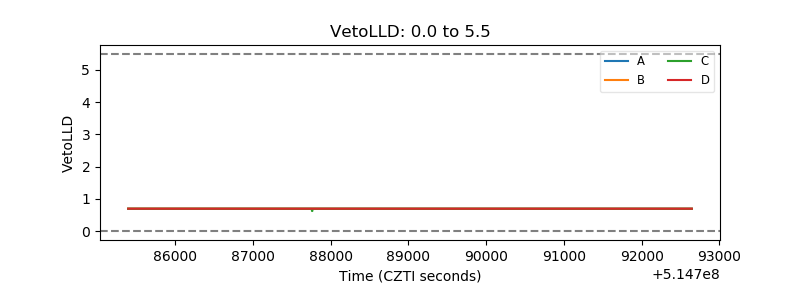 |
| Alpha Counter | 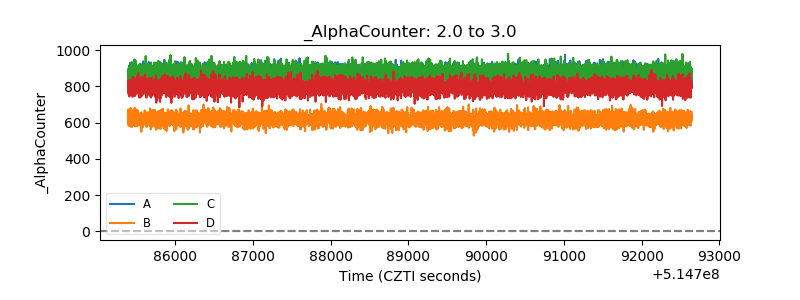 |
| _CPM_Rate | 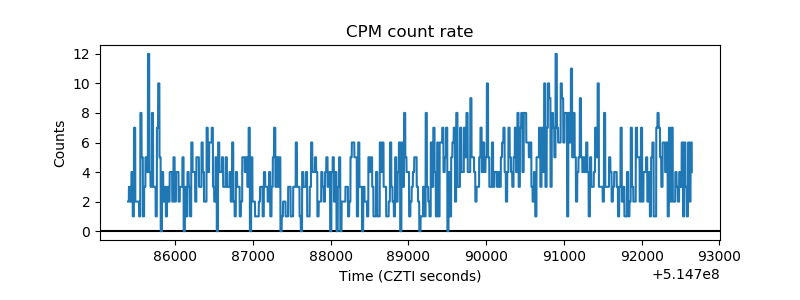 |
| CZT Counter | 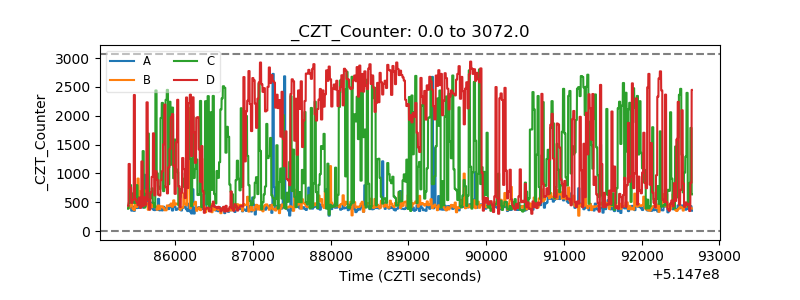 |
| +2.5 Volts monitor | 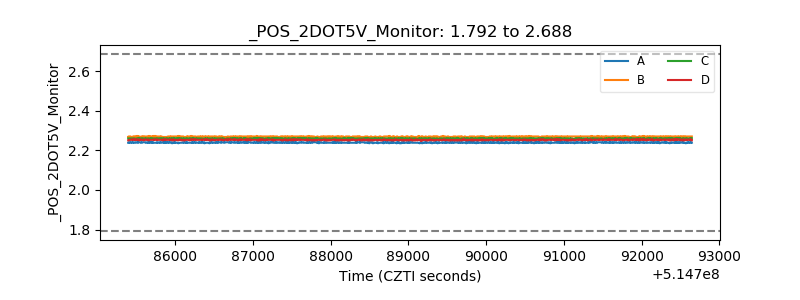 |
| +5 Volts monitor |  |
| _ROLL_ROT | 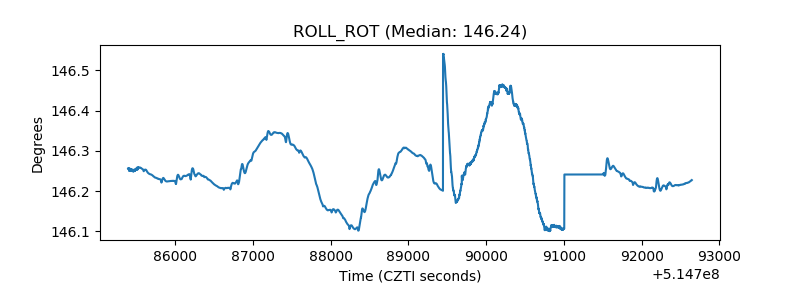 |
| _Roll_DEC | 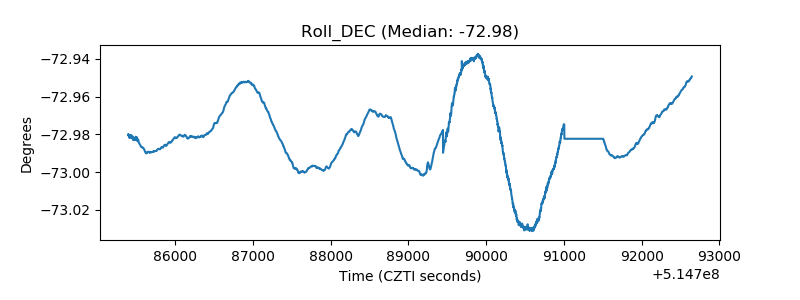 |
| _Roll_RA | 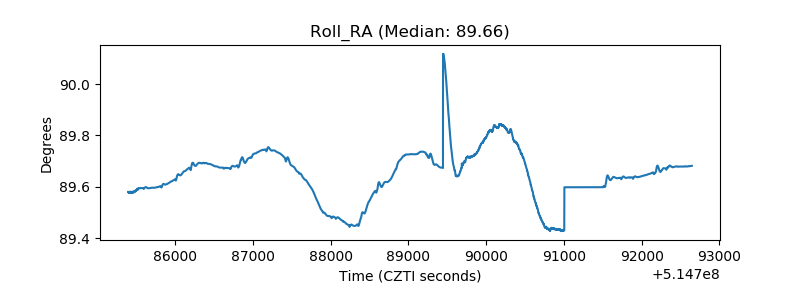 |
| Veto Counter | 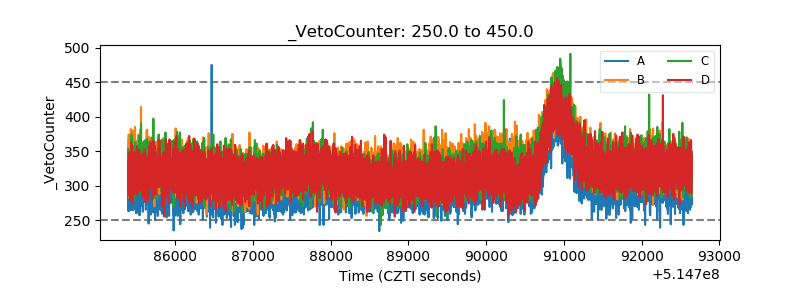 |