| Param | Original file | Final file |
|---|---|---|
| Filename | modeM0/AS1A14_070T08_9000006568_57210cztM0_level2.fits | modeM0/AS1A14_070T08_9000006568_57210cztM0_level2_quad_clean.evt |
| Size (bytes) | 814,328,640 | 92,960,640 |
| Size | 776.6 MB | 88.7 MB |
| Events in quadrant A | 3,543,794 | 703,856 |
| Events in quadrant B | 3,720,738 | 755,254 |
| Events in quadrant C | 10,285,585 | 476,801 |
| Events in quadrant D | 12,010,812 | 355,657 |
| Mode SS | |||
|---|---|---|---|
| Quadrant | BADHDUFLAG | Total packets | Discarded packets |
| A | 0 | 150 | 0 |
| B | 0 | 150 | 0 |
| C | 0 | 150 | 0 |
| D | 0 | 150 | 0 |
| Mode M0 | |||
|---|---|---|---|
| Quadrant | BADHDUFLAG | Total packets | Discarded packets |
| A | 0 | 16308 | 0 |
| B | 0 | 16521 | 0 |
| C | 0 | 35756 | 0 |
| D | 0 | 40882 | 0 |
| Quadrant | Total seconds | Saturated seconds | Saturation percentage |
|---|---|---|---|
| A | 7513 | 79 | 1.051511% |
| B | 7514 | 187 | 2.488688% |
| C | 7514 | 2589 | 34.455683% |
| D | 7513 | 3496 | 46.532677% |
Noise dominated data is calculated using 1-second bins in cleaned event files. If a bin has >2000 counts, and if more than 50% of those come from <1% of pixels, then it is considered to be noise-dominated and hence unusable.
| Quadrant | # 1 sec bins | Bins with >0 counts | Bins with >2000 counts | High rate bins dominated by noise | Noise dominated (total time) | Noise dominated (detector-on time) | Marked lightcurve |
|---|---|---|---|---|---|---|---|
| A | 7513 | 7513 | 29 | 29 | 0.39% | 0.39% | 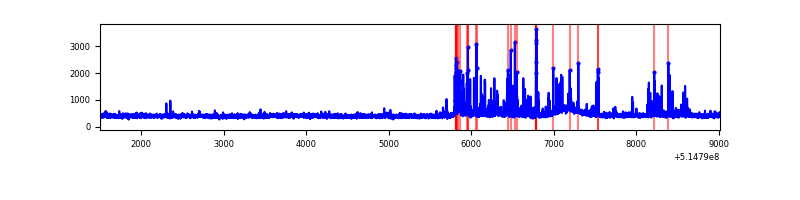 |
| B | 7514 | 7514 | 120 | 120 | 1.60% | 1.60% | 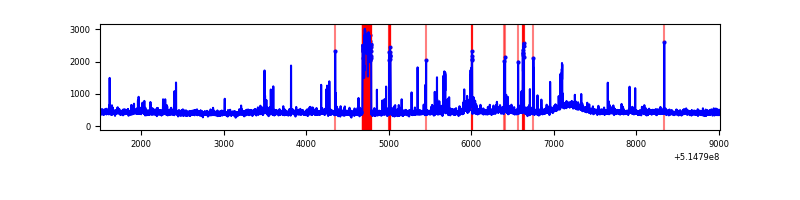 |
| C | 7514 | 7514 | 2005 | 2005 | 26.68% | 26.68% | 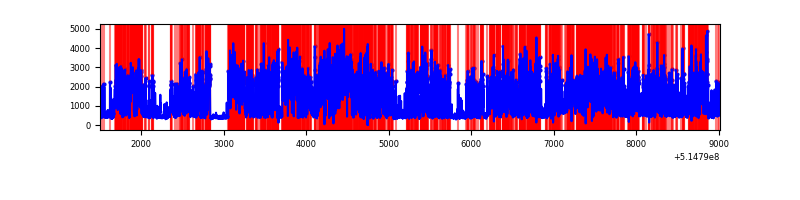 |
| D | 7513 | 7513 | 3105 | 3105 | 41.33% | 41.33% | 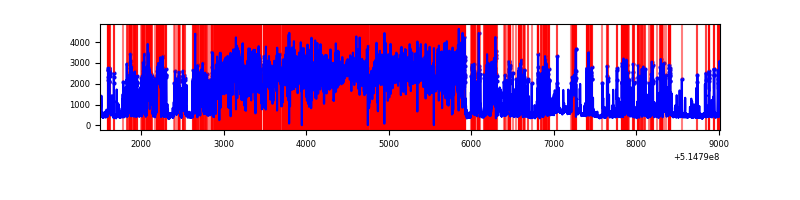 |
Top three noisy pixels from each quadrant. If the there are fewer than three noisy pixels in the level2.evt file, extra rows are filled as -1
| Pixel properties | Quadrant properties | ||||||
|---|---|---|---|---|---|---|---|
| Quadrant | DetID | PixID | Counts | Sigma | Mean | Median | Sigma |
| A | 3 | 95 | 414877 | 2101.45 | 799 | 778 | 197.1 |
| A | 4 | 236 | 24944 | 122.64 | 799 | 778 | 197.1 |
| A | 4 | 3 | 11969 | 56.79 | 799 | 778 | 197.1 |
| B | 9 | 251 | 238476 | 1399.13 | 789 | 759 | 169.9 |
| B | 0 | 213 | 83423 | 486.53 | 789 | 759 | 169.9 |
| B | 4 | 201 | 54114 | 314.03 | 789 | 759 | 169.9 |
| C | 15 | 224 | 7051949 | 39685.96 | 652 | 647 | 177.7 |
| C | 12 | 254 | 406639 | 2284.99 | 652 | 647 | 177.7 |
| C | 12 | 252 | 101658 | 568.51 | 652 | 647 | 177.7 |
| D | 12 | 33 | 9177973 | 59184.33 | 549 | 522 | 155.1 |
| D | 8 | 240 | 178747 | 1149.35 | 549 | 522 | 155.1 |
| D | 2 | 249 | 164657 | 1058.49 | 549 | 522 | 155.1 |
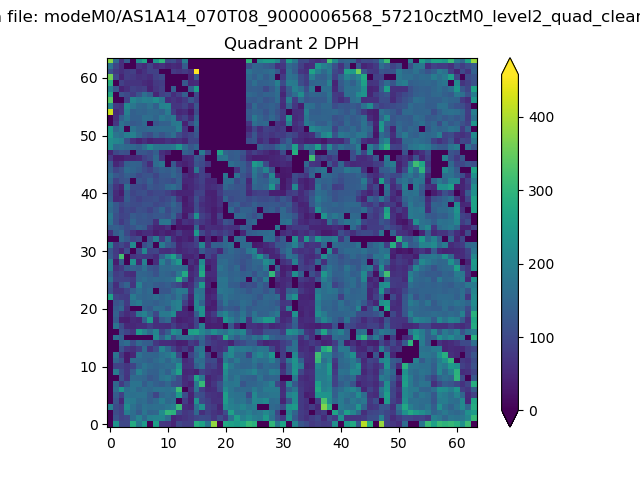
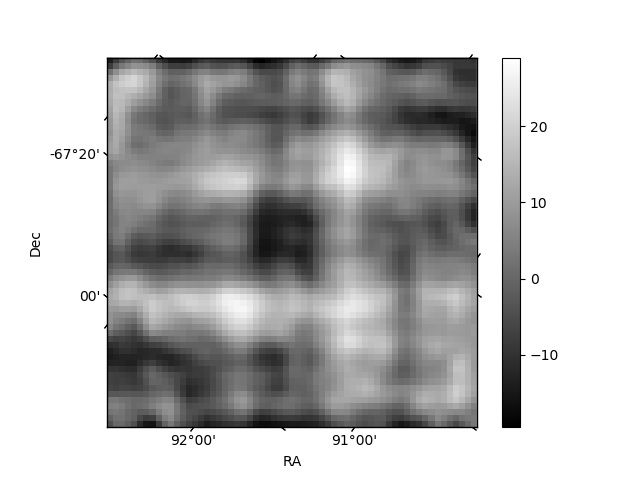
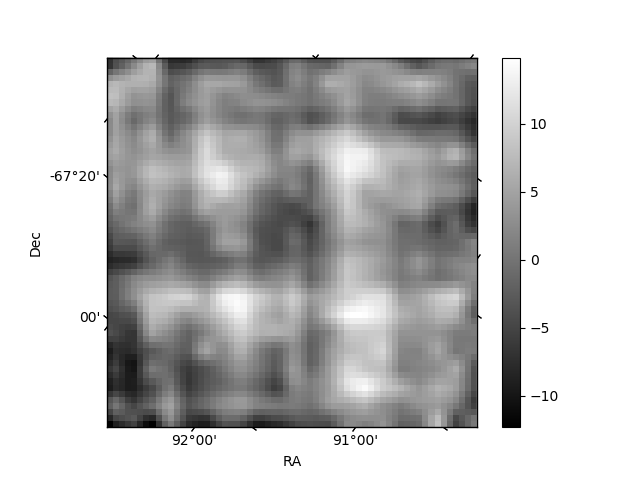
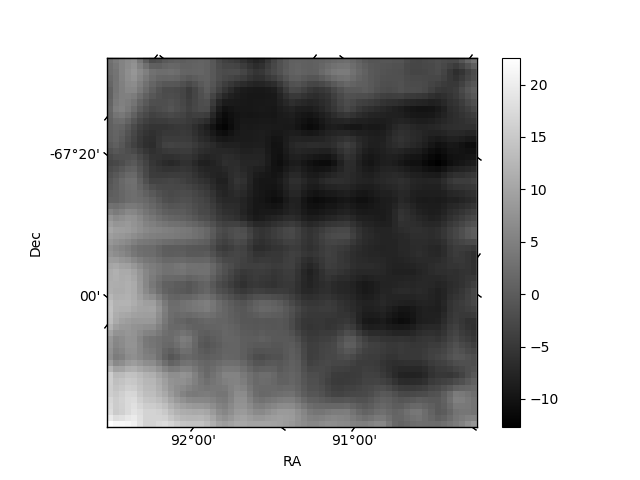
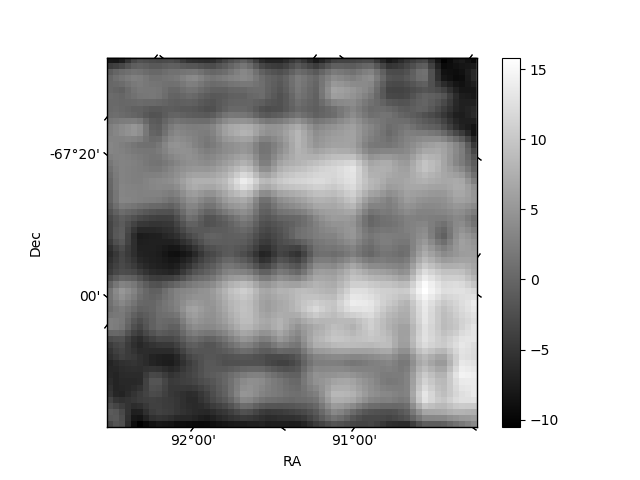
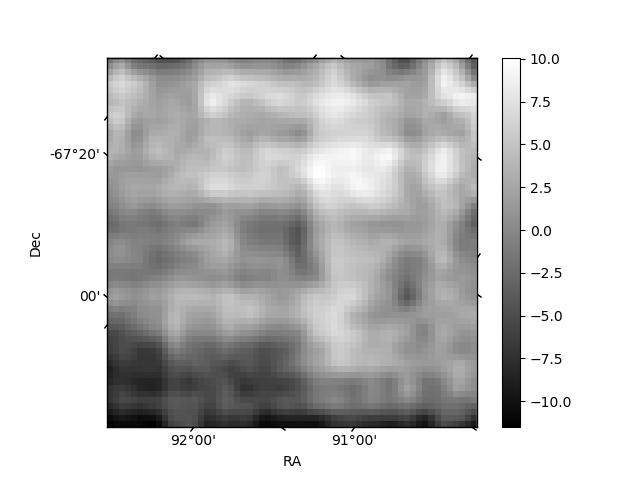
Histogram calculated using DETX and DETY for each event in the final _common_clean file
| Quadrant A | 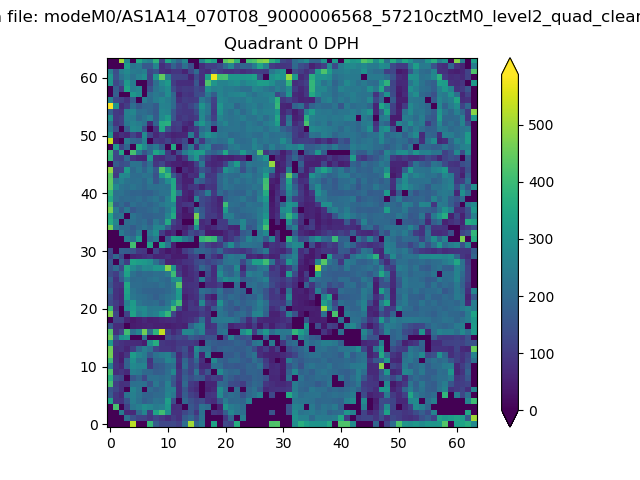 |
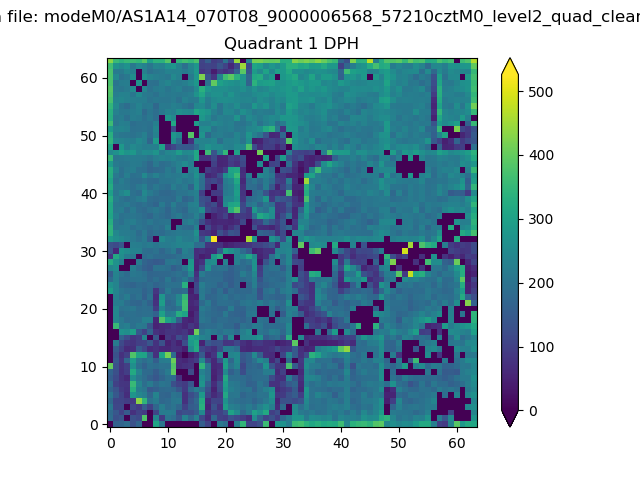 |
Quadrant B |
|---|---|---|---|
| Quadrant D | 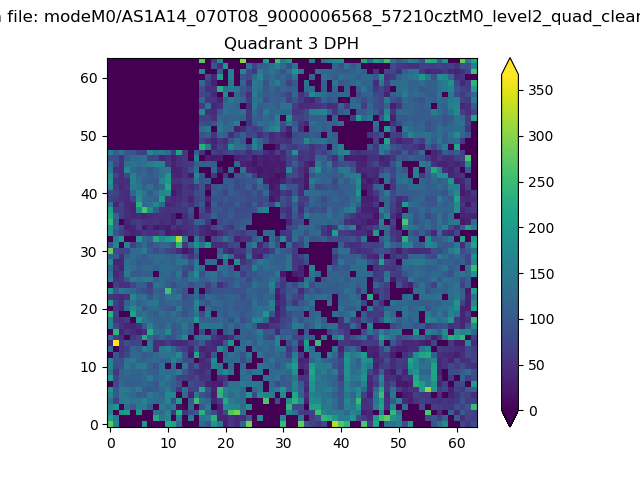 |
 |
Quadrant C |
| Plot type | Count rate plots | Images |
|---|---|---|
| Comparison with Poisson distribution Blue bars denote a histogram of data divided into 1 sec bins. Red curve is a Poisson curve with rate = median count rate of data. |
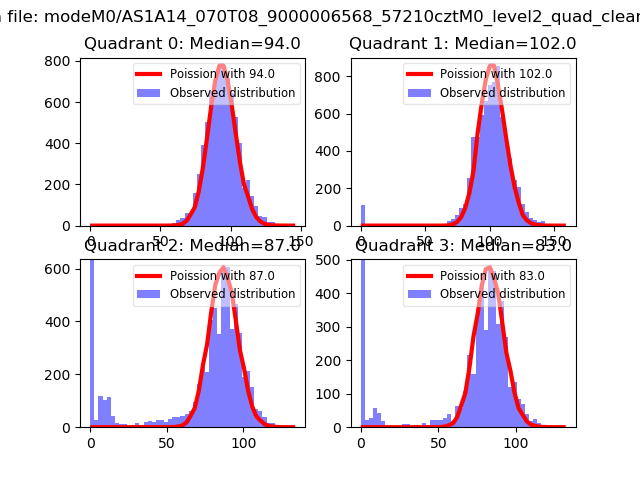 |
 |
| Quadrant-wise count rates Data is divided into 100 sec bins |
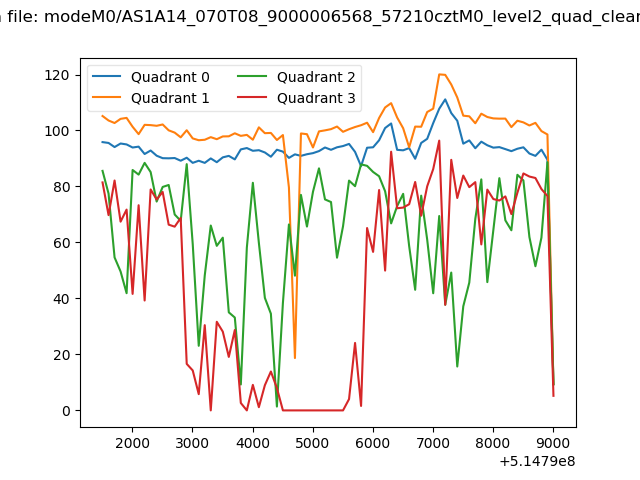 |
|
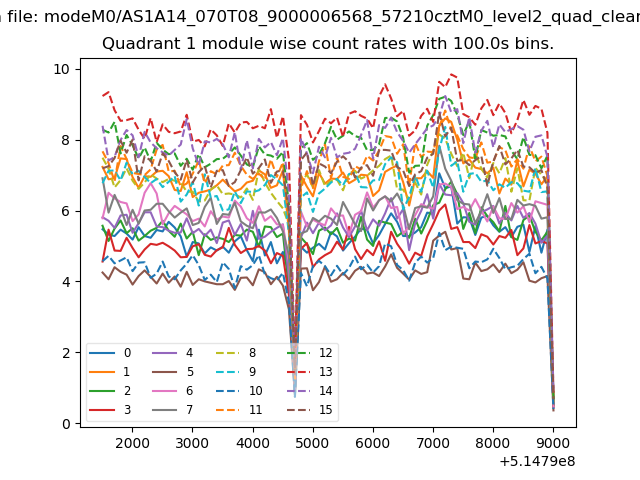
| Module-wise count rates for Quadrant A Data is divided into 100 sec bins |
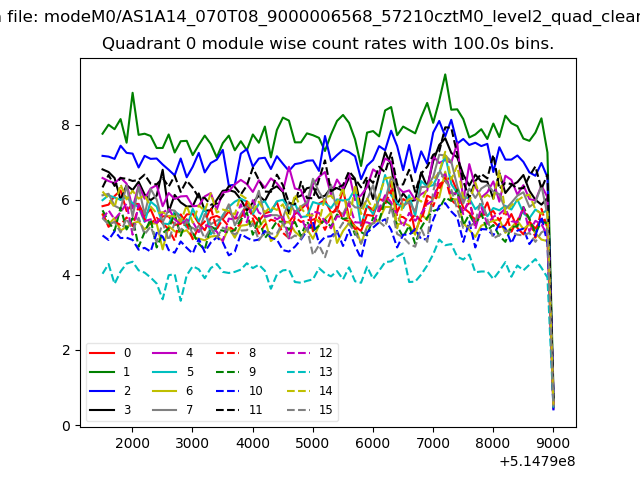 |
 |
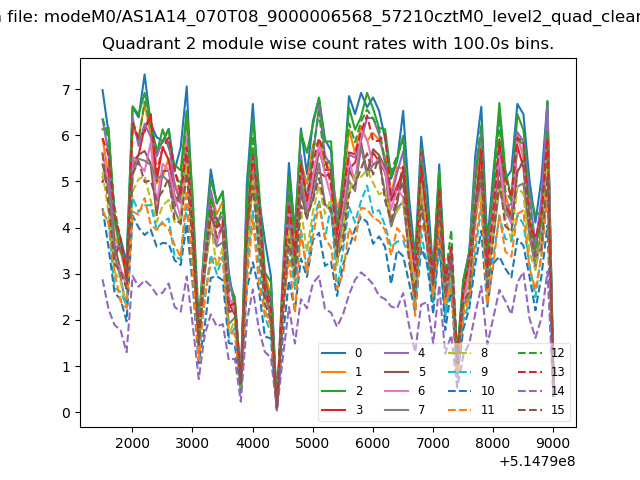
| Module-wise count rates for Quadrant B Data is divided into 100 sec bins |
 |
 |
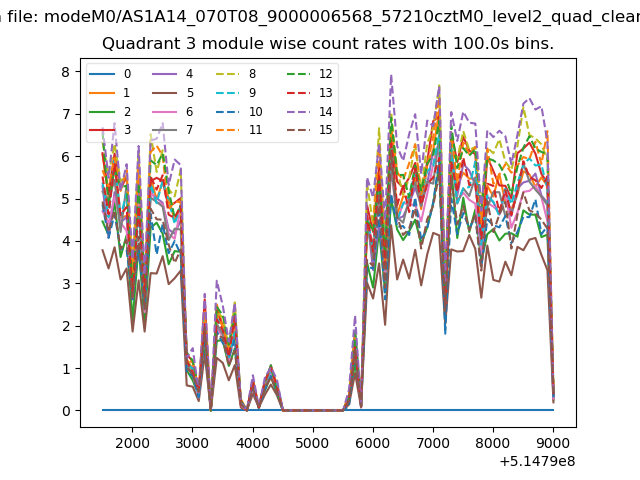
| Module-wise count rates for Quadrant C Data is divided into 100 sec bins |
 |
 |
| Module-wise count rates for Quadrant D Data is divided into 100 sec bins |
 |
 |
| Parameter | Plot |
|---|---|
| CZT HV Monitor |  |
| D_VDD | 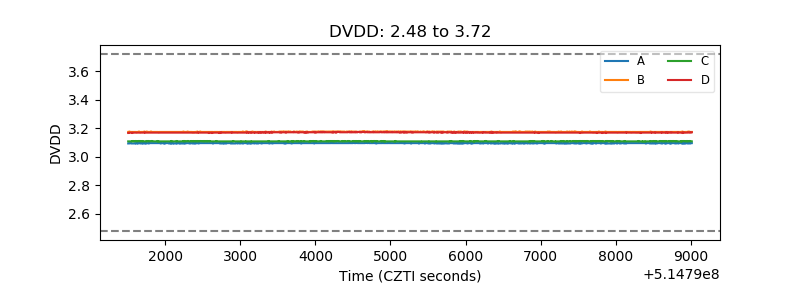 |
| Temperature 1 | 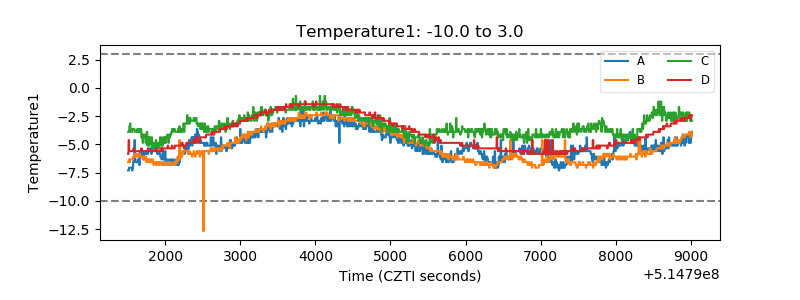 |
| Veto HV Monitor | 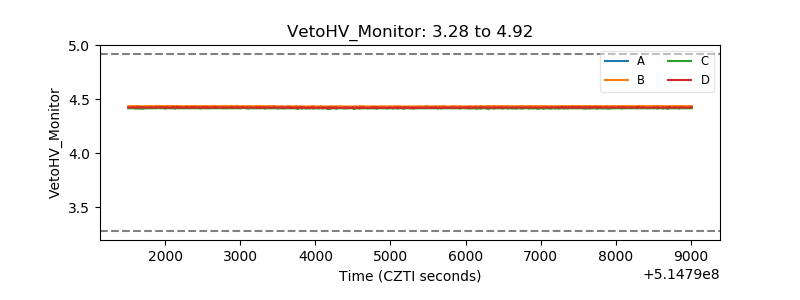 |
| Veto LLD | 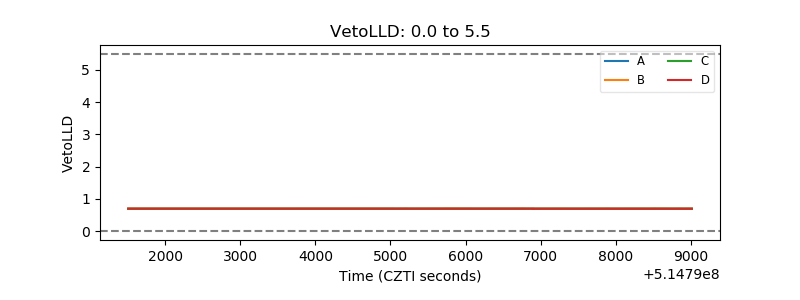 |
| Alpha Counter | 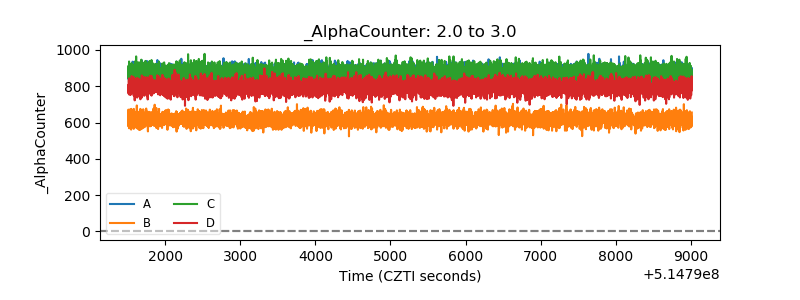 |
| _CPM_Rate | 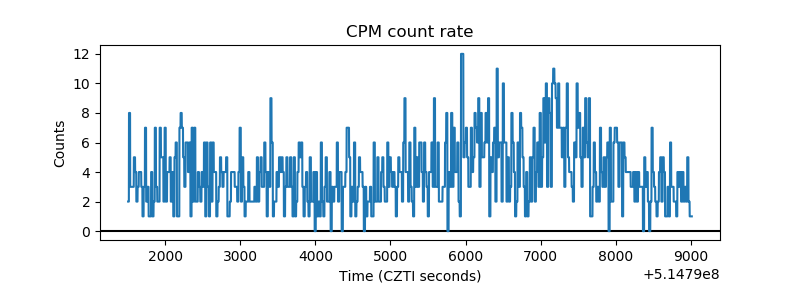 |
| CZT Counter | 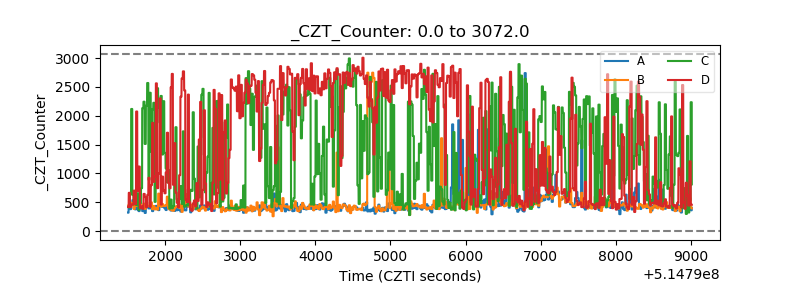 |
| +2.5 Volts monitor | 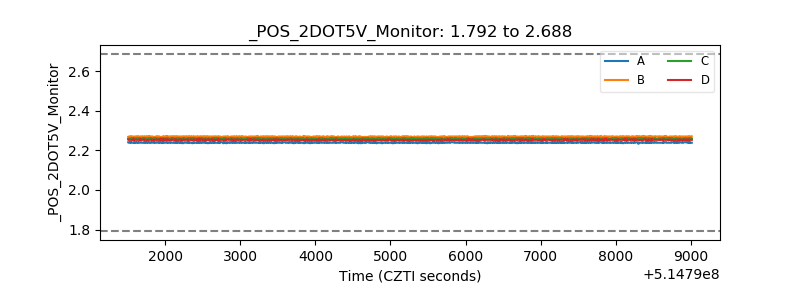 |
| +5 Volts monitor |  |
| _ROLL_ROT | 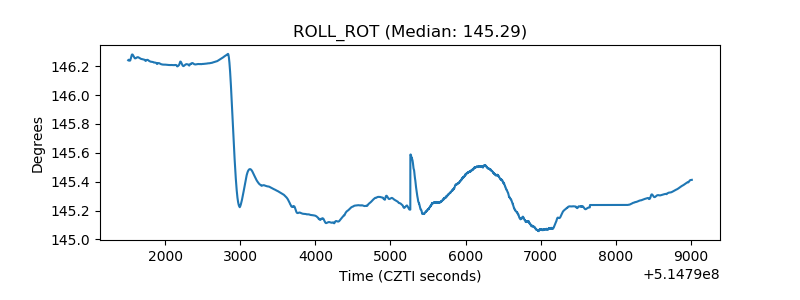 |
| _Roll_DEC | 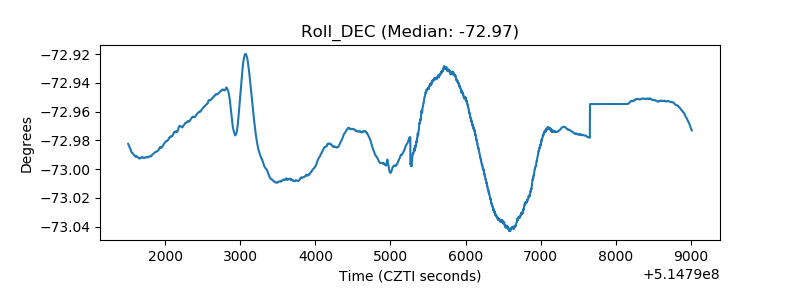 |
| _Roll_RA | 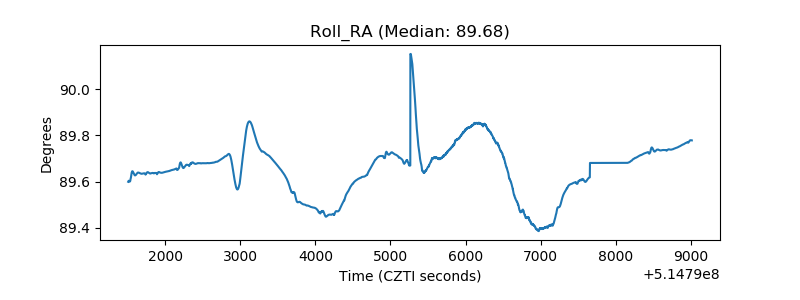 |
| Veto Counter | 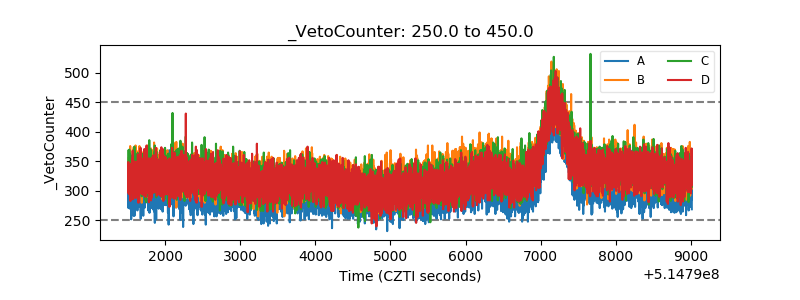 |