| Param | Original file | Final file |
|---|---|---|
| Filename | modeM0/AS1A14_070T08_9000006568_57213cztM0_level2.fits | modeM0/AS1A14_070T08_9000006568_57213cztM0_level2_quad_clean.evt |
| Size (bytes) | 1,494,624,960 | 244,647,360 |
| Size | 1.4 GB | 233.3 MB |
| Events in quadrant A | 7,870,223 | 1,699,574 |
| Events in quadrant B | 9,779,165 | 1,806,903 |
| Events in quadrant C | 20,563,880 | 1,293,648 |
| Events in quadrant D | 15,688,654 | 1,338,747 |
| Mode M9 | |||
|---|---|---|---|
| Quadrant | BADHDUFLAG | Total packets | Discarded packets |
| A | 0 | 13 | 0 |
| B | 0 | 13 | 0 |
| C | 0 | 13 | 0 |
| D | 0 | 13 | 0 |
| Mode SS | |||
|---|---|---|---|
| Quadrant | BADHDUFLAG | Total packets | Discarded packets |
| A | 0 | 372 | 0 |
| B | 0 | 372 | 0 |
| C | 0 | 372 | 0 |
| D | 0 | 372 | 0 |
| Mode M0 | |||
|---|---|---|---|
| Quadrant | BADHDUFLAG | Total packets | Discarded packets |
| A | 0 | 37656 | 3 |
| B | 0 | 42018 | 3 |
| C | 0 | 73958 | 3 |
| D | 0 | 59499 | 3 |
| Quadrant | Total seconds | Saturated seconds | Saturation percentage |
|---|---|---|---|
| A | 18401 | 290 | 1.576001% |
| B | 18402 | 699 | 3.798500% |
| C | 18402 | 4163 | 22.622541% |
| D | 18402 | 2388 | 12.976850% |
Noise dominated data is calculated using 1-second bins in cleaned event files. If a bin has >2000 counts, and if more than 50% of those come from <1% of pixels, then it is considered to be noise-dominated and hence unusable.
| Quadrant | # 1 sec bins | Bins with >0 counts | Bins with >2000 counts | High rate bins dominated by noise | Noise dominated (total time) | Noise dominated (detector-on time) | Marked lightcurve |
|---|---|---|---|---|---|---|---|
| A | 19641 | 18404 | 8 | 8 | 0.04% | 0.04% | 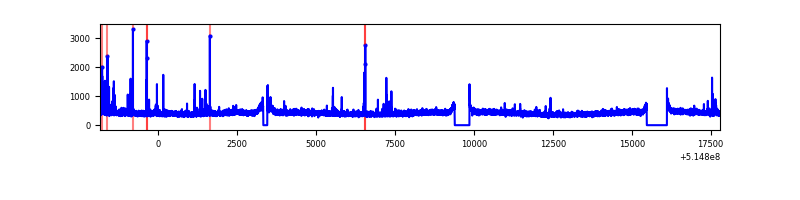 |
| B | 19642 | 18405 | 229 | 229 | 1.17% | 1.24% | 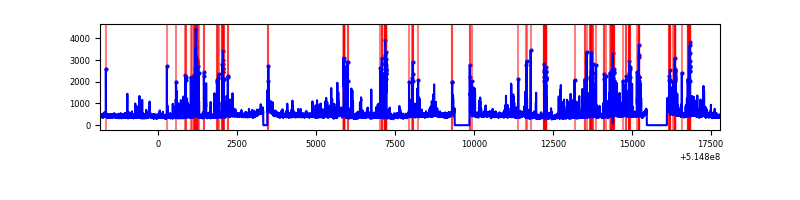 |
| C | 19642 | 18405 | 3185 | 3185 | 16.22% | 17.31% | 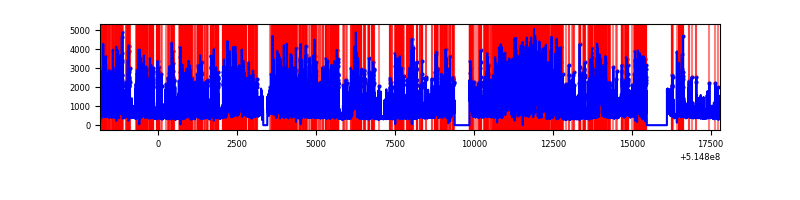 |
| D | 19642 | 18405 | 2216 | 2216 | 11.28% | 12.04% | 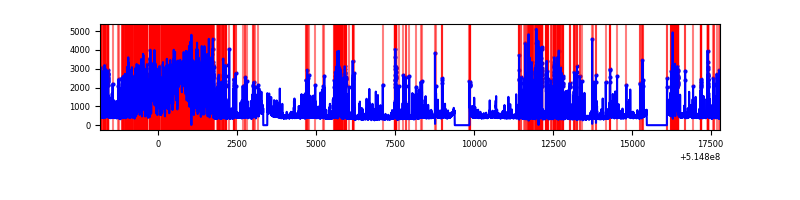 |
Top three noisy pixels from each quadrant. If the there are fewer than three noisy pixels in the level2.evt file, extra rows are filled as -1
| Pixel properties | Quadrant properties | ||||||
|---|---|---|---|---|---|---|---|
| Quadrant | DetID | PixID | Counts | Sigma | Mean | Median | Sigma |
| A | 3 | 95 | 89251 | 179.77 | 1980 | 1930 | 485.7 |
| A | 13 | 248 | 51361 | 101.76 | 1980 | 1930 | 485.7 |
| A | 10 | 251 | 28489 | 54.68 | 1980 | 1930 | 485.7 |
| B | 5 | 185 | 866306 | 2116.96 | 1931 | 1854 | 408.3 |
| B | 4 | 201 | 236895 | 575.59 | 1931 | 1854 | 408.3 |
| B | 0 | 155 | 158366 | 383.28 | 1931 | 1854 | 408.3 |
| C | 15 | 224 | 13131169 | 28181.04 | 1728 | 1710 | 465.9 |
| C | 12 | 254 | 319176 | 681.41 | 1728 | 1710 | 465.9 |
| C | 12 | 252 | 106345 | 224.59 | 1728 | 1710 | 465.9 |
| D | 12 | 33 | 6444699 | 12573.02 | 1819 | 1737 | 512.4 |
| D | 8 | 240 | 581359 | 1131.09 | 1819 | 1737 | 512.4 |
| D | 12 | 128 | 404775 | 786.5 | 1819 | 1737 | 512.4 |
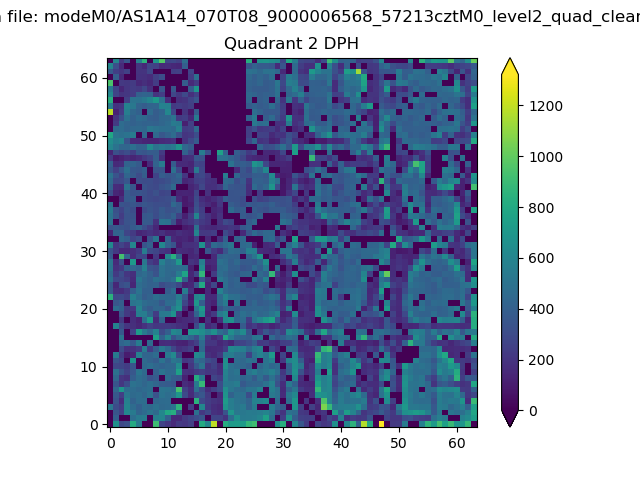
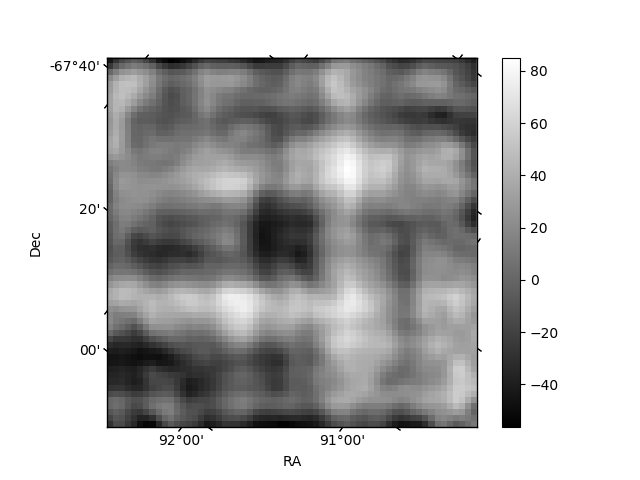
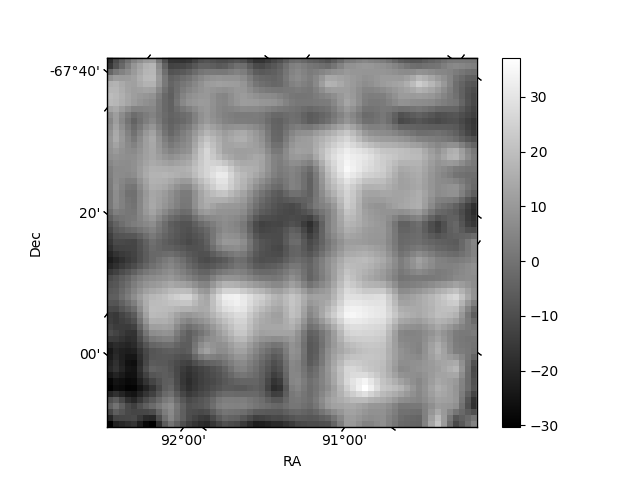
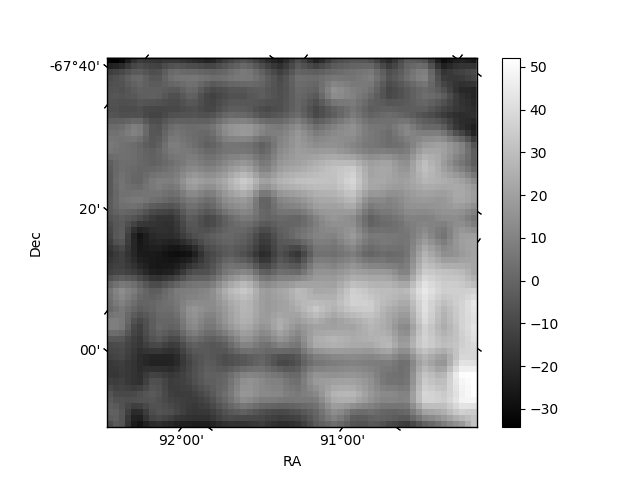
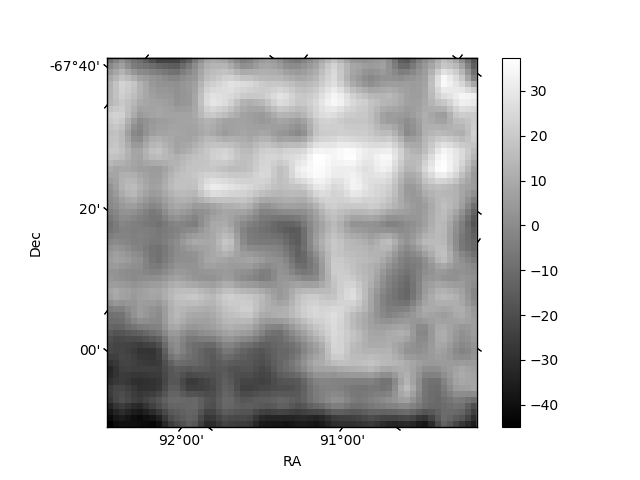
Histogram calculated using DETX and DETY for each event in the final _common_clean file
| Quadrant A | 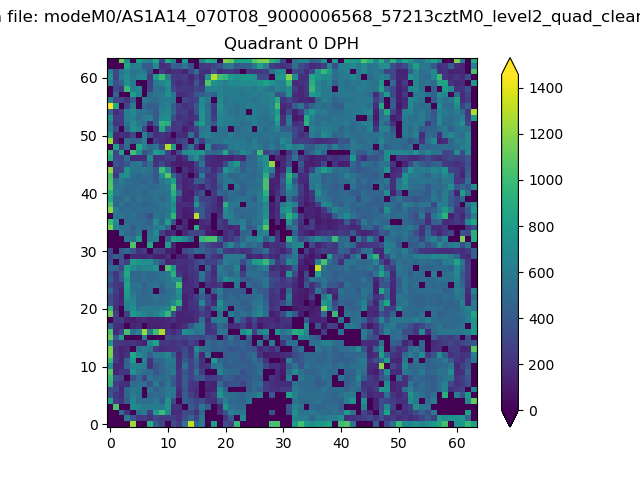 |
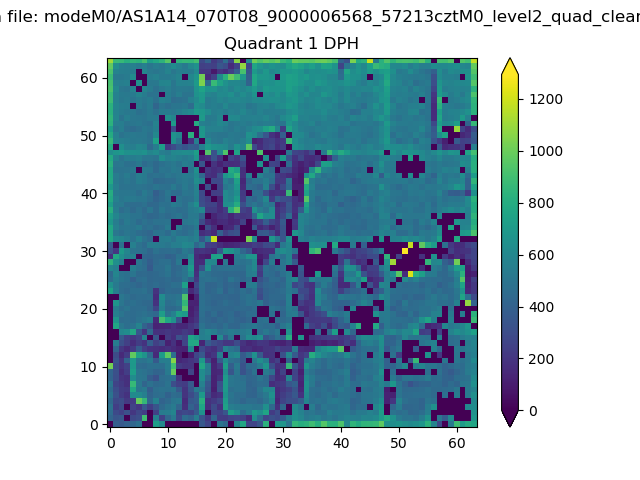 |
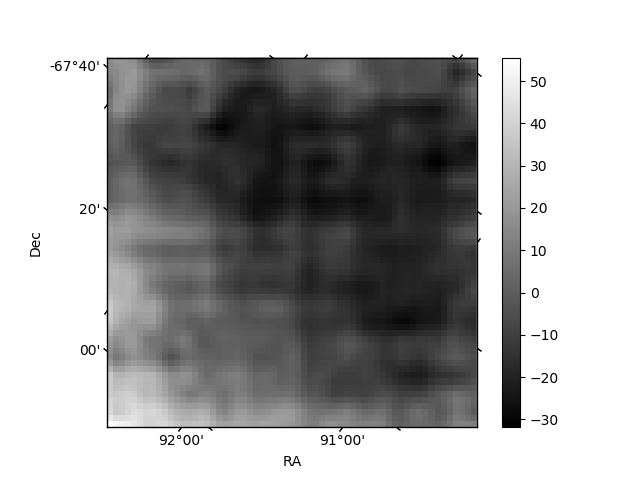
Quadrant B |
|---|---|---|---|
| Quadrant D | 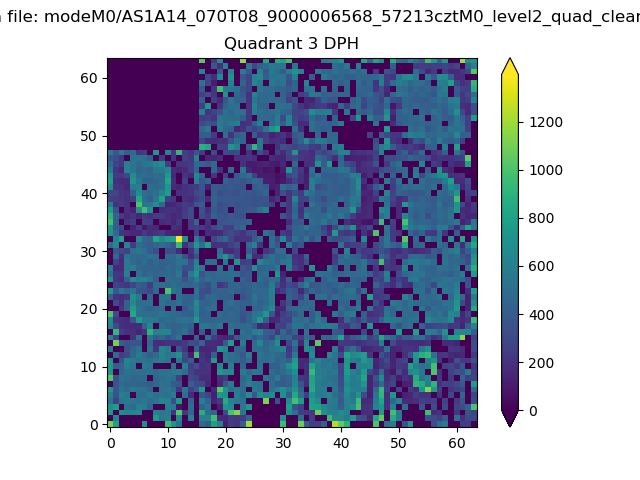 |
 |
Quadrant C |
| Plot type | Count rate plots | Images |
|---|---|---|
| Comparison with Poisson distribution Blue bars denote a histogram of data divided into 1 sec bins. Red curve is a Poisson curve with rate = median count rate of data. |
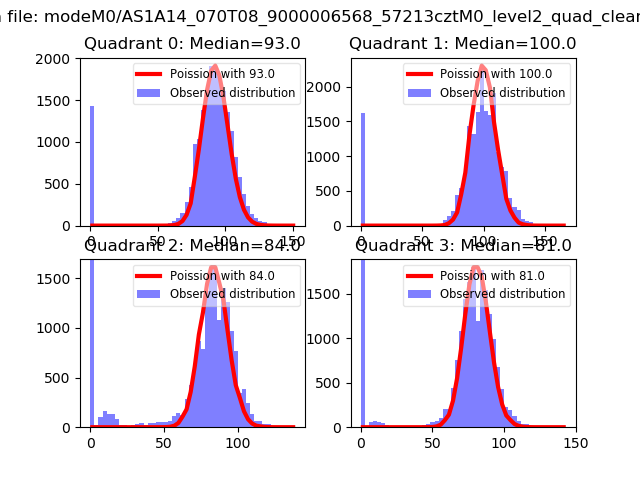 |
 |
| Quadrant-wise count rates Data is divided into 100 sec bins |
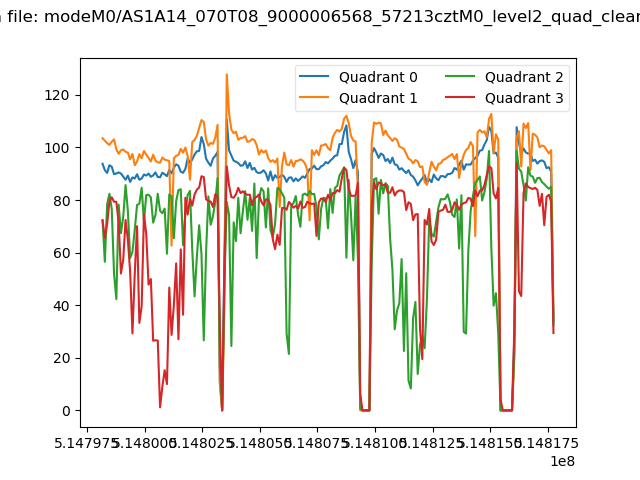 |
|
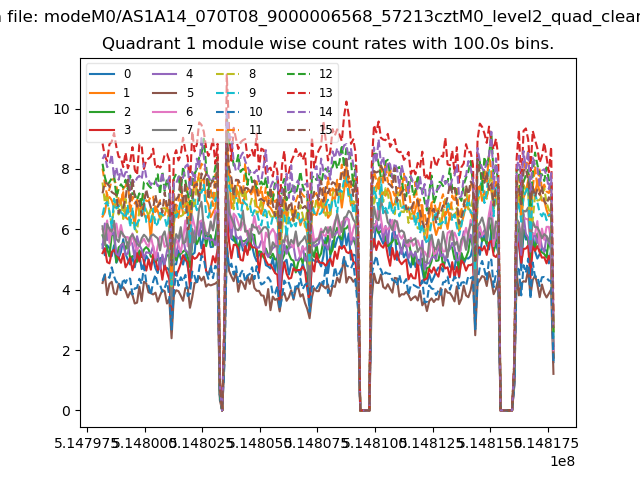
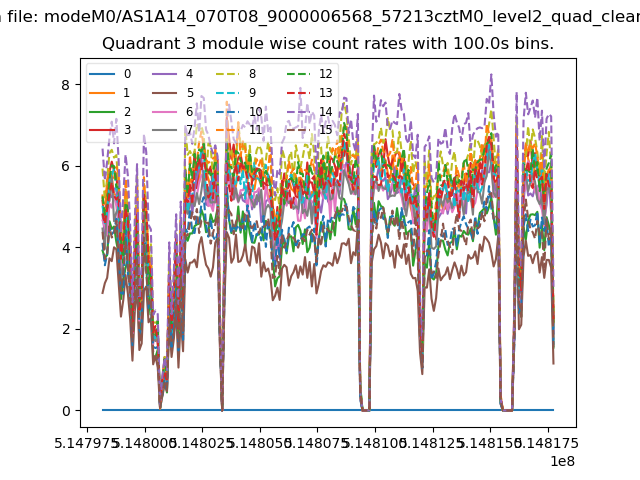
| Module-wise count rates for Quadrant A Data is divided into 100 sec bins |
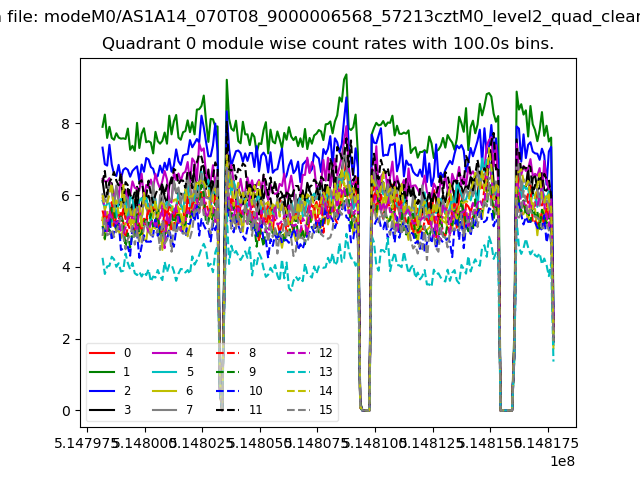 |
 |
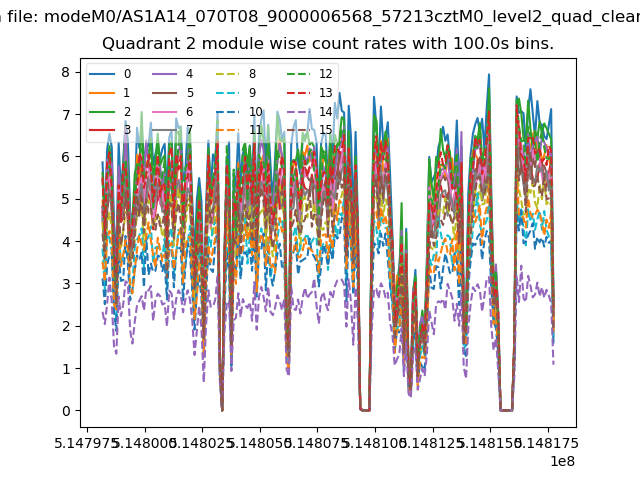
| Module-wise count rates for Quadrant B Data is divided into 100 sec bins |
 |
 |
| Module-wise count rates for Quadrant C Data is divided into 100 sec bins |
 |
 |
| Module-wise count rates for Quadrant D Data is divided into 100 sec bins |
 |
 |
| Parameter | Plot |
|---|---|
| CZT HV Monitor | 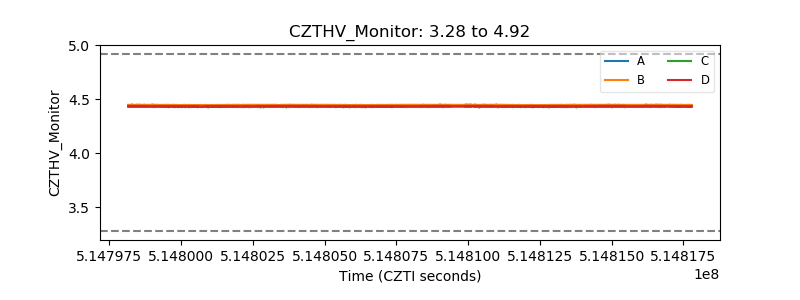 |
| D_VDD | 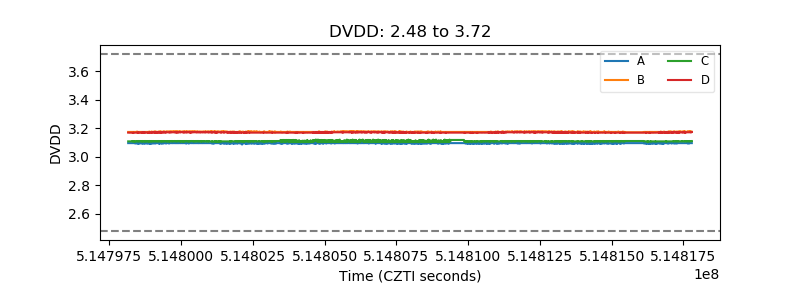 |
| Temperature 1 | 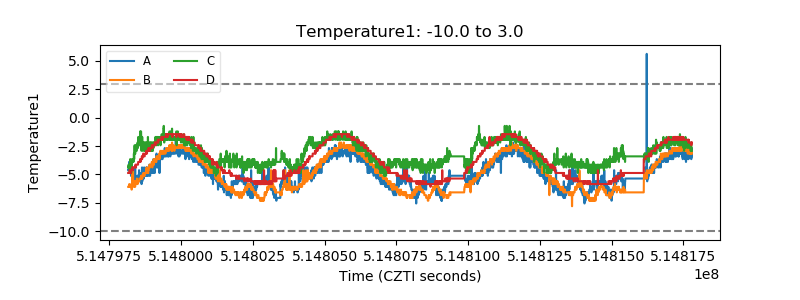 |
| Veto HV Monitor | 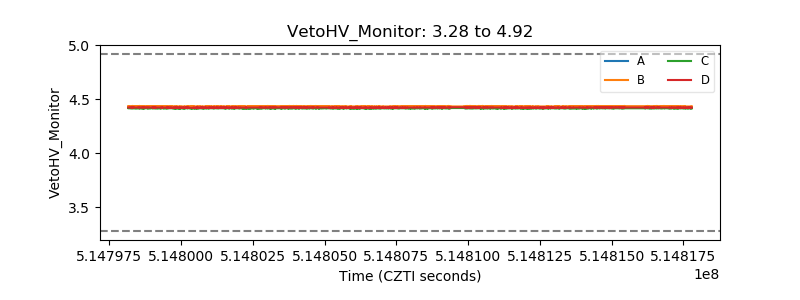 |
| Veto LLD | 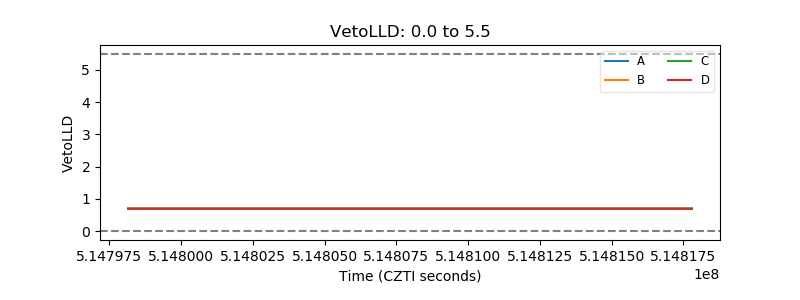 |
| Alpha Counter | 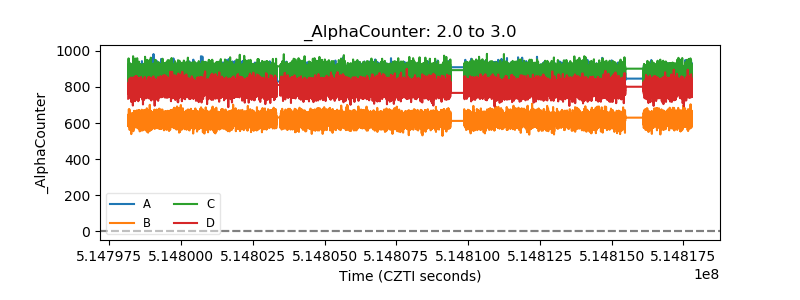 |
| _CPM_Rate | 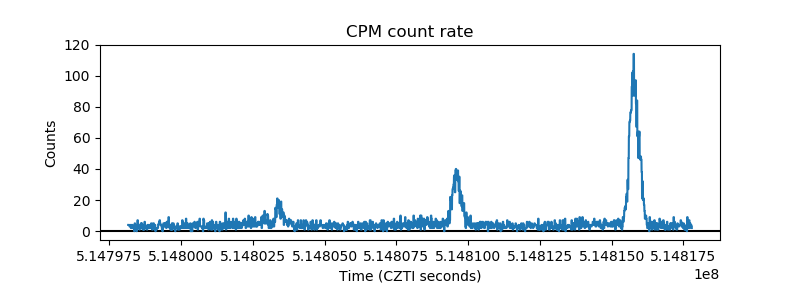 |
| CZT Counter | 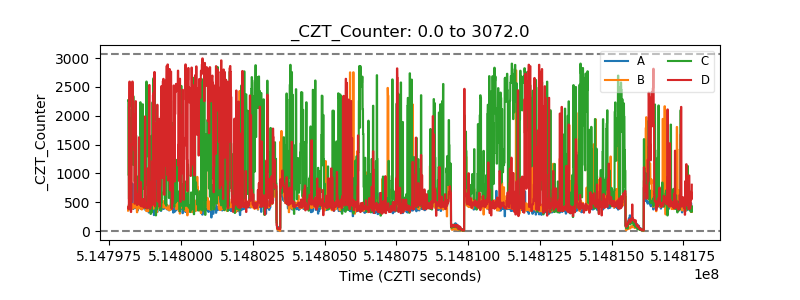 |
| +2.5 Volts monitor |  |
| +5 Volts monitor |  |
| _ROLL_ROT | 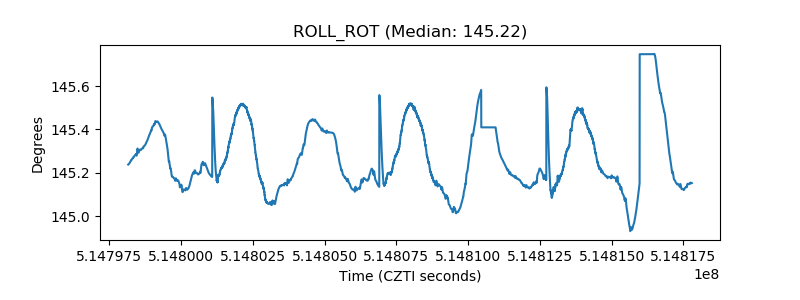 |
| _Roll_DEC | 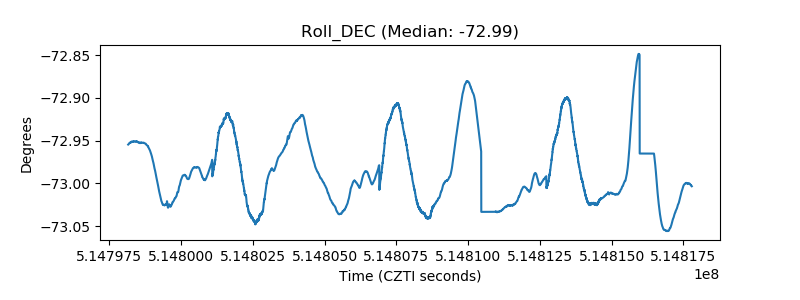 |
| _Roll_RA | 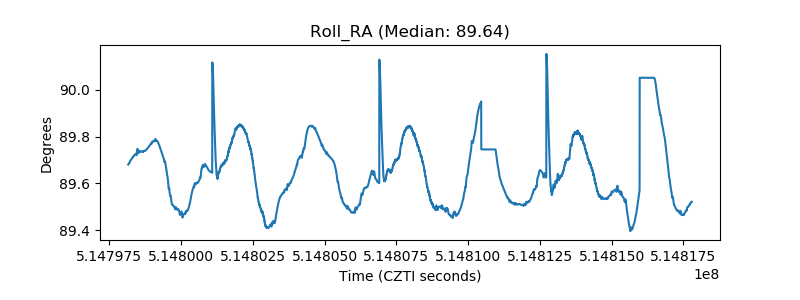 |
| Veto Counter | 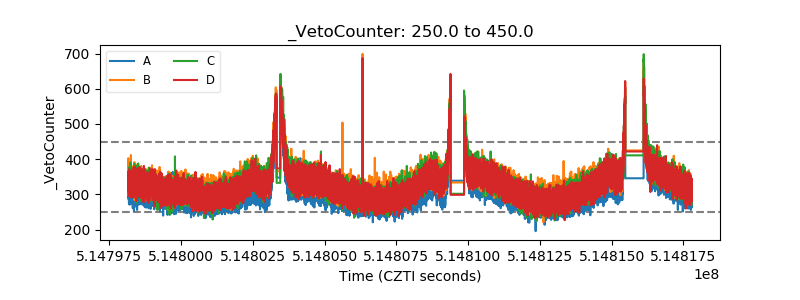 |