| Param | Original file | Final file |
|---|---|---|
| Filename | modeM0/AS1A14_070T08_9000006568_57214cztM0_level2.fits | modeM0/AS1A14_070T08_9000006568_57214cztM0_level2_quad_clean.evt |
| Size (bytes) | 455,630,400 | 95,526,720 |
| Size | 434.5 MB | 91.1 MB |
| Events in quadrant A | 2,832,417 | 635,669 |
| Events in quadrant B | 4,069,230 | 672,466 |
| Events in quadrant C | 5,205,294 | 570,400 |
| Events in quadrant D | 4,241,158 | 549,368 |
| Mode M9 | |||
|---|---|---|---|
| Quadrant | BADHDUFLAG | Total packets | Discarded packets |
| A | 0 | 8 | 0 |
| B | 0 | 8 | 0 |
| C | 0 | 8 | 0 |
| D | 0 | 8 | 0 |
| Mode SS | |||
|---|---|---|---|
| Quadrant | BADHDUFLAG | Total packets | Discarded packets |
| A | 0 | 136 | 0 |
| B | 0 | 136 | 0 |
| C | 0 | 136 | 0 |
| D | 0 | 136 | 0 |
| Mode M0 | |||
|---|---|---|---|
| Quadrant | BADHDUFLAG | Total packets | Discarded packets |
| A | 0 | 13487 | 1 |
| B | 0 | 16843 | 1 |
| C | 0 | 20222 | 1 |
| D | 0 | 17288 | 2 |
| Quadrant | Total seconds | Saturated seconds | Saturation percentage |
|---|---|---|---|
| A | 6660 | 35 | 0.525526% |
| B | 6661 | 167 | 2.507131% |
| C | 6661 | 522 | 7.836661% |
| D | 6660 | 340 | 5.105105% |
Noise dominated data is calculated using 1-second bins in cleaned event files. If a bin has >2000 counts, and if more than 50% of those come from <1% of pixels, then it is considered to be noise-dominated and hence unusable.
| Quadrant | # 1 sec bins | Bins with >0 counts | Bins with >2000 counts | High rate bins dominated by noise | Noise dominated (total time) | Noise dominated (detector-on time) | Marked lightcurve |
|---|---|---|---|---|---|---|---|
| A | 7500 | 6661 | 0 | 0 | 0.00% | 0.00% | 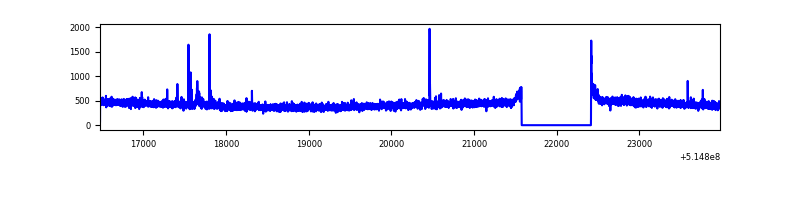 |
| B | 7501 | 6662 | 49 | 49 | 0.65% | 0.74% | 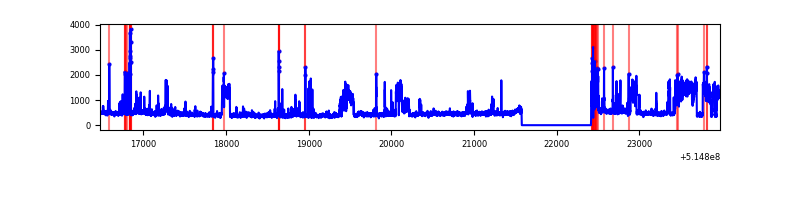 |
| C | 7501 | 6662 | 386 | 386 | 5.15% | 5.79% | 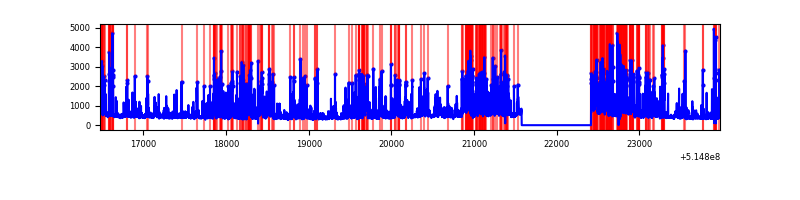 |
| D | 7500 | 6661 | 319 | 319 | 4.25% | 4.79% | 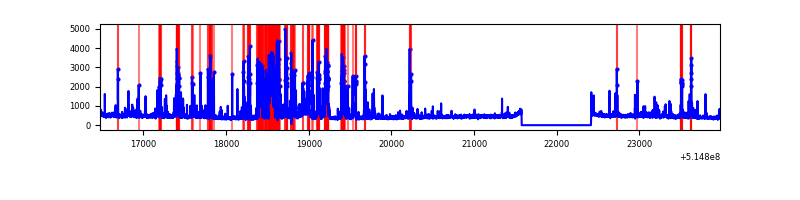 |
Top three noisy pixels from each quadrant. If the there are fewer than three noisy pixels in the level2.evt file, extra rows are filled as -1
| Pixel properties | Quadrant properties | ||||||
|---|---|---|---|---|---|---|---|
| Quadrant | DetID | PixID | Counts | Sigma | Mean | Median | Sigma |
| A | 13 | 248 | 27859 | 151.77 | 718 | 697 | 179.0 |
| A | 8 | 6 | 18643 | 100.28 | 718 | 697 | 179.0 |
| A | 13 | 254 | 9572 | 49.59 | 718 | 697 | 179.0 |
| B | 0 | 183 | 790006 | 5258.03 | 699 | 673 | 150.1 |
| B | 5 | 185 | 115295 | 763.54 | 699 | 673 | 150.1 |
| B | 10 | 16 | 108755 | 719.97 | 699 | 673 | 150.1 |
| C | 15 | 224 | 2339563 | 12879.61 | 668 | 660 | 181.6 |
| C | 12 | 254 | 80359 | 438.88 | 668 | 660 | 181.6 |
| C | 12 | 252 | 48591 | 263.94 | 668 | 660 | 181.6 |
| D | 12 | 33 | 744368 | 3860.1 | 677 | 646 | 192.7 |
| D | 12 | 128 | 291839 | 1511.36 | 677 | 646 | 192.7 |
| D | 7 | 238 | 169770 | 877.8 | 677 | 646 | 192.7 |
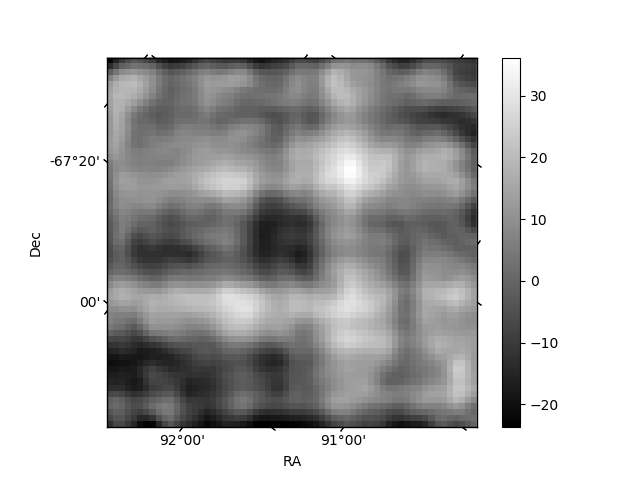
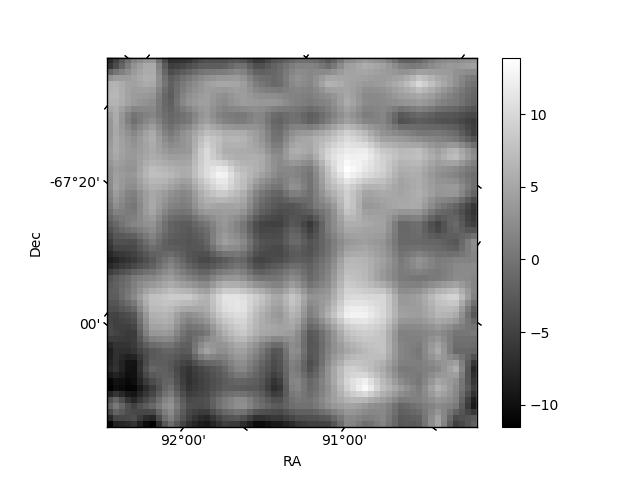
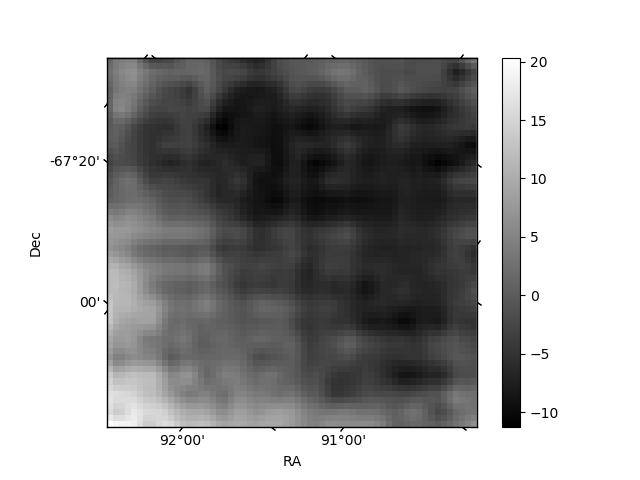
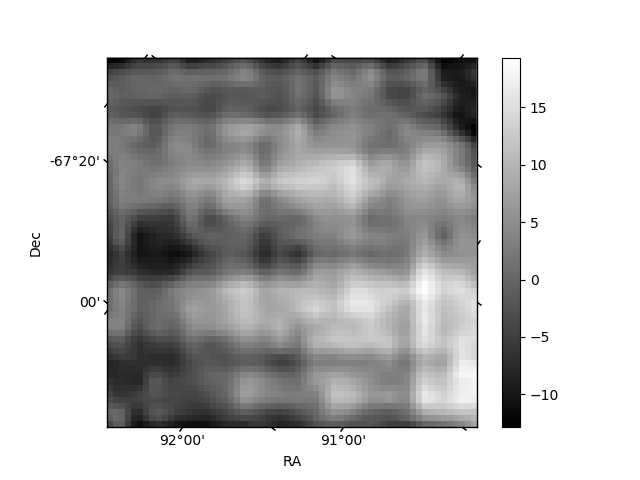
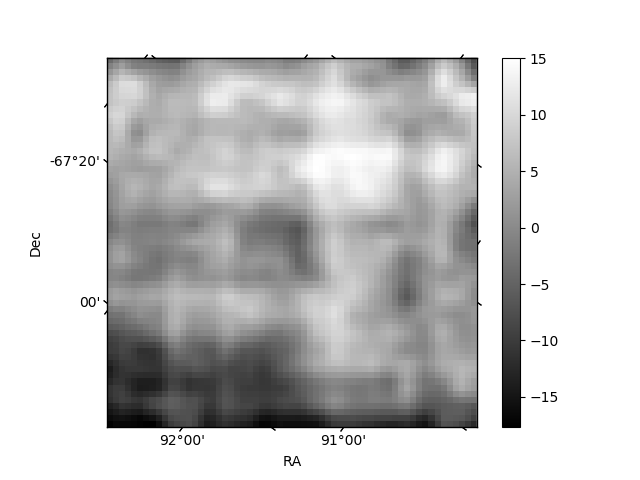
Histogram calculated using DETX and DETY for each event in the final _common_clean file
| Quadrant A | 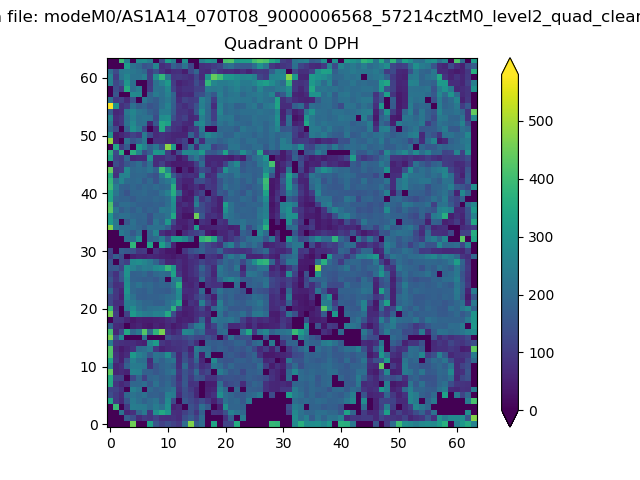 |
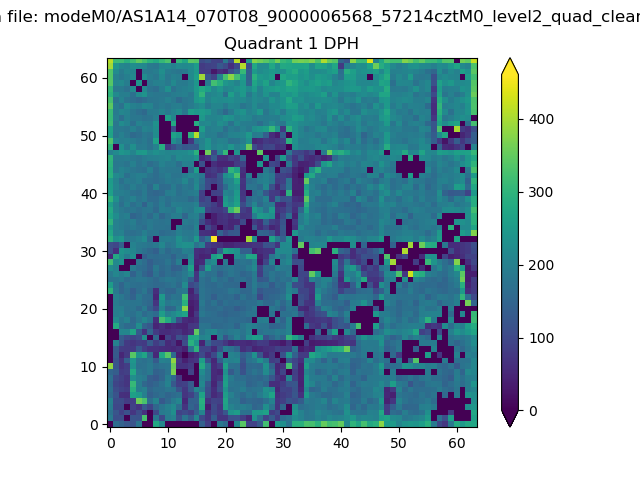 |
Quadrant B |
|---|---|---|---|
| Quadrant D | 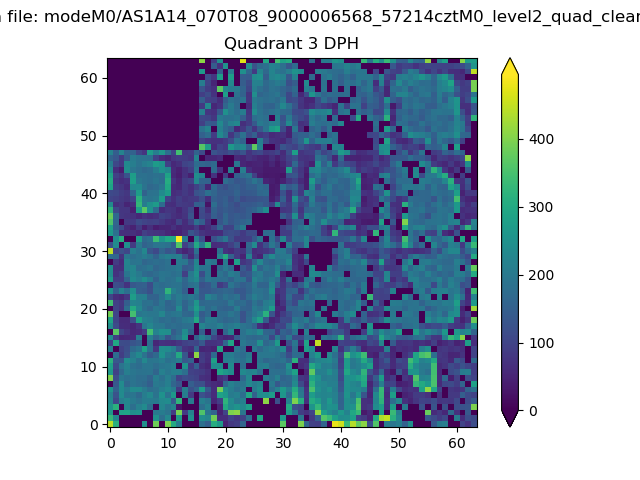 |
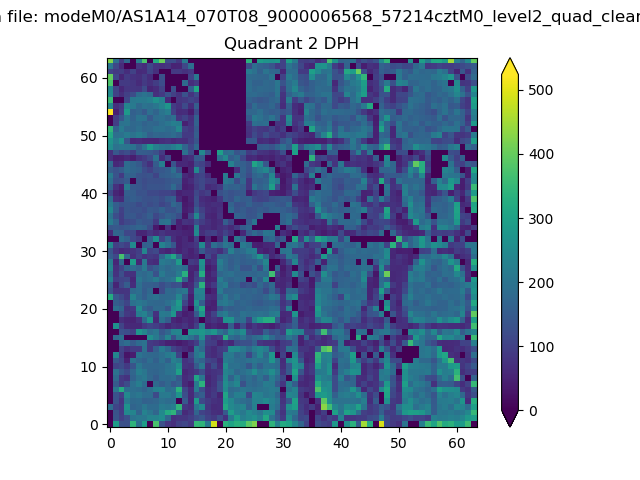 |
Quadrant C |
| Plot type | Count rate plots | Images |
|---|---|---|
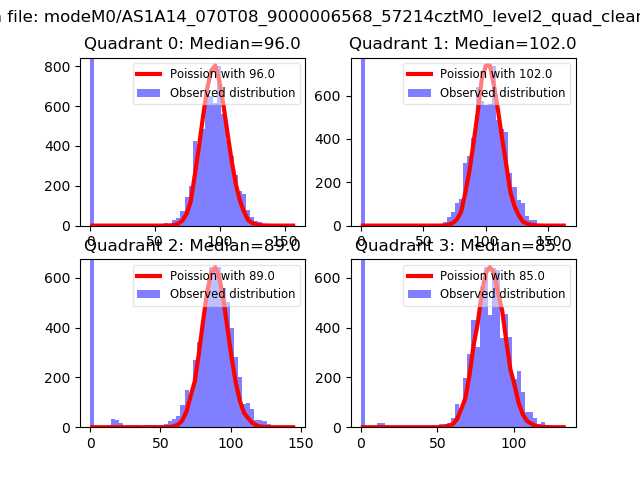
| Comparison with Poisson distribution Blue bars denote a histogram of data divided into 1 sec bins. Red curve is a Poisson curve with rate = median count rate of data. |
 |
 |
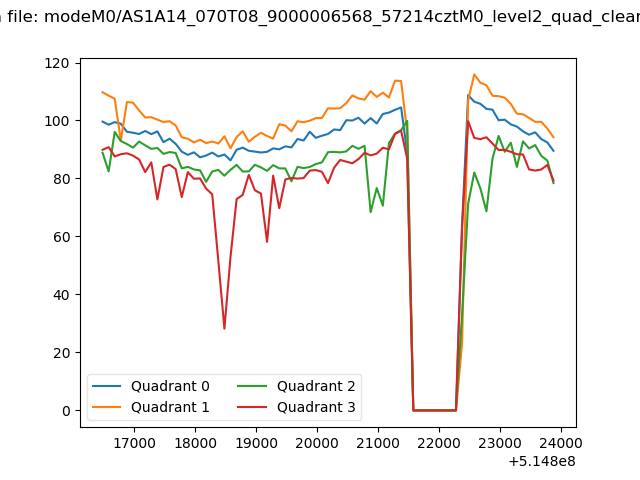
| Quadrant-wise count rates Data is divided into 100 sec bins |
 |
|
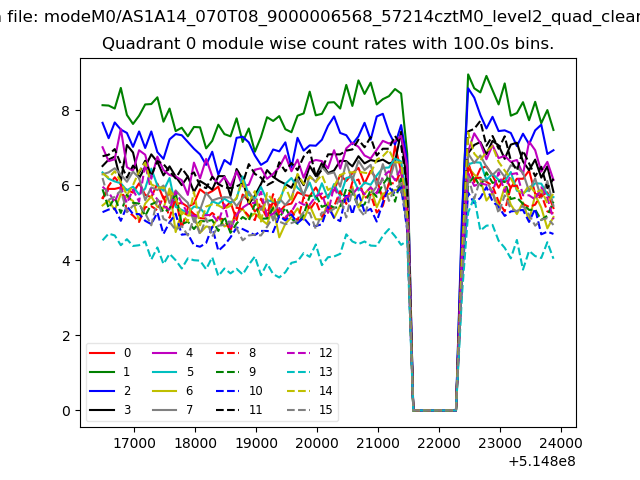
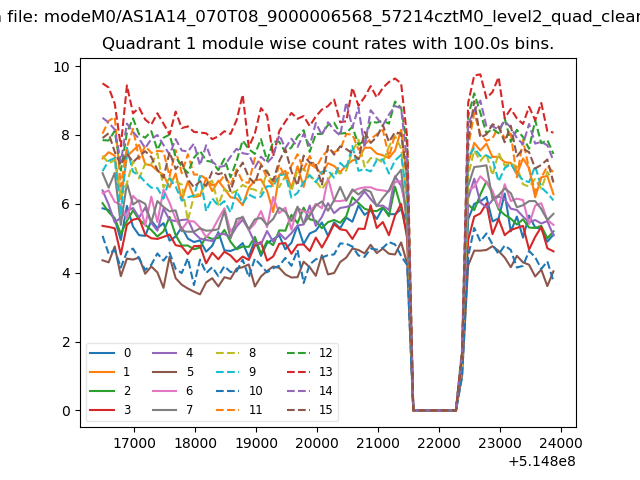
| Module-wise count rates for Quadrant A Data is divided into 100 sec bins |
 |
 |
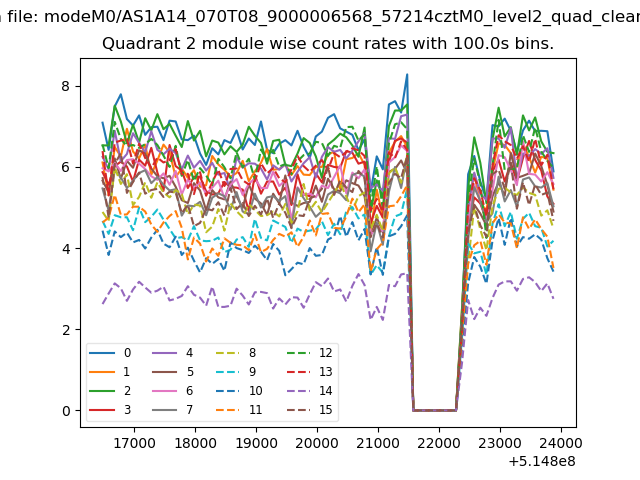
| Module-wise count rates for Quadrant B Data is divided into 100 sec bins |
 |
 |
| Module-wise count rates for Quadrant C Data is divided into 100 sec bins |
 |
 |
| Module-wise count rates for Quadrant D Data is divided into 100 sec bins |
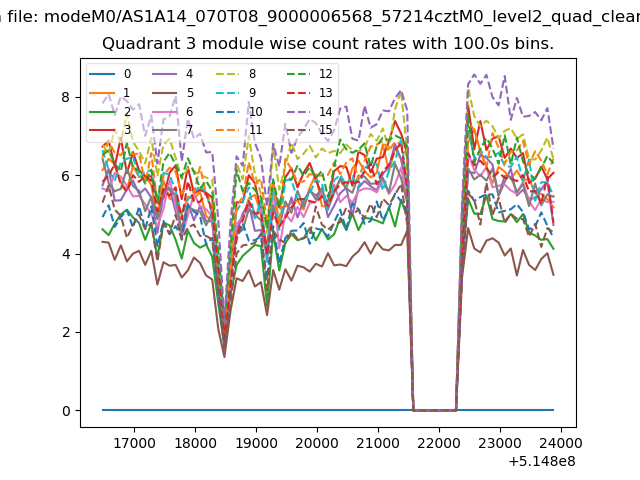 |
 |
| Parameter | Plot |
|---|---|
| CZT HV Monitor | 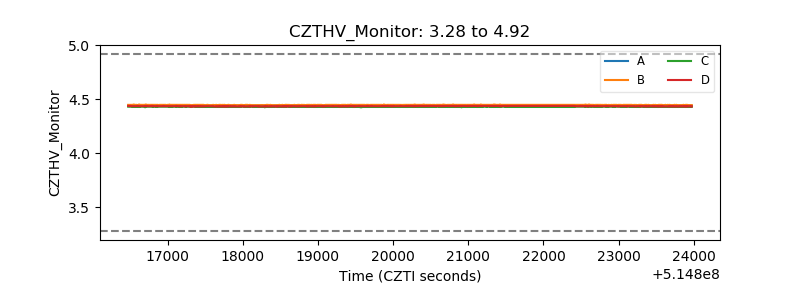 |
| D_VDD | 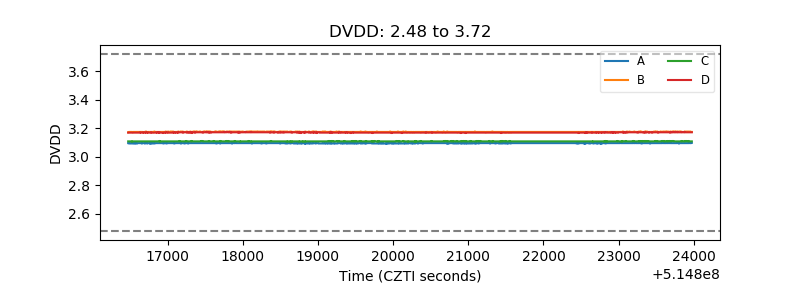 |
| Temperature 1 | 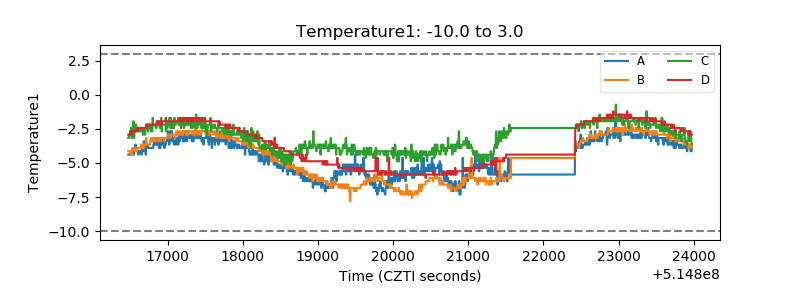 |
| Veto HV Monitor | 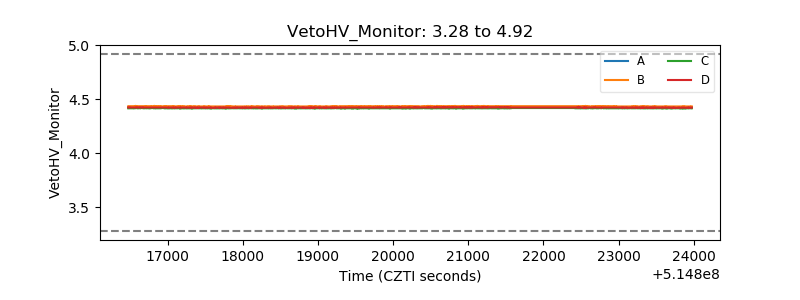 |
| Veto LLD | 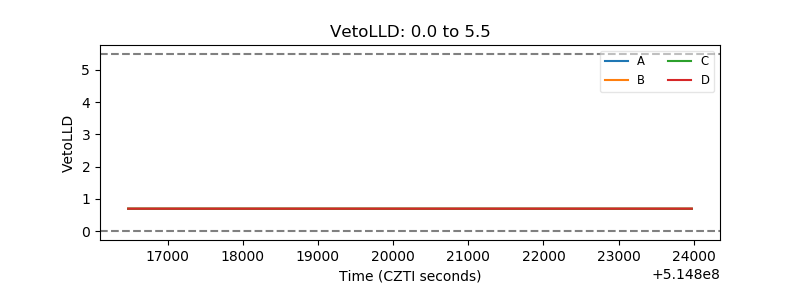 |
| Alpha Counter | 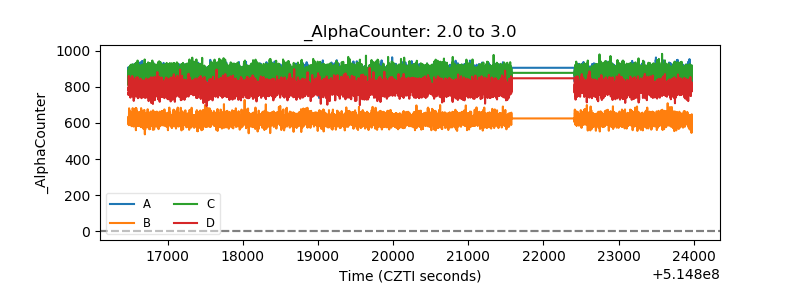 |
| _CPM_Rate | 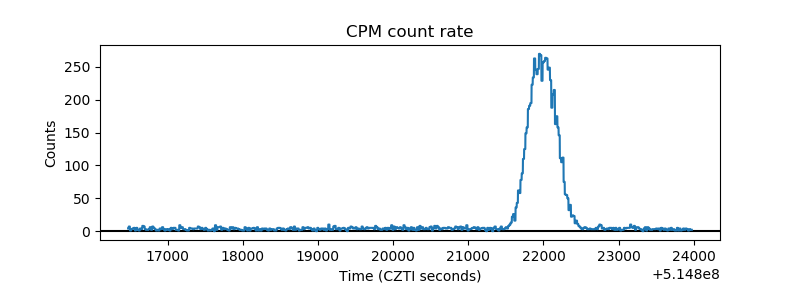 |
| CZT Counter | 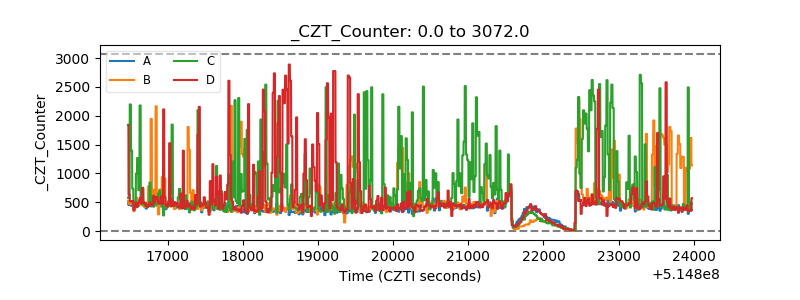 |
| +2.5 Volts monitor |  |
| +5 Volts monitor |  |
| _ROLL_ROT | 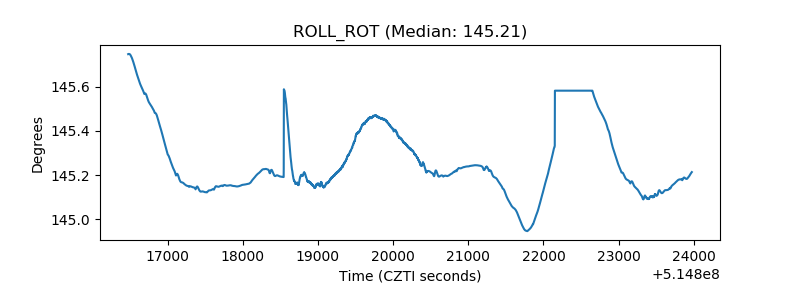 |
| _Roll_DEC | 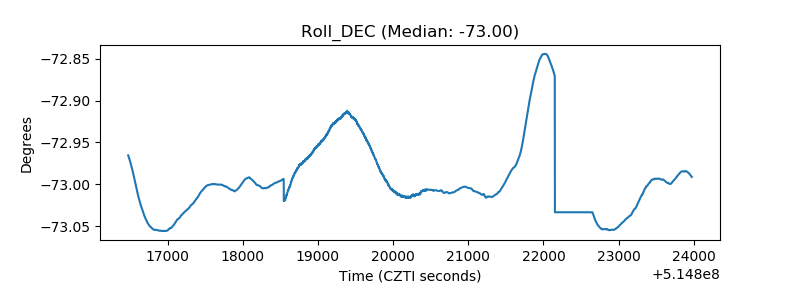 |
| _Roll_RA | 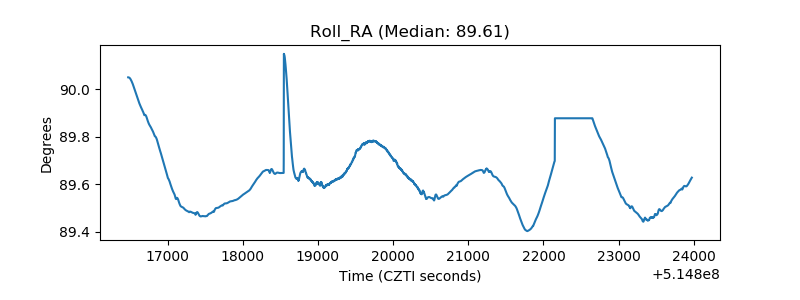 |
| Veto Counter | 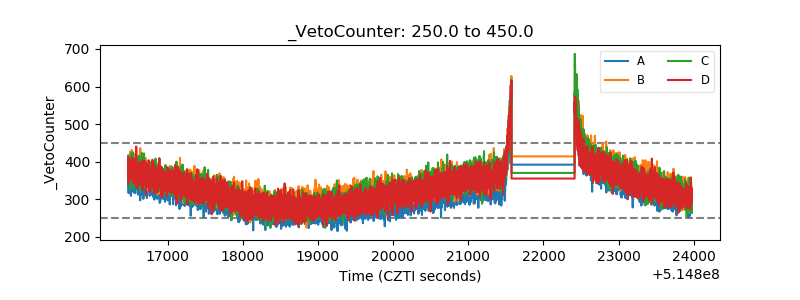 |