| Param | Original file | Final file |
|---|---|---|
| Filename | modeM0/AS1A14_070T08_9000006568_57216cztM0_level2.fits | modeM0/AS1A14_070T08_9000006568_57216cztM0_level2_quad_clean.evt |
| Size (bytes) | 458,061,120 | 90,046,080 |
| Size | 436.8 MB | 85.9 MB |
| Events in quadrant A | 3,658,232 | 548,833 |
| Events in quadrant B | 4,053,647 | 643,271 |
| Events in quadrant C | 5,449,364 | 543,856 |
| Events in quadrant D | 3,298,957 | 545,934 |
| Mode M9 | |||
|---|---|---|---|
| Quadrant | BADHDUFLAG | Total packets | Discarded packets |
| A | 0 | 10 | 0 |
| B | 0 | 10 | 0 |
| C | 0 | 10 | 0 |
| D | 0 | 10 | 0 |
| Mode SS | |||
|---|---|---|---|
| Quadrant | BADHDUFLAG | Total packets | Discarded packets |
| A | 0 | 128 | 0 |
| B | 0 | 128 | 0 |
| C | 0 | 130 | 0 |
| D | 0 | 130 | 0 |
| Mode M0 | |||
|---|---|---|---|
| Quadrant | BADHDUFLAG | Total packets | Discarded packets |
| A | 0 | 15715 | 1 |
| B | 0 | 16570 | 1 |
| C | 0 | 20743 | 1 |
| D | 0 | 14410 | 2 |
| Quadrant | Total seconds | Saturated seconds | Saturation percentage |
|---|---|---|---|
| A | 6373 | 679 | 10.654323% |
| B | 6373 | 225 | 3.530519% |
| C | 6374 | 600 | 9.413241% |
| D | 6373 | 113 | 1.773105% |
Noise dominated data is calculated using 1-second bins in cleaned event files. If a bin has >2000 counts, and if more than 50% of those come from <1% of pixels, then it is considered to be noise-dominated and hence unusable.
| Quadrant | # 1 sec bins | Bins with >0 counts | Bins with >2000 counts | High rate bins dominated by noise | Noise dominated (total time) | Noise dominated (detector-on time) | Marked lightcurve |
|---|---|---|---|---|---|---|---|
| A | 7382 | 6372 | 271 | 271 | 3.67% | 4.25% | 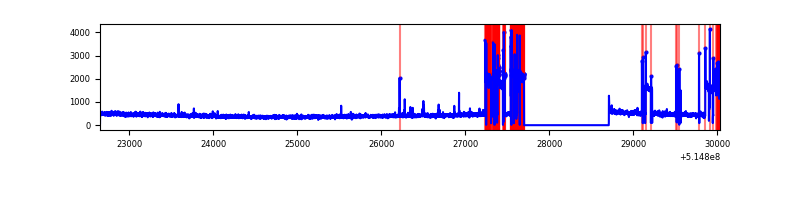 |
| B | 7383 | 6374 | 98 | 98 | 1.33% | 1.54% | 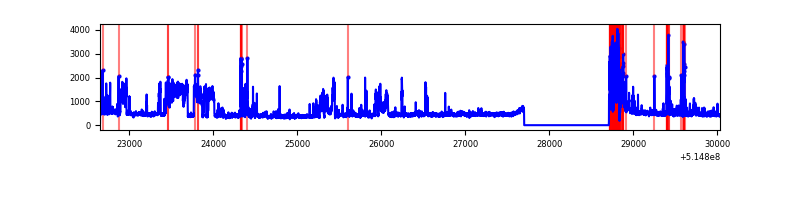 |
| C | 7384 | 6375 | 478 | 478 | 6.47% | 7.50% | 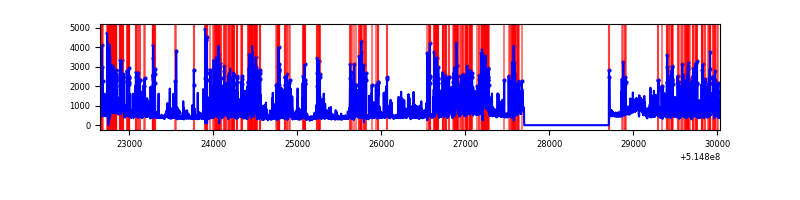 |
| D | 7382 | 6373 | 88 | 88 | 1.19% | 1.38% | 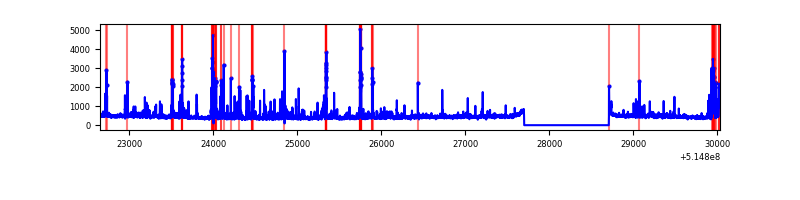 |
Top three noisy pixels from each quadrant. If the there are fewer than three noisy pixels in the level2.evt file, extra rows are filled as -1
| Pixel properties | Quadrant properties | ||||||
|---|---|---|---|---|---|---|---|
| Quadrant | DetID | PixID | Counts | Sigma | Mean | Median | Sigma |
| A | 0 | 128 | 1255895 | 8267.56 | 608 | 592 | 151.8 |
| A | 3 | 95 | 26226 | 168.83 | 608 | 592 | 151.8 |
| A | 13 | 248 | 9591 | 59.27 | 608 | 592 | 151.8 |
| B | 0 | 183 | 721382 | 5127.92 | 664 | 641 | 140.6 |
| B | 10 | 16 | 270042 | 1916.73 | 664 | 641 | 140.6 |
| B | 5 | 185 | 154227 | 1092.73 | 664 | 641 | 140.6 |
| C | 15 | 224 | 2785722 | 16122.98 | 631 | 627 | 172.7 |
| C | 12 | 254 | 64374 | 369.03 | 631 | 627 | 172.7 |
| C | 14 | 254 | 45000 | 256.88 | 631 | 627 | 172.7 |
| D | 12 | 33 | 222903 | 1188.57 | 652 | 621 | 187.0 |
| D | 8 | 240 | 174390 | 929.17 | 652 | 621 | 187.0 |
| D | 2 | 120 | 138600 | 737.79 | 652 | 621 | 187.0 |
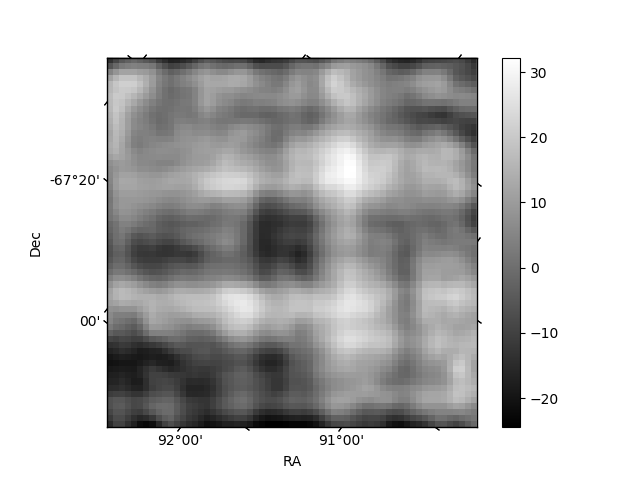
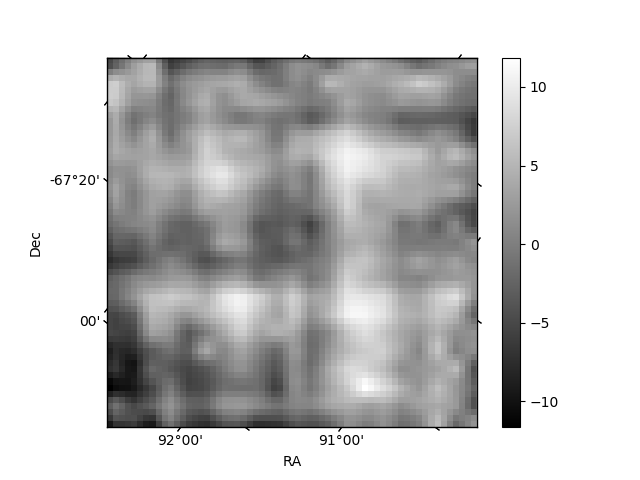
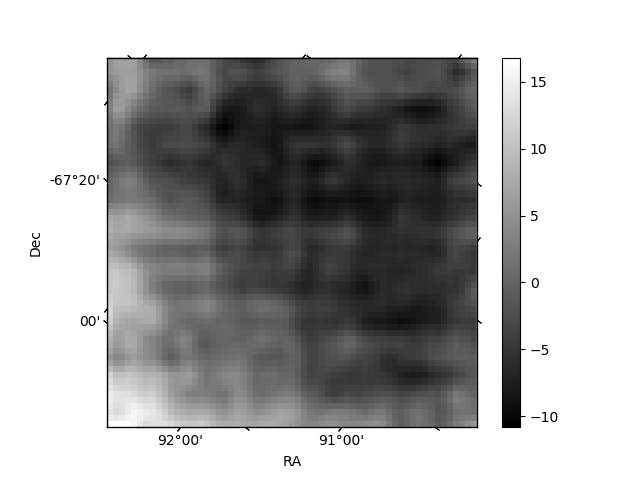
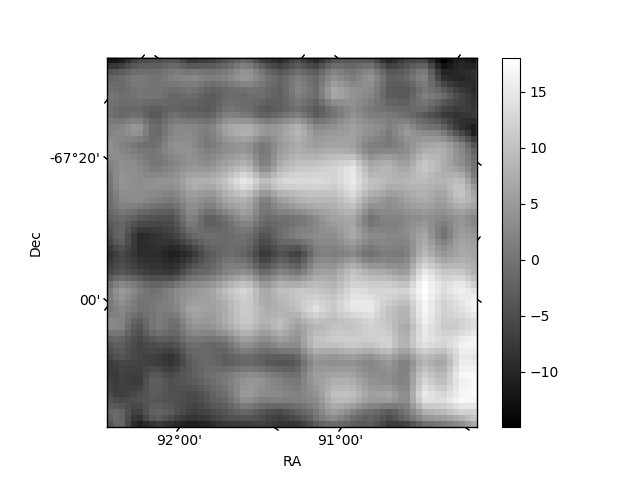
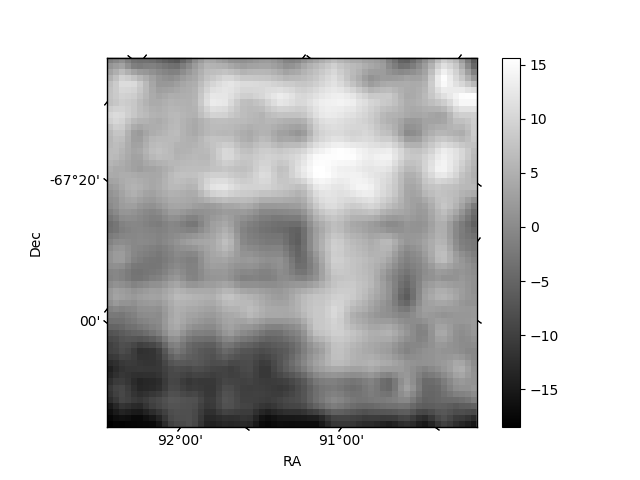
Histogram calculated using DETX and DETY for each event in the final _common_clean file
| Quadrant A | 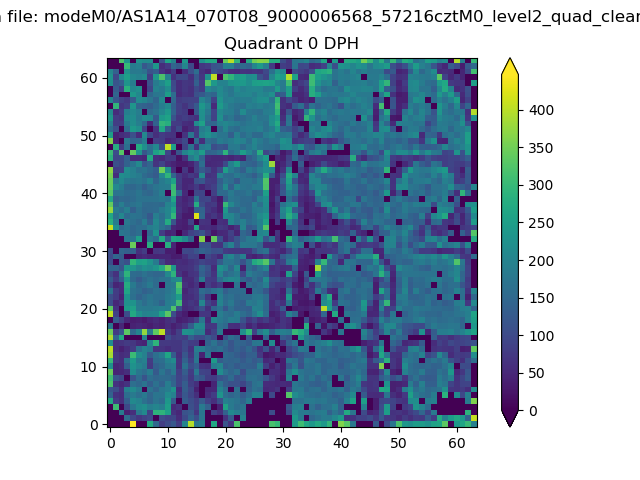 |
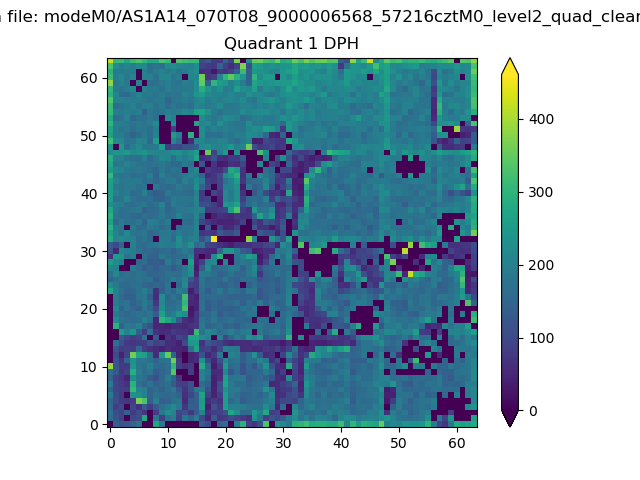 |
Quadrant B |
|---|---|---|---|
| Quadrant D | 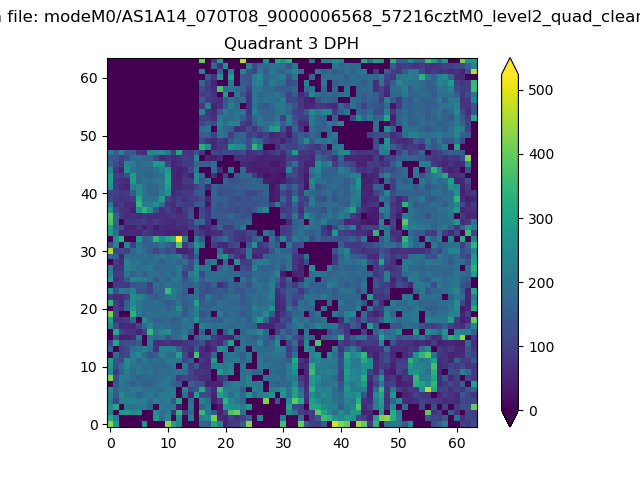 |
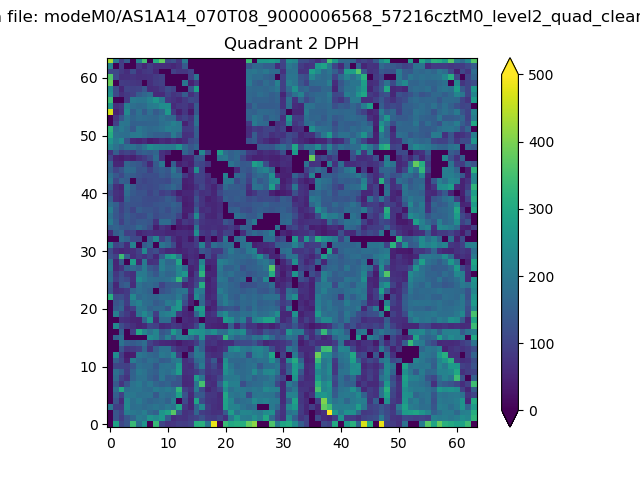 |
Quadrant C |
| Plot type | Count rate plots | Images |
|---|---|---|
| Comparison with Poisson distribution Blue bars denote a histogram of data divided into 1 sec bins. Red curve is a Poisson curve with rate = median count rate of data. |
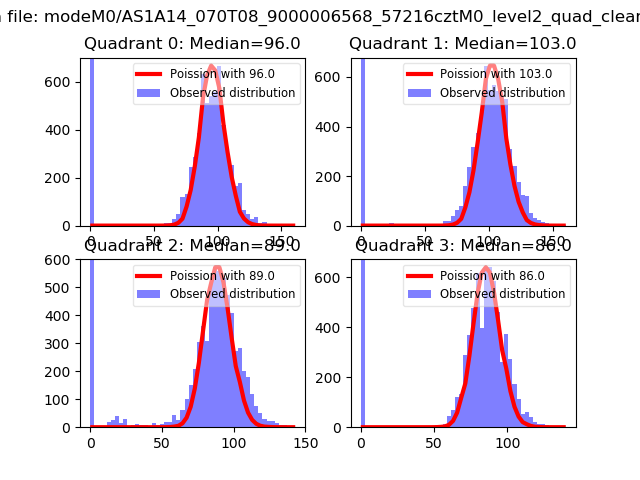 |
 |
| Quadrant-wise count rates Data is divided into 100 sec bins |
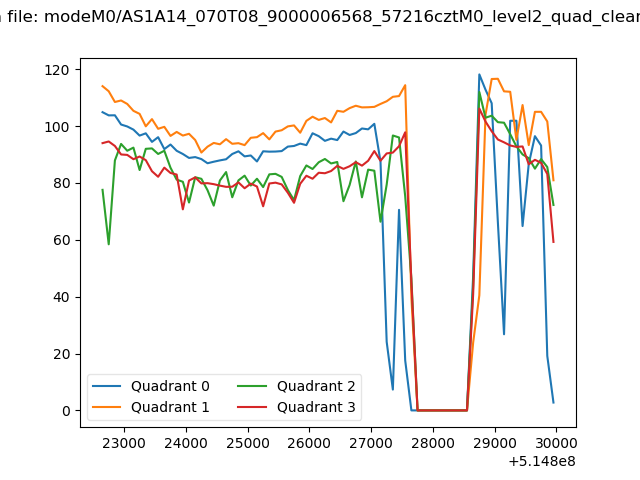 |
|
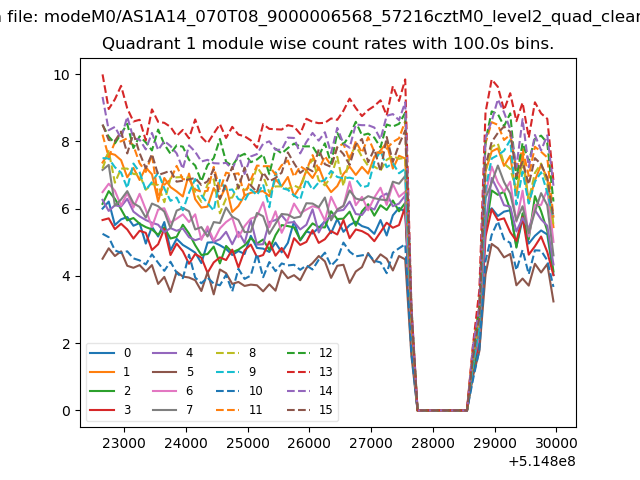
| Module-wise count rates for Quadrant A Data is divided into 100 sec bins |
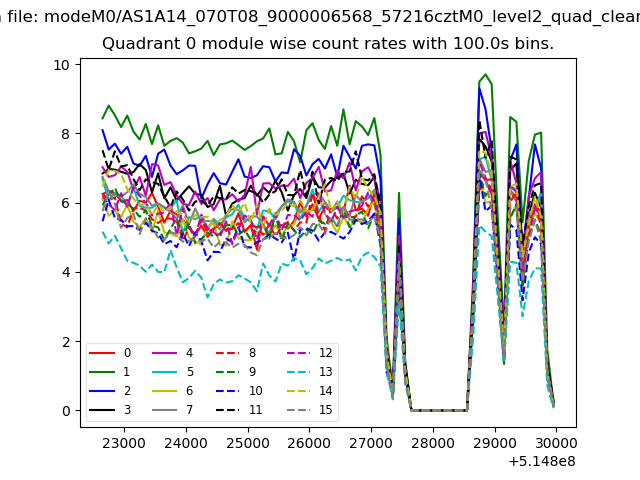 |
 |
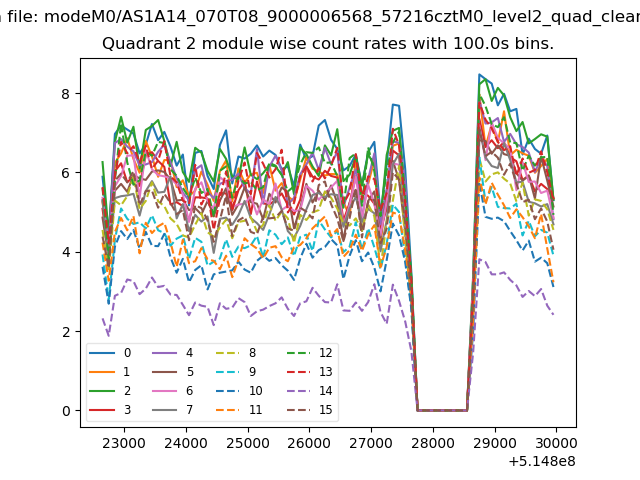
| Module-wise count rates for Quadrant B Data is divided into 100 sec bins |
 |
 |
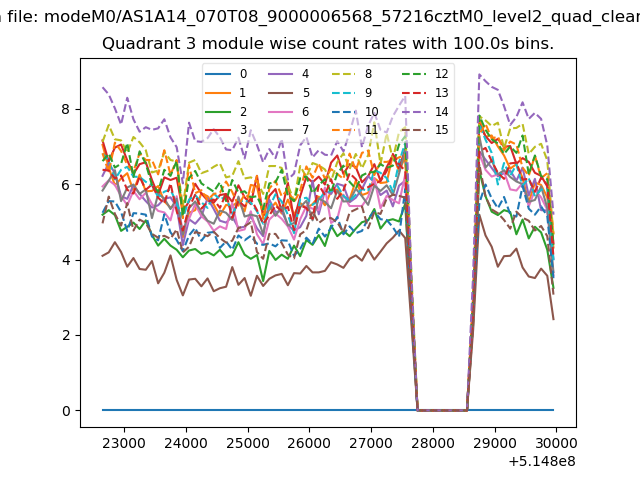
| Module-wise count rates for Quadrant C Data is divided into 100 sec bins |
 |
 |
| Module-wise count rates for Quadrant D Data is divided into 100 sec bins |
 |
 |
| Parameter | Plot |
|---|---|
| CZT HV Monitor | 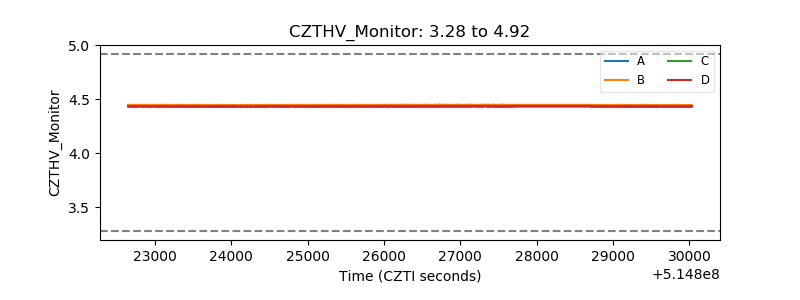 |
| D_VDD | 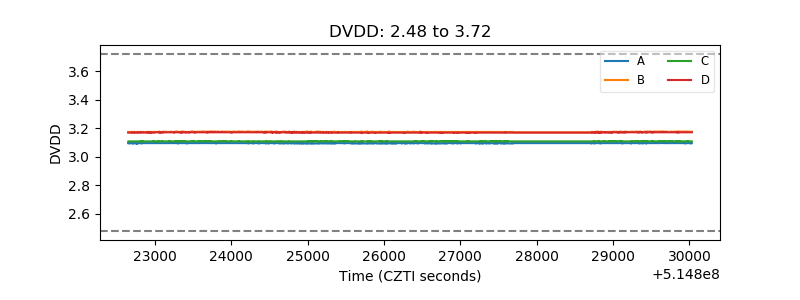 |
| Temperature 1 | 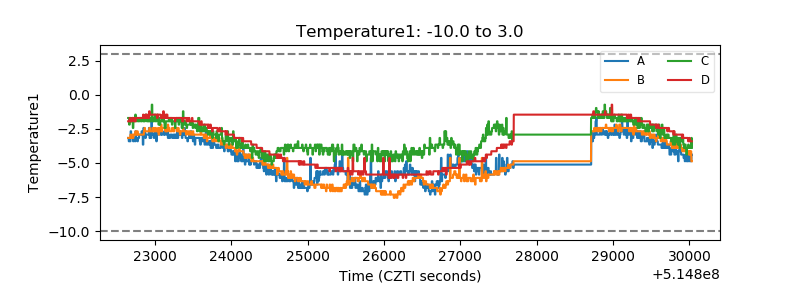 |
| Veto HV Monitor | 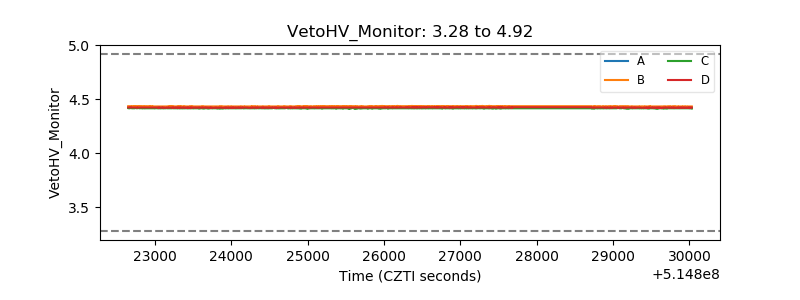 |
| Veto LLD | 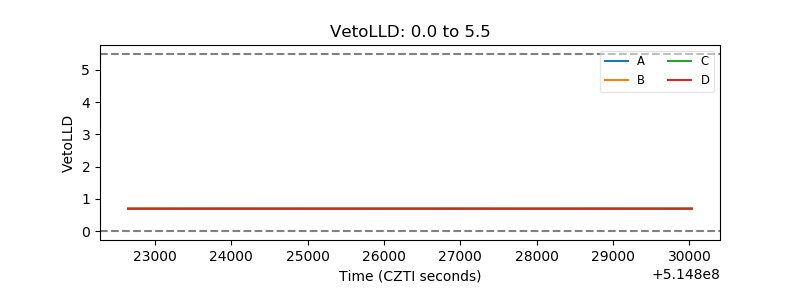 |
| Alpha Counter | 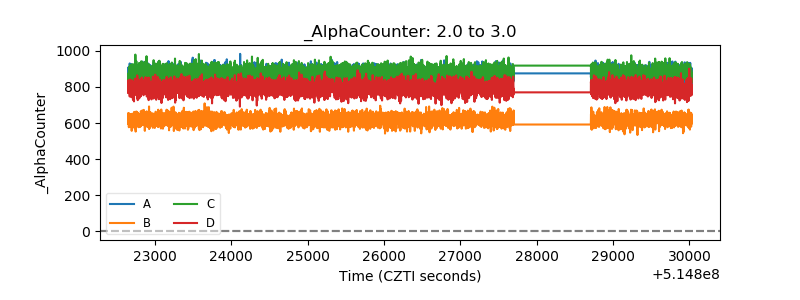 |
| _CPM_Rate | 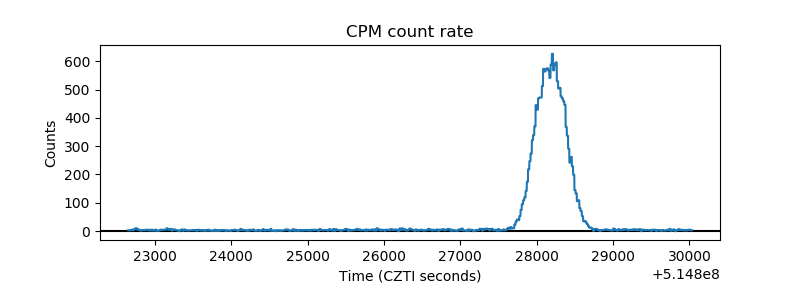 |
| CZT Counter | 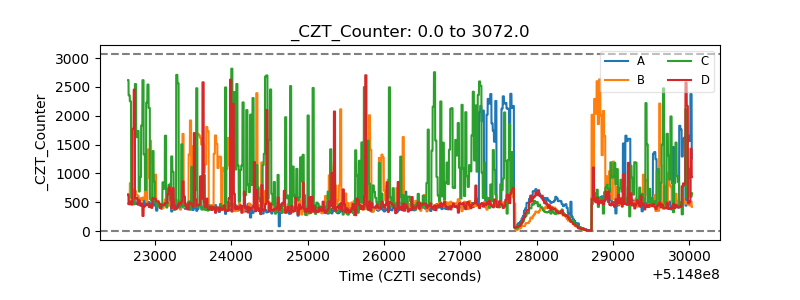 |
| +2.5 Volts monitor |  |
| +5 Volts monitor |  |
| _ROLL_ROT | 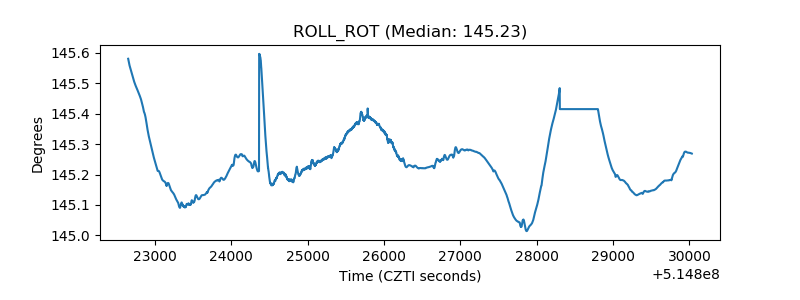 |
| _Roll_DEC | 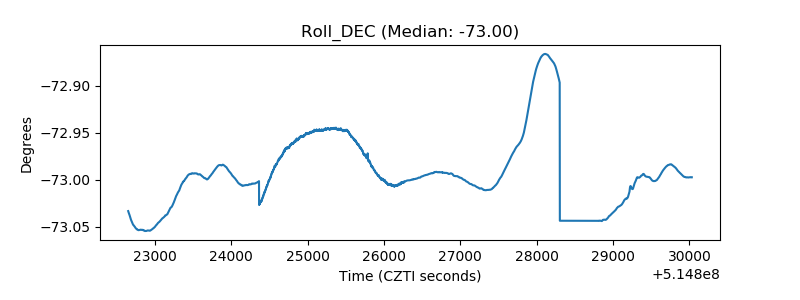 |
| _Roll_RA | 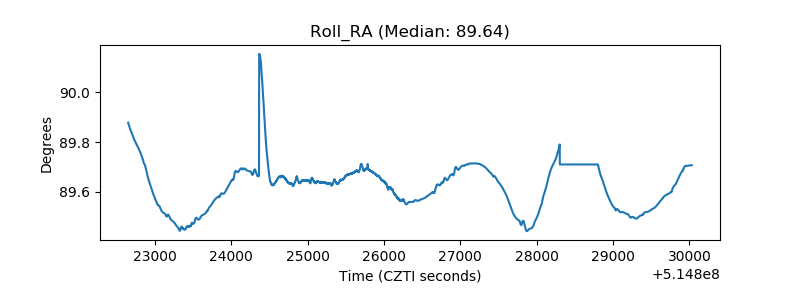 |
| Veto Counter | 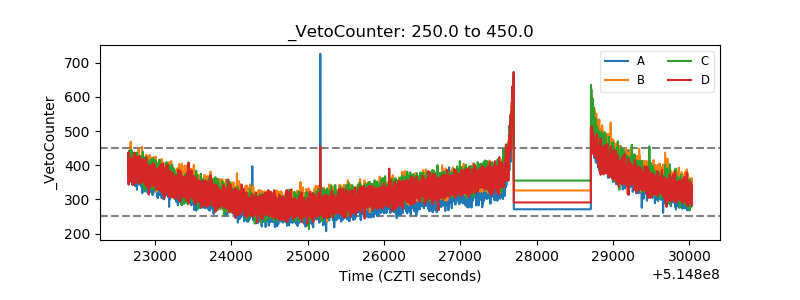 |