| Param | Original file | Final file |
|---|---|---|
| Filename | modeM0/AS1A14_070T08_9000006568_57219cztM0_level2.fits | modeM0/AS1A14_070T08_9000006568_57219cztM0_level2_quad_clean.evt |
| Size (bytes) | 477,282,240 | 85,340,160 |
| Size | 455.2 MB | 81.4 MB |
| Events in quadrant A | 3,033,514 | 570,309 |
| Events in quadrant B | 3,745,333 | 603,173 |
| Events in quadrant C | 6,716,820 | 469,032 |
| Events in quadrant D | 3,675,829 | 496,151 |
| Mode M9 | |||
|---|---|---|---|
| Quadrant | BADHDUFLAG | Total packets | Discarded packets |
| A | 0 | 20 | 0 |
| B | 0 | 21 | 0 |
| C | 0 | 21 | 0 |
| D | 0 | 21 | 0 |
| Mode SS | |||
|---|---|---|---|
| Quadrant | BADHDUFLAG | Total packets | Discarded packets |
| A | 0 | 130 | 0 |
| B | 0 | 130 | 0 |
| C | 0 | 130 | 0 |
| D | 0 | 130 | 0 |
| Mode M0 | |||
|---|---|---|---|
| Quadrant | BADHDUFLAG | Total packets | Discarded packets |
| A | 0 | 13799 | 3 |
| B | 0 | 15560 | 2 |
| C | 0 | 24481 | 2 |
| D | 0 | 15635 | 2 |
| Quadrant | Total seconds | Saturated seconds | Saturation percentage |
|---|---|---|---|
| A | 6379 | 129 | 2.022261% |
| B | 6379 | 253 | 3.966139% |
| C | 6379 | 1127 | 17.667346% |
| D | 6379 | 111 | 1.740085% |
Noise dominated data is calculated using 1-second bins in cleaned event files. If a bin has >2000 counts, and if more than 50% of those come from <1% of pixels, then it is considered to be noise-dominated and hence unusable.
| Quadrant | # 1 sec bins | Bins with >0 counts | Bins with >2000 counts | High rate bins dominated by noise | Noise dominated (total time) | Noise dominated (detector-on time) | Marked lightcurve |
|---|---|---|---|---|---|---|---|
| A | 7838 | 6654 | 74 | 74 | 0.94% | 1.11% | 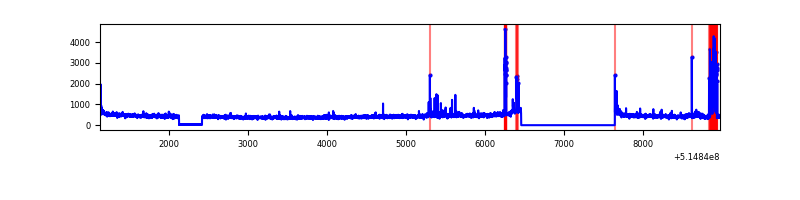 |
| B | 7838 | 6653 | 110 | 110 | 1.40% | 1.65% | 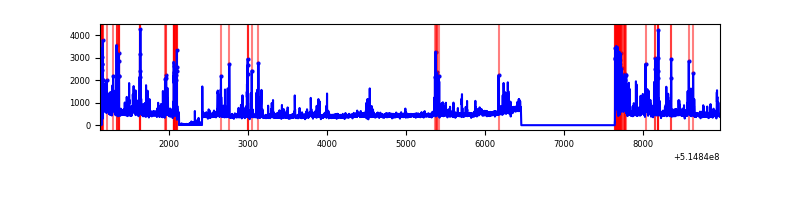 |
| C | 7838 | 6649 | 848 | 848 | 10.82% | 12.75% | 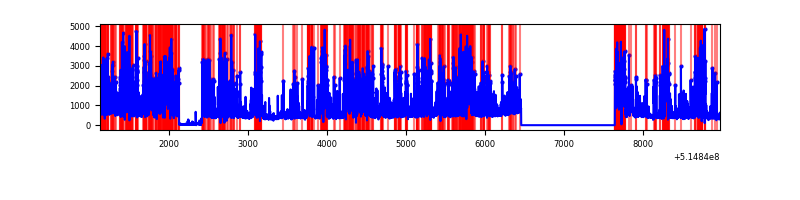 |
| D | 7838 | 6654 | 106 | 106 | 1.35% | 1.59% | 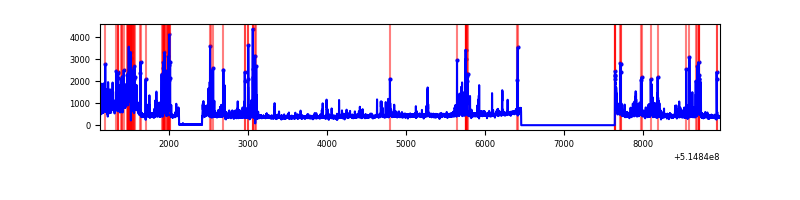 |
Top three noisy pixels from each quadrant. If the there are fewer than three noisy pixels in the level2.evt file, extra rows are filled as -1
| Pixel properties | Quadrant properties | ||||||
|---|---|---|---|---|---|---|---|
| Quadrant | DetID | PixID | Counts | Sigma | Mean | Median | Sigma |
| A | 0 | 128 | 264713 | 1556.6 | 689 | 671 | 169.6 |
| A | 3 | 95 | 69511 | 405.83 | 689 | 671 | 169.6 |
| A | 13 | 254 | 11380 | 63.13 | 689 | 671 | 169.6 |
| B | 10 | 16 | 371172 | 2538.7 | 681 | 656 | 145.9 |
| B | 5 | 185 | 166124 | 1133.75 | 681 | 656 | 145.9 |
| B | 10 | 247 | 143470 | 978.53 | 681 | 656 | 145.9 |
| C | 15 | 224 | 3400827 | 20028.76 | 618 | 610 | 169.8 |
| C | 12 | 254 | 633892 | 3730.31 | 618 | 610 | 169.8 |
| C | 15 | 216 | 145150 | 851.4 | 618 | 610 | 169.8 |
| D | 8 | 240 | 640504 | 3389.94 | 659 | 628 | 188.8 |
| D | 2 | 120 | 120726 | 636.25 | 659 | 628 | 188.8 |
| D | 7 | 96 | 108762 | 572.87 | 659 | 628 | 188.8 |
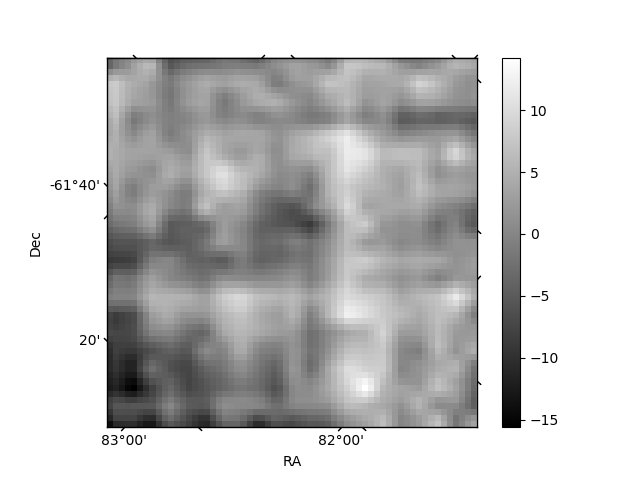
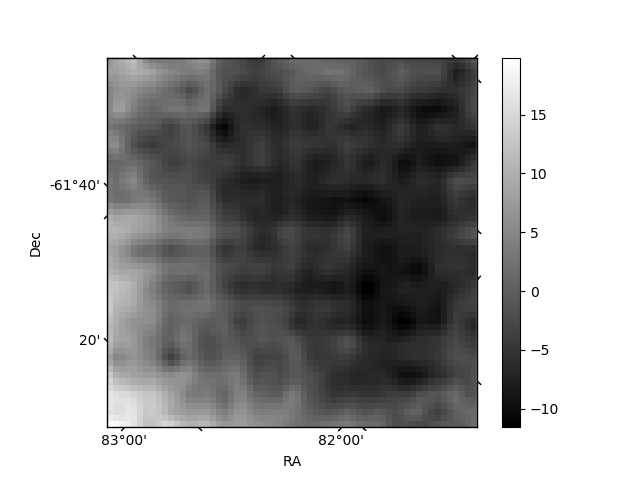
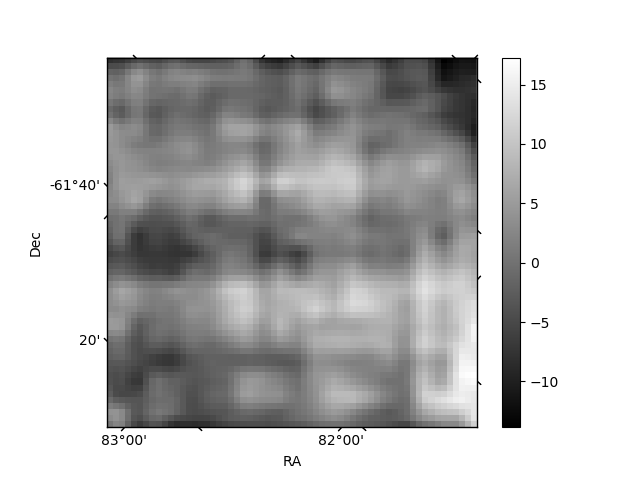
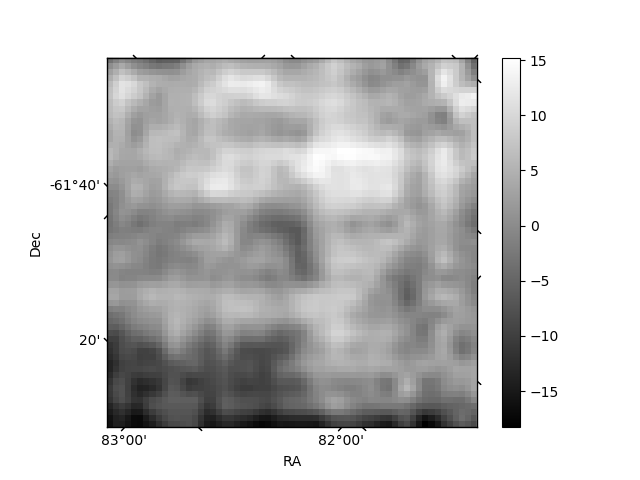
Histogram calculated using DETX and DETY for each event in the final _common_clean file
| Quadrant A | 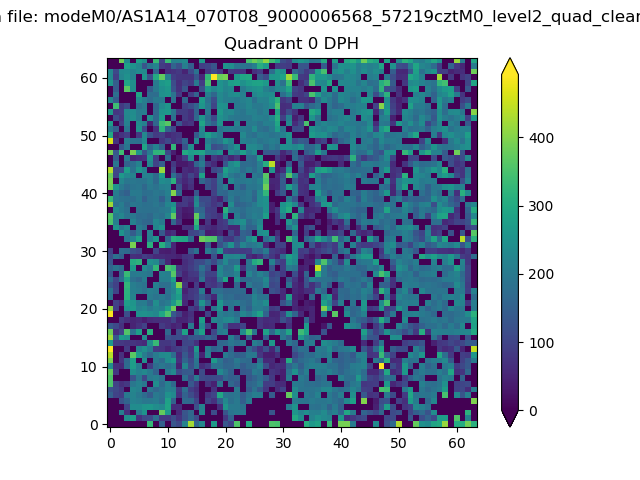 |
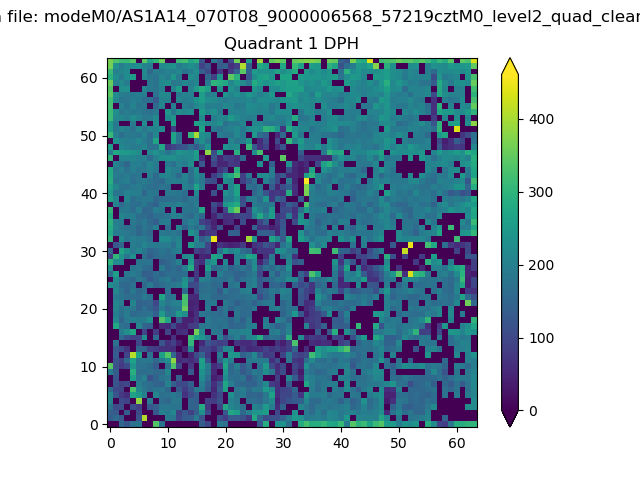 |
Quadrant B |
|---|---|---|---|
| Quadrant D | 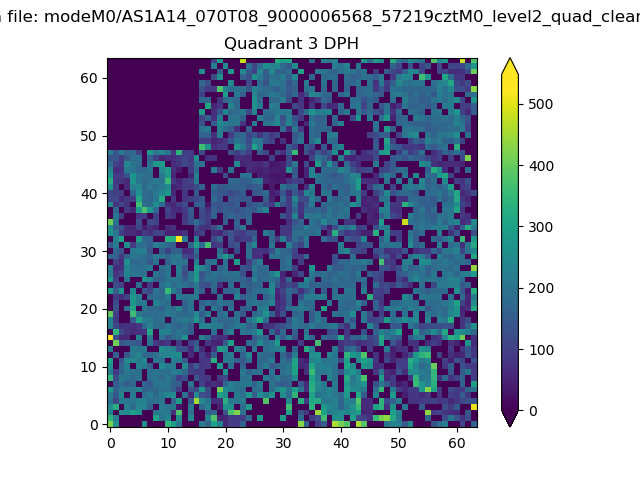 |
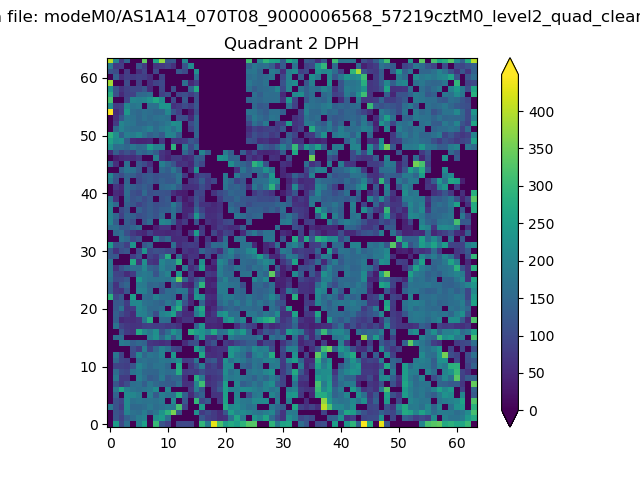 |
Quadrant C |
| Plot type | Count rate plots | Images |
|---|---|---|
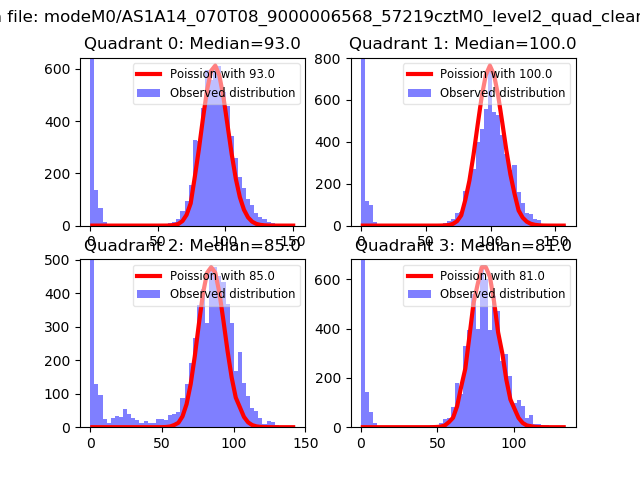
| Comparison with Poisson distribution Blue bars denote a histogram of data divided into 1 sec bins. Red curve is a Poisson curve with rate = median count rate of data. |
 |
 |
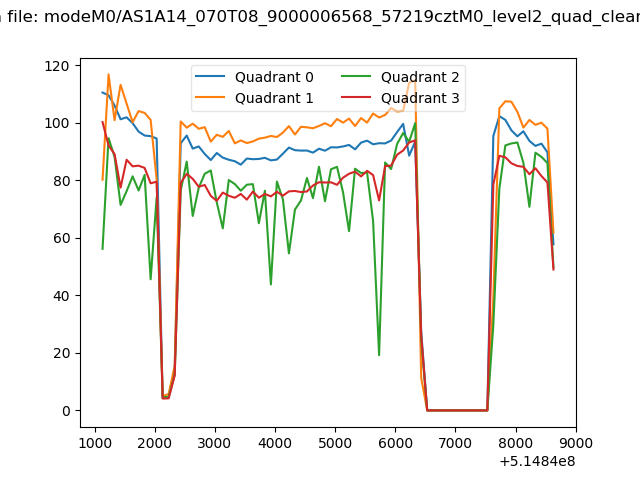
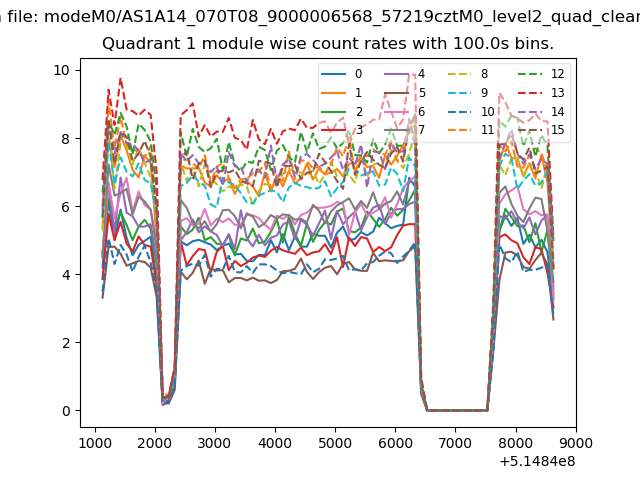
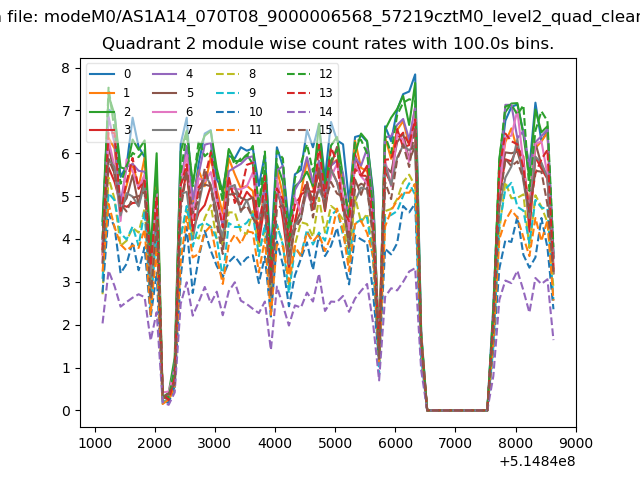
| Quadrant-wise count rates Data is divided into 100 sec bins |
 |
|
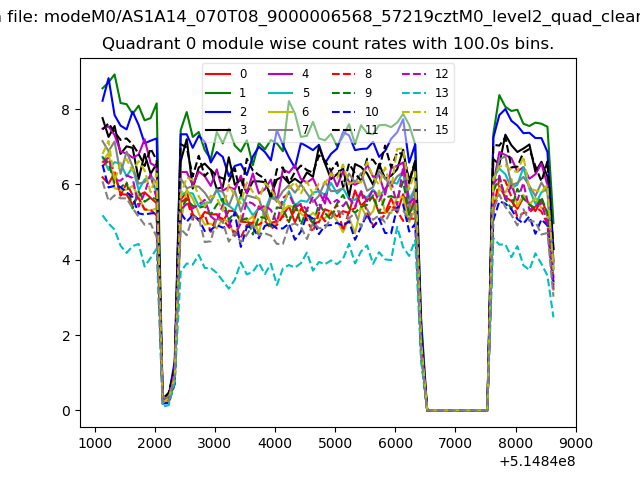
| Module-wise count rates for Quadrant A Data is divided into 100 sec bins |
 |
 |
| Module-wise count rates for Quadrant B Data is divided into 100 sec bins |
 |
 |
| Module-wise count rates for Quadrant C Data is divided into 100 sec bins |
 |
 |
| Module-wise count rates for Quadrant D Data is divided into 100 sec bins |
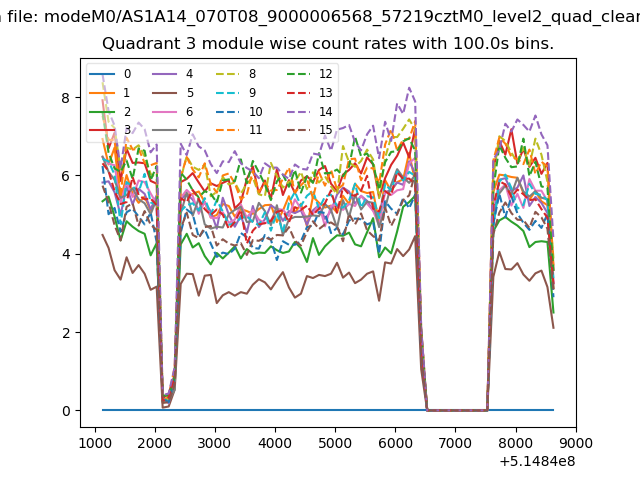 |
 |
| Parameter | Plot |
|---|---|
| CZT HV Monitor | 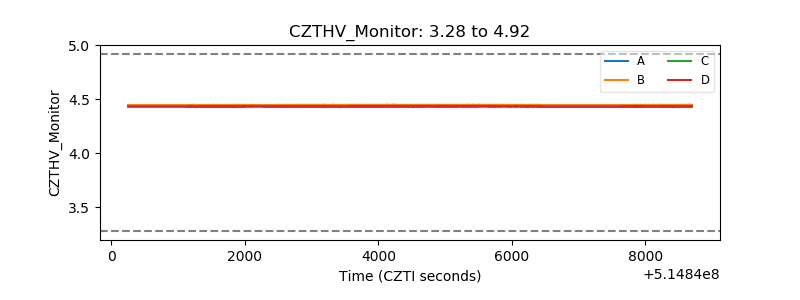 |
| D_VDD | 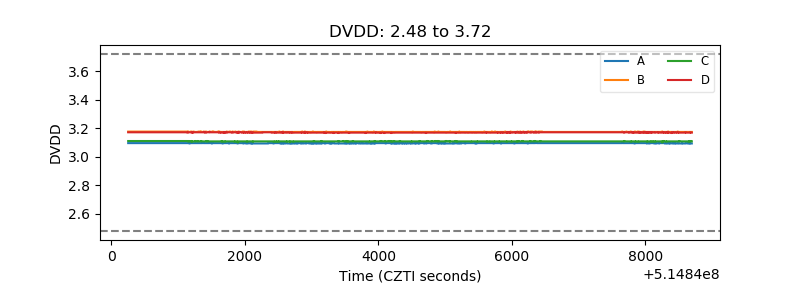 |
| Temperature 1 | 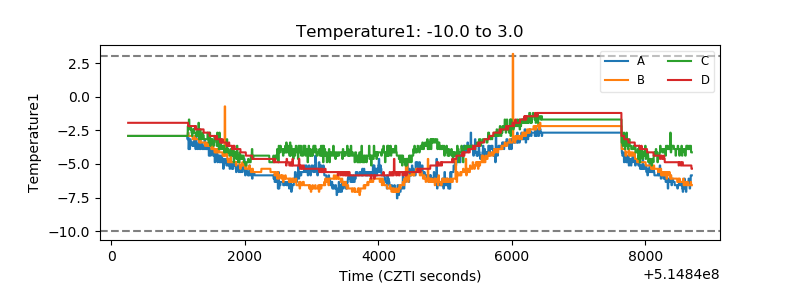 |
| Veto HV Monitor | 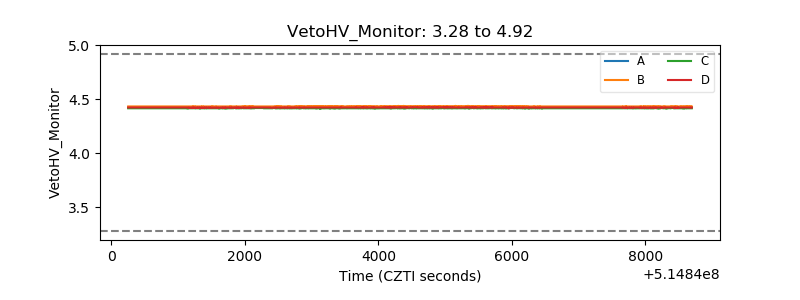 |
| Veto LLD | 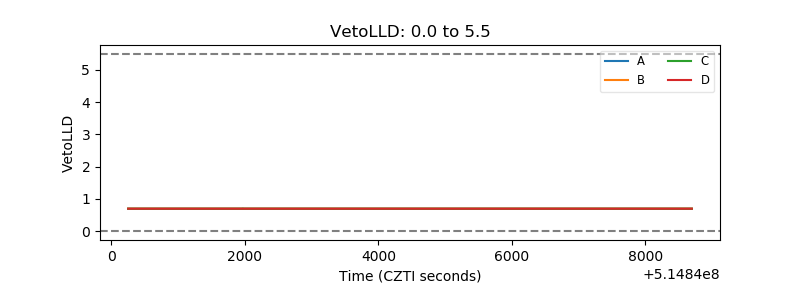 |
| Alpha Counter | 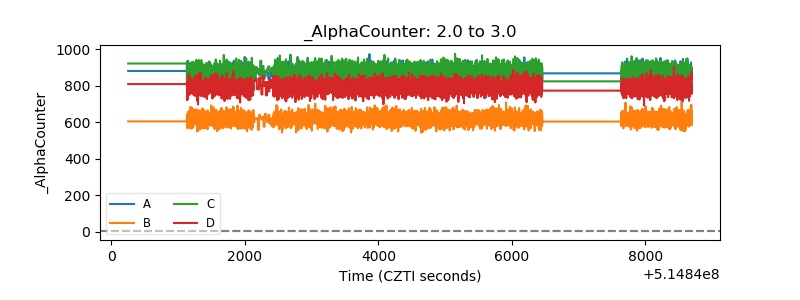 |
| _CPM_Rate | 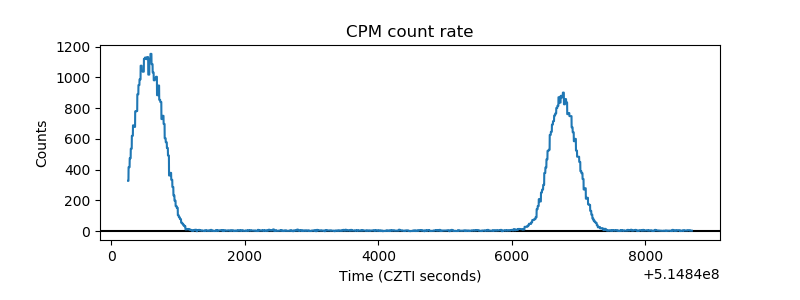 |
| CZT Counter | 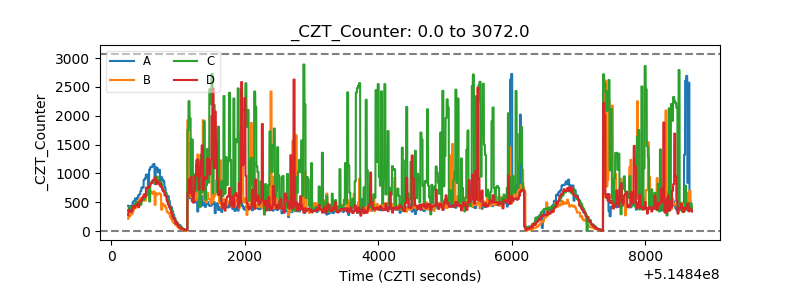 |
| +2.5 Volts monitor |  |
| +5 Volts monitor |  |
| _ROLL_ROT | 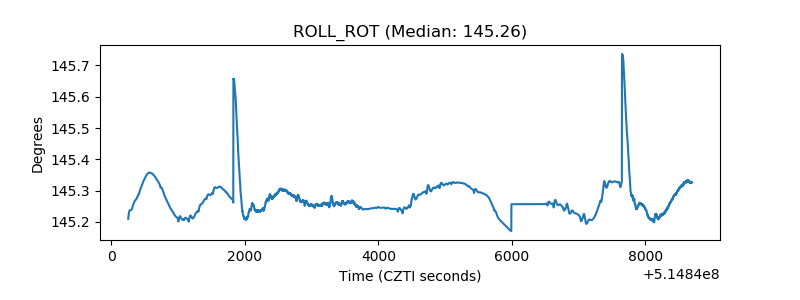 |
| _Roll_DEC | 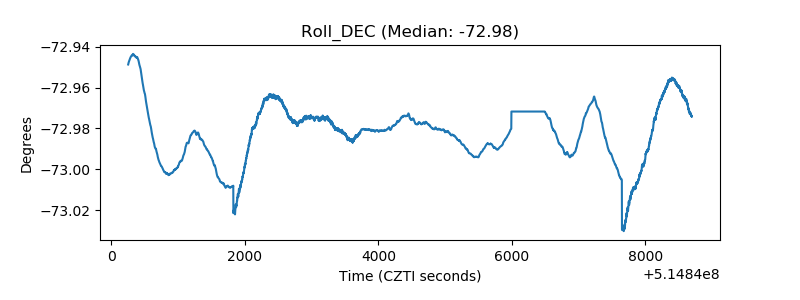 |
| _Roll_RA | 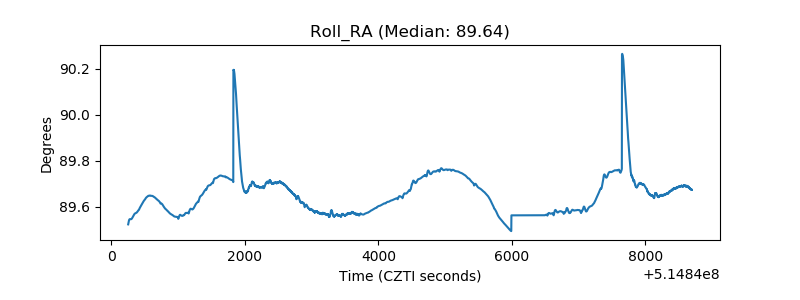 |
| Veto Counter | 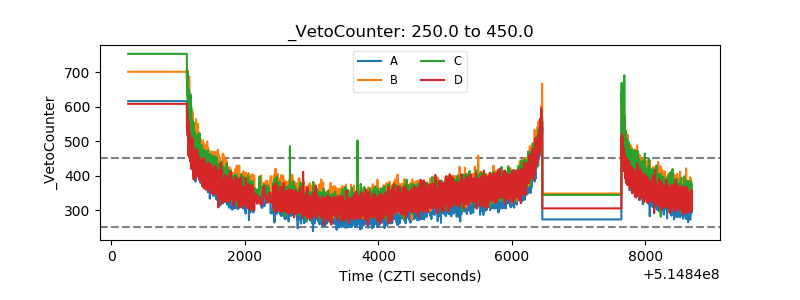 |