| Param | Original file | Final file |
|---|---|---|
| Filename | modeM0/AS1A14_070T08_9000006568_57220cztM0_level2.fits | modeM0/AS1A14_070T08_9000006568_57220cztM0_level2_quad_clean.evt |
| Size (bytes) | 469,267,200 | 92,865,600 |
| Size | 447.5 MB | 88.6 MB |
| Events in quadrant A | 3,083,561 | 633,767 |
| Events in quadrant B | 3,482,716 | 679,315 |
| Events in quadrant C | 6,894,755 | 494,323 |
| Events in quadrant D | 3,408,161 | 555,040 |
| Mode M9 | |||
|---|---|---|---|
| Quadrant | BADHDUFLAG | Total packets | Discarded packets |
| A | 0 | 20 | 0 |
| B | 0 | 21 | 0 |
| C | 0 | 21 | 0 |
| D | 0 | 21 | 0 |
| Mode SS | |||
|---|---|---|---|
| Quadrant | BADHDUFLAG | Total packets | Discarded packets |
| A | 0 | 130 | 0 |
| B | 0 | 130 | 0 |
| C | 0 | 130 | 0 |
| D | 0 | 130 | 0 |
| Mode M0 | |||
|---|---|---|---|
| Quadrant | BADHDUFLAG | Total packets | Discarded packets |
| A | 0 | 13893 | 2 |
| B | 0 | 15000 | 2 |
| C | 0 | 24984 | 8 |
| D | 0 | 15027 | 2 |
| Quadrant | Total seconds | Saturated seconds | Saturation percentage |
|---|---|---|---|
| A | 6447 | 106 | 1.644176% |
| B | 6447 | 162 | 2.512797% |
| C | 6446 | 1311 | 20.338194% |
| D | 6446 | 153 | 2.373565% |
Noise dominated data is calculated using 1-second bins in cleaned event files. If a bin has >2000 counts, and if more than 50% of those come from <1% of pixels, then it is considered to be noise-dominated and hence unusable.
| Quadrant | # 1 sec bins | Bins with >0 counts | Bins with >2000 counts | High rate bins dominated by noise | Noise dominated (total time) | Noise dominated (detector-on time) | Marked lightcurve |
|---|---|---|---|---|---|---|---|
| A | 7602 | 6448 | 80 | 80 | 1.05% | 1.24% | 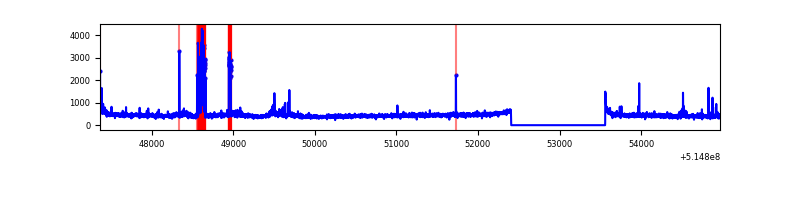 |
| B | 7602 | 6448 | 79 | 79 | 1.04% | 1.23% | 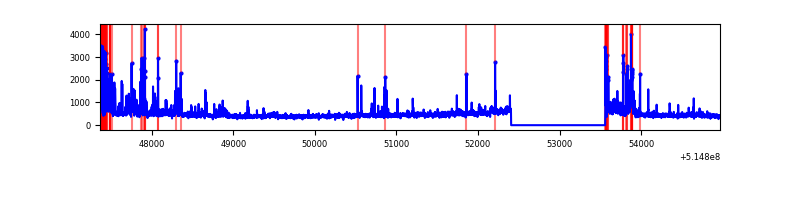 |
| C | 7601 | 6446 | 994 | 994 | 13.08% | 15.42% | 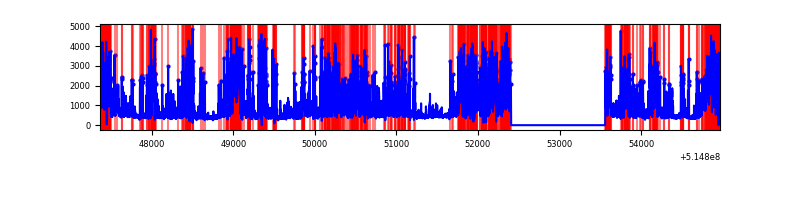 |
| D | 7601 | 6447 | 127 | 127 | 1.67% | 1.97% | 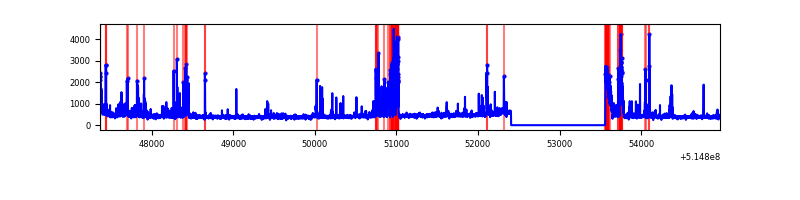 |
Top three noisy pixels from each quadrant. If the there are fewer than three noisy pixels in the level2.evt file, extra rows are filled as -1
| Pixel properties | Quadrant properties | ||||||
|---|---|---|---|---|---|---|---|
| Quadrant | DetID | PixID | Counts | Sigma | Mean | Median | Sigma |
| A | 0 | 128 | 299577 | 1771.57 | 686 | 670 | 168.7 |
| A | 3 | 95 | 81375 | 478.32 | 686 | 670 | 168.7 |
| A | 10 | 251 | 22681 | 130.46 | 686 | 670 | 168.7 |
| B | 10 | 16 | 296502 | 2041.51 | 679 | 654 | 144.9 |
| B | 5 | 185 | 167956 | 1154.47 | 679 | 654 | 144.9 |
| B | 4 | 201 | 70137 | 479.47 | 679 | 654 | 144.9 |
| C | 15 | 224 | 4161949 | 25317.21 | 597 | 590 | 164.4 |
| C | 12 | 254 | 178972 | 1085.25 | 597 | 590 | 164.4 |
| C | 14 | 254 | 166771 | 1011.03 | 597 | 590 | 164.4 |
| D | 8 | 240 | 313417 | 1671.76 | 652 | 622 | 187.1 |
| D | 9 | 102 | 179537 | 956.22 | 652 | 622 | 187.1 |
| D | 7 | 96 | 92891 | 493.14 | 652 | 622 | 187.1 |
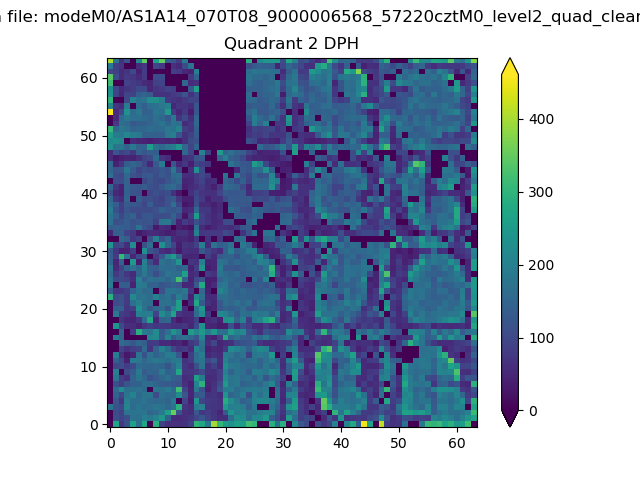
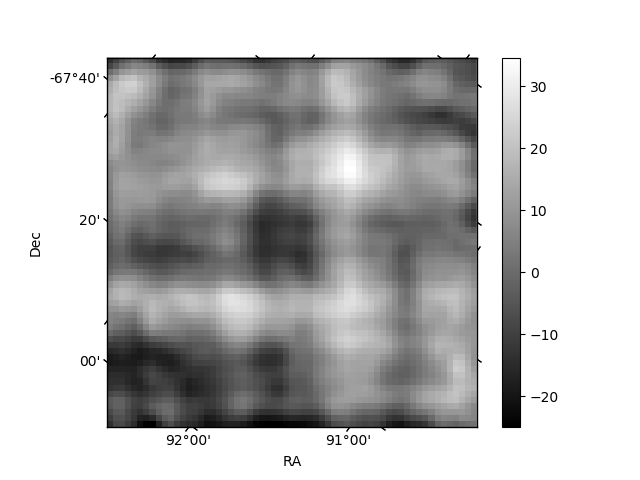
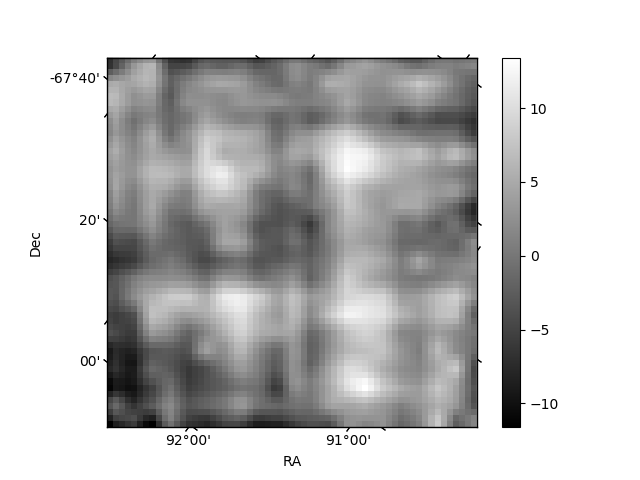
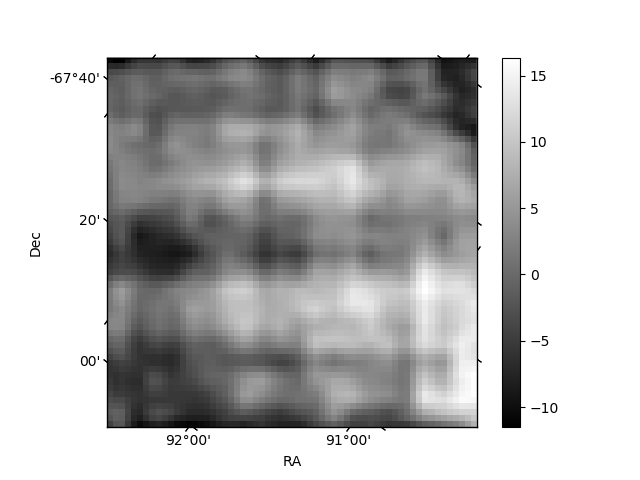
Histogram calculated using DETX and DETY for each event in the final _common_clean file
| Quadrant A | 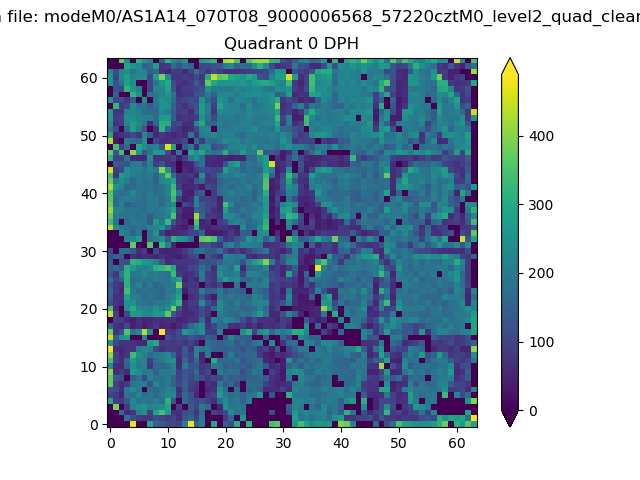 |
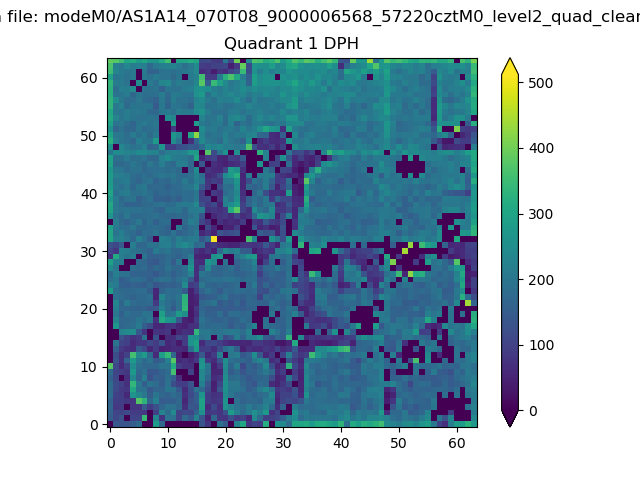 |
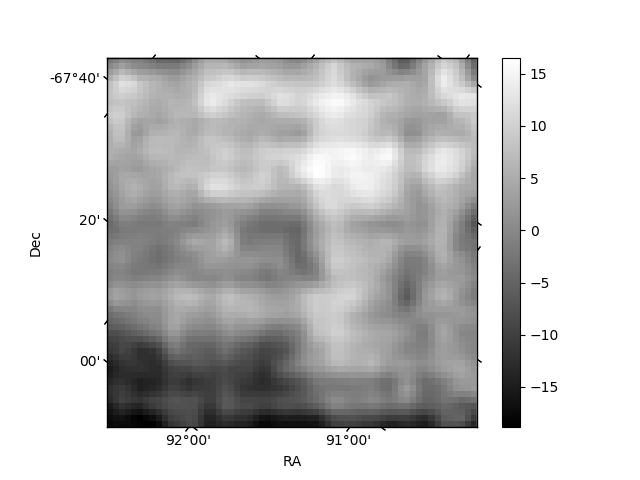
Quadrant B |
|---|---|---|---|
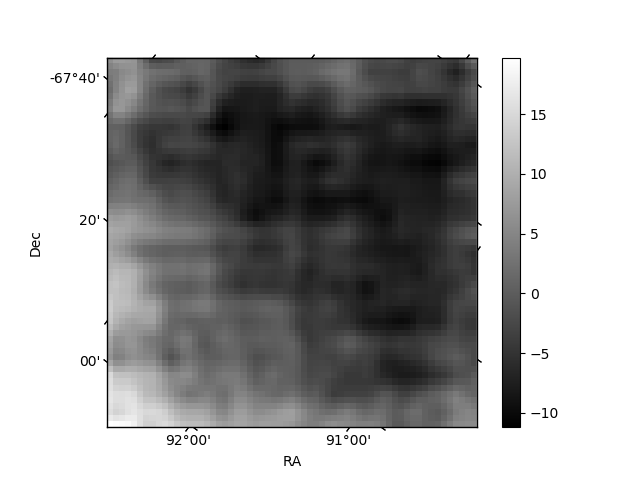
| Quadrant D | 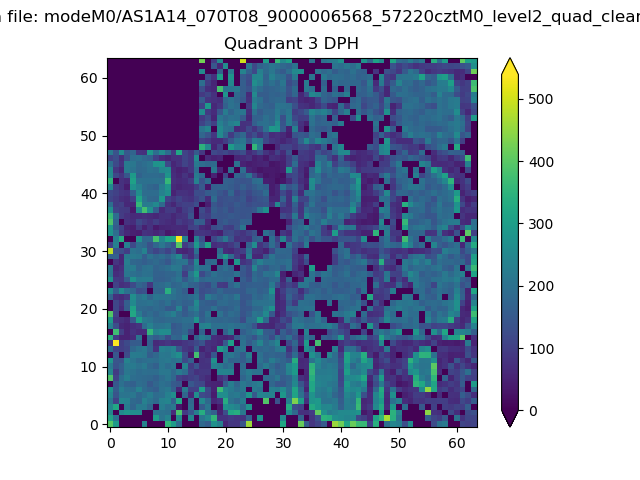 |
 |
Quadrant C |
| Plot type | Count rate plots | Images |
|---|---|---|
| Comparison with Poisson distribution Blue bars denote a histogram of data divided into 1 sec bins. Red curve is a Poisson curve with rate = median count rate of data. |
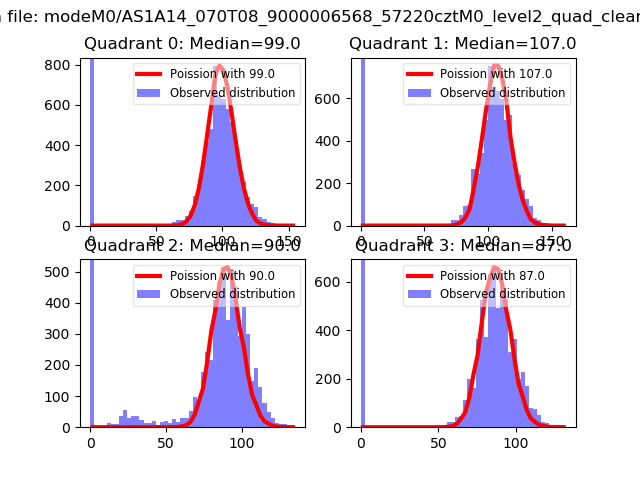 |
 |
| Quadrant-wise count rates Data is divided into 100 sec bins |
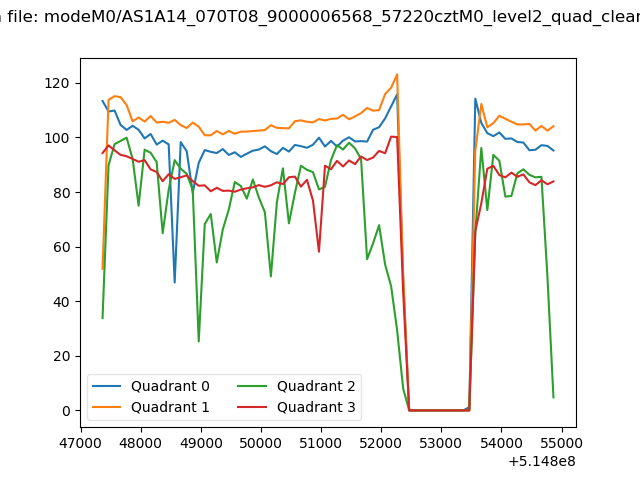 |
|
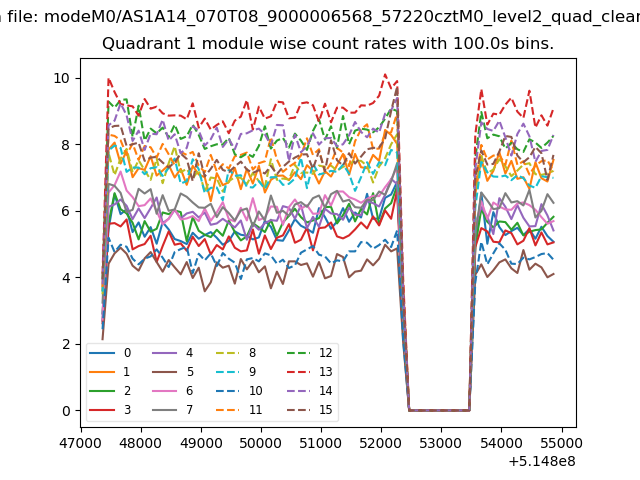
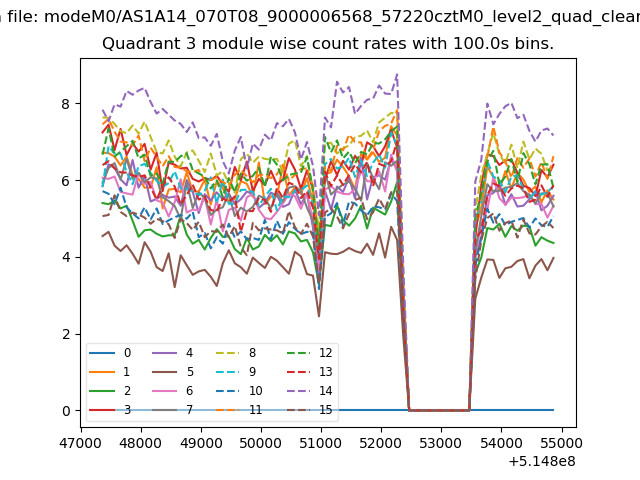
| Module-wise count rates for Quadrant A Data is divided into 100 sec bins |
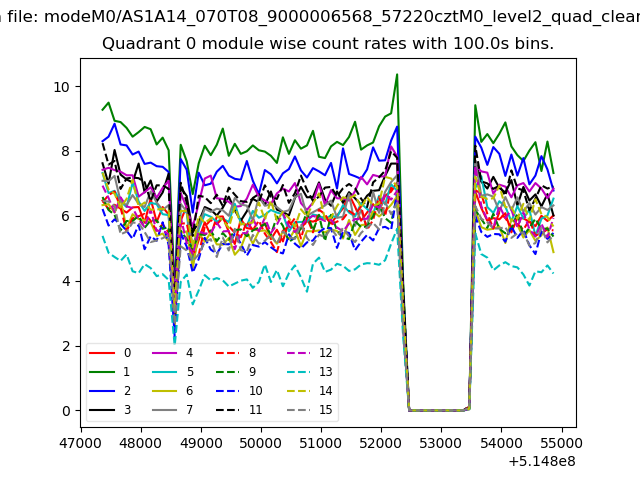 |
 |
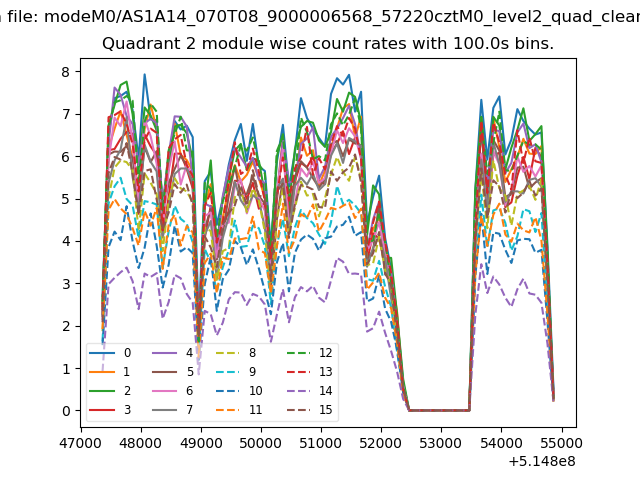
| Module-wise count rates for Quadrant B Data is divided into 100 sec bins |
 |
 |
| Module-wise count rates for Quadrant C Data is divided into 100 sec bins |
 |
 |
| Module-wise count rates for Quadrant D Data is divided into 100 sec bins |
 |
 |
| Parameter | Plot |
|---|---|
| CZT HV Monitor | 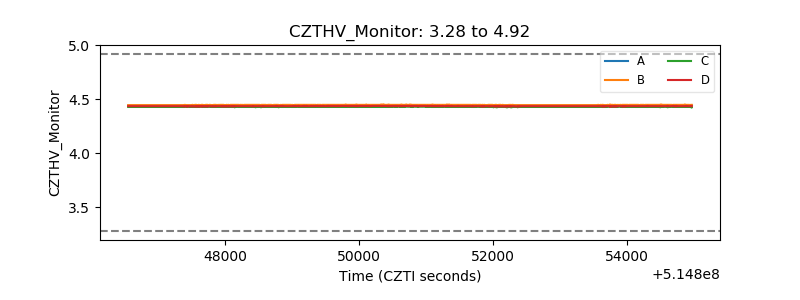 |
| D_VDD | 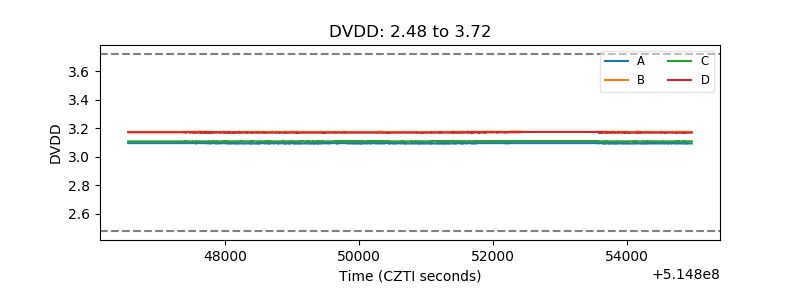 |
| Temperature 1 | 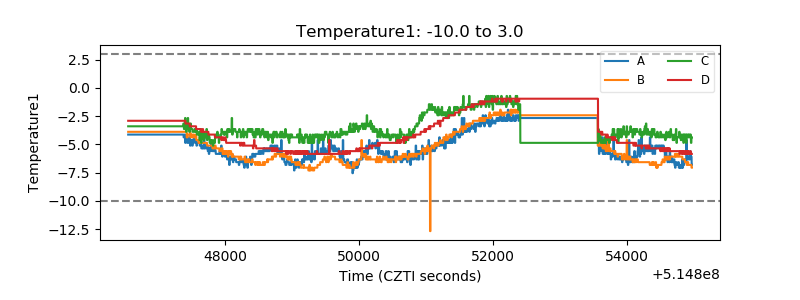 |
| Veto HV Monitor | 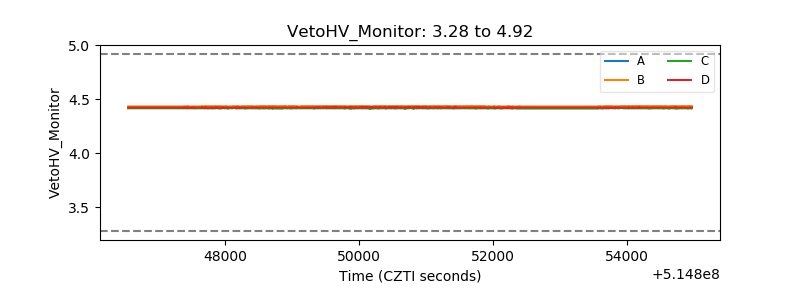 |
| Veto LLD | 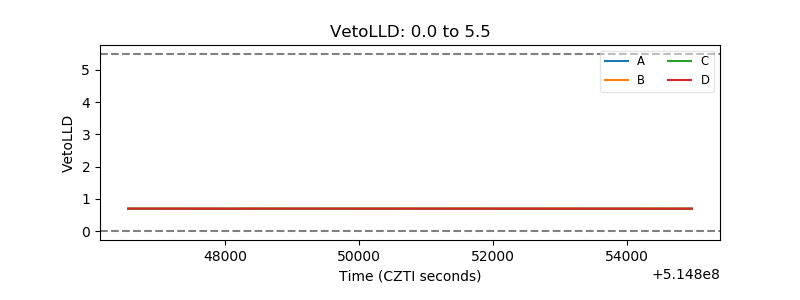 |
| Alpha Counter | 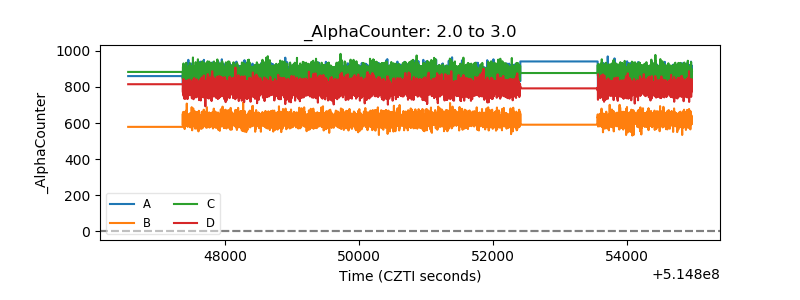 |
| _CPM_Rate | 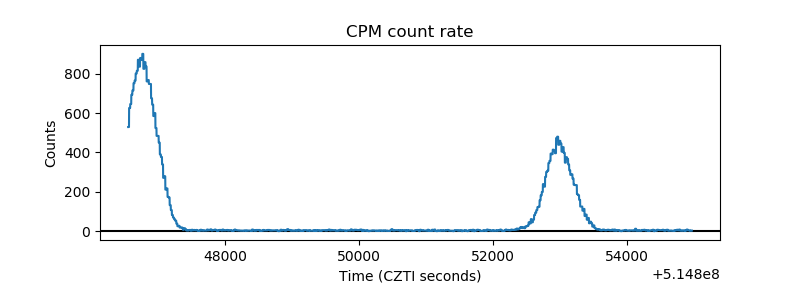 |
| CZT Counter | 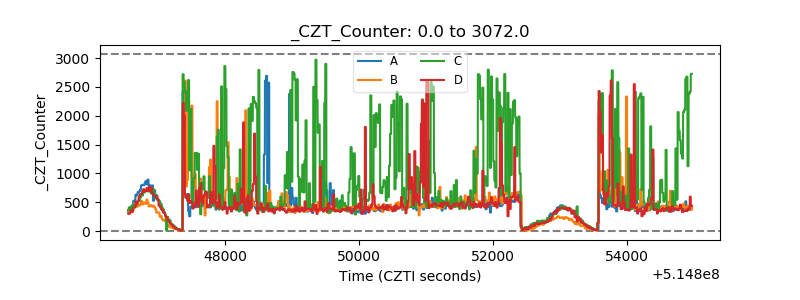 |
| +2.5 Volts monitor | 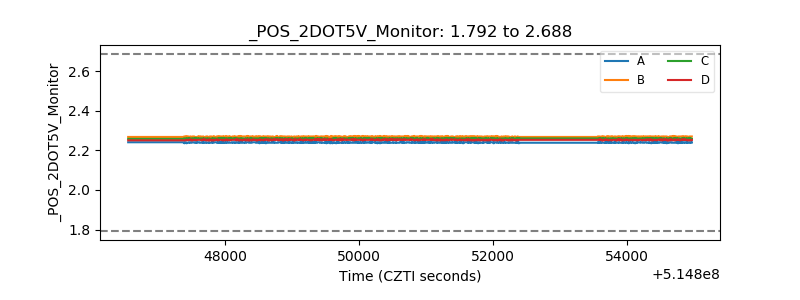 |
| +5 Volts monitor | 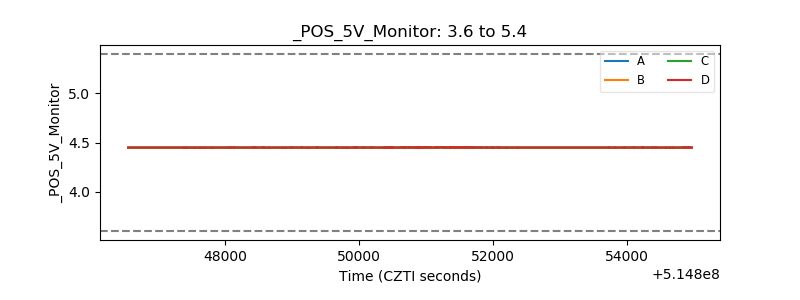 |
| _ROLL_ROT |  |
| _Roll_DEC | 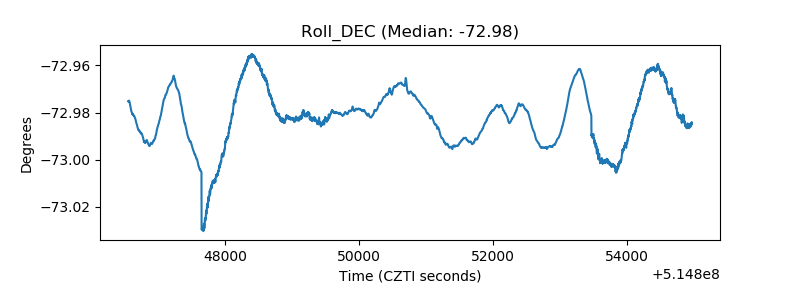 |
| _Roll_RA | 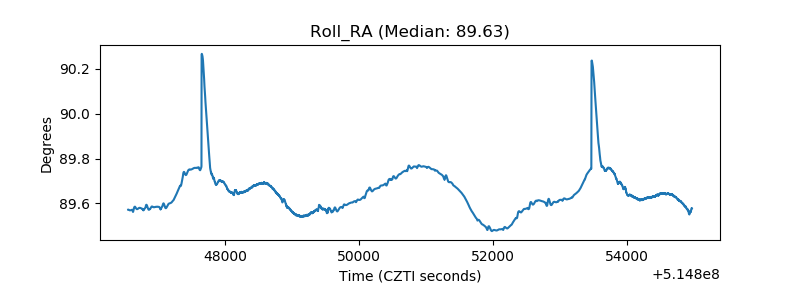 |
| Veto Counter | 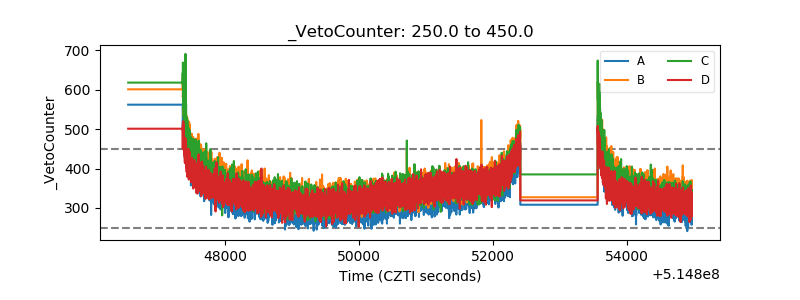 |