| Param | Original file | Final file |
|---|---|---|
| Filename | modeM0/AS1A14_070T08_9000006568_57221cztM0_level2.fits | modeM0/AS1A14_070T08_9000006568_57221cztM0_level2_quad_clean.evt |
| Size (bytes) | 479,900,160 | 87,171,840 |
| Size | 457.7 MB | 83.1 MB |
| Events in quadrant A | 3,194,666 | 580,117 |
| Events in quadrant B | 3,541,064 | 615,842 |
| Events in quadrant C | 7,048,846 | 476,300 |
| Events in quadrant D | 3,458,565 | 499,727 |
| Mode M9 | |||
|---|---|---|---|
| Quadrant | BADHDUFLAG | Total packets | Discarded packets |
| A | 0 | 16 | 0 |
| B | 0 | 17 | 0 |
| C | 0 | 17 | 0 |
| D | 0 | 17 | 0 |
| Mode SS | |||
|---|---|---|---|
| Quadrant | BADHDUFLAG | Total packets | Discarded packets |
| A | 0 | 136 | 0 |
| B | 0 | 136 | 0 |
| C | 0 | 136 | 0 |
| D | 0 | 136 | 0 |
| Mode M0 | |||
|---|---|---|---|
| Quadrant | BADHDUFLAG | Total packets | Discarded packets |
| A | 0 | 14572 | 2 |
| B | 0 | 15353 | 2 |
| C | 0 | 25675 | 2 |
| D | 0 | 15375 | 2 |
| Quadrant | Total seconds | Saturated seconds | Saturation percentage |
|---|---|---|---|
| A | 6703 | 99 | 1.476951% |
| B | 6703 | 216 | 3.222438% |
| C | 6703 | 1162 | 17.335521% |
| D | 6702 | 146 | 2.178454% |
Noise dominated data is calculated using 1-second bins in cleaned event files. If a bin has >2000 counts, and if more than 50% of those come from <1% of pixels, then it is considered to be noise-dominated and hence unusable.
| Quadrant | # 1 sec bins | Bins with >0 counts | Bins with >2000 counts | High rate bins dominated by noise | Noise dominated (total time) | Noise dominated (detector-on time) | Marked lightcurve |
|---|---|---|---|---|---|---|---|
| A | 7894 | 6980 | 54 | 54 | 0.68% | 0.77% | 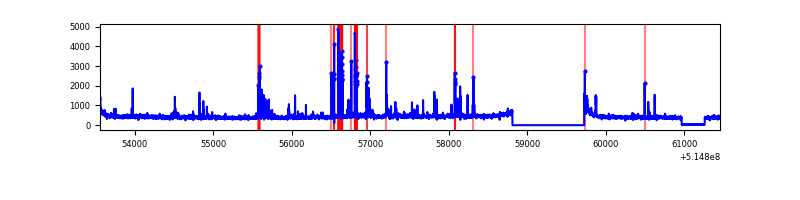 |
| B | 7894 | 6980 | 81 | 81 | 1.03% | 1.16% | 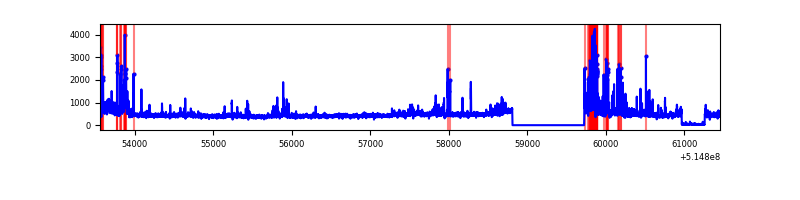 |
| C | 7894 | 6978 | 915 | 915 | 11.59% | 13.11% | 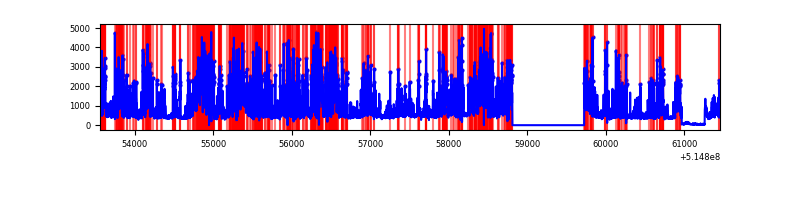 |
| D | 7893 | 6979 | 102 | 102 | 1.29% | 1.46% | 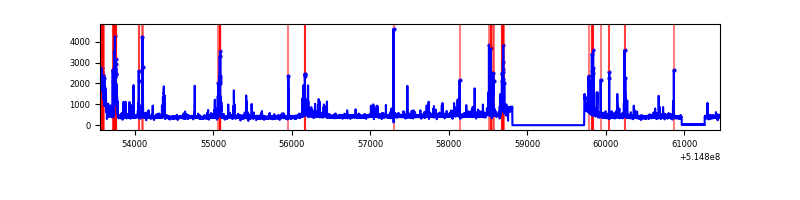 |
Top three noisy pixels from each quadrant. If the there are fewer than three noisy pixels in the level2.evt file, extra rows are filled as -1
| Pixel properties | Quadrant properties | ||||||
|---|---|---|---|---|---|---|---|
| Quadrant | DetID | PixID | Counts | Sigma | Mean | Median | Sigma |
| A | 3 | 95 | 342529 | 1944.35 | 712 | 695 | 175.8 |
| A | 10 | 251 | 50689 | 284.37 | 712 | 695 | 175.8 |
| A | 3 | 14 | 15107 | 81.98 | 712 | 695 | 175.8 |
| B | 10 | 16 | 285624 | 1902.54 | 702 | 677 | 149.8 |
| B | 5 | 185 | 261580 | 1742.0 | 702 | 677 | 149.8 |
| B | 0 | 155 | 38976 | 255.72 | 702 | 677 | 149.8 |
| C | 15 | 224 | 4115614 | 23817.31 | 637 | 630 | 172.8 |
| C | 12 | 254 | 216783 | 1251.08 | 637 | 630 | 172.8 |
| C | 14 | 254 | 94192 | 541.53 | 637 | 630 | 172.8 |
| D | 8 | 240 | 205343 | 1063.99 | 678 | 646 | 192.4 |
| D | 9 | 102 | 180348 | 934.07 | 678 | 646 | 192.4 |
| D | 3 | 176 | 108528 | 560.76 | 678 | 646 | 192.4 |
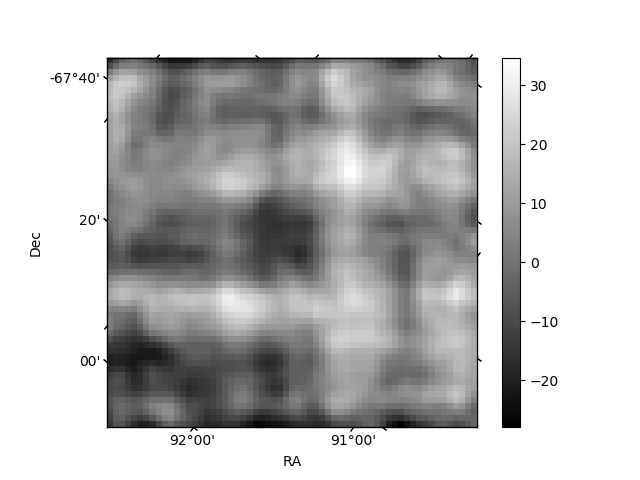
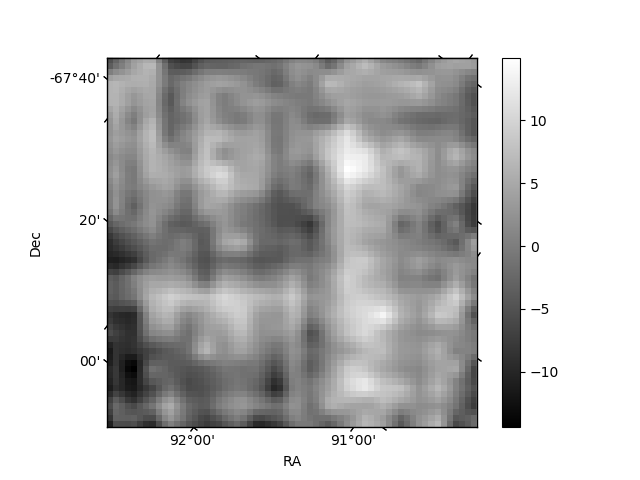
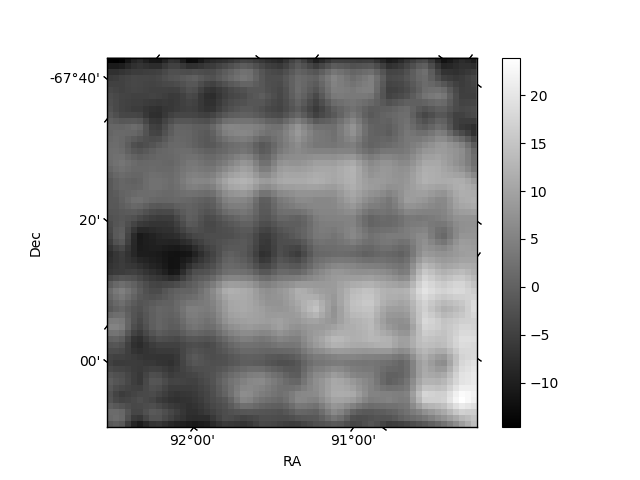
Histogram calculated using DETX and DETY for each event in the final _common_clean file
| Quadrant A | 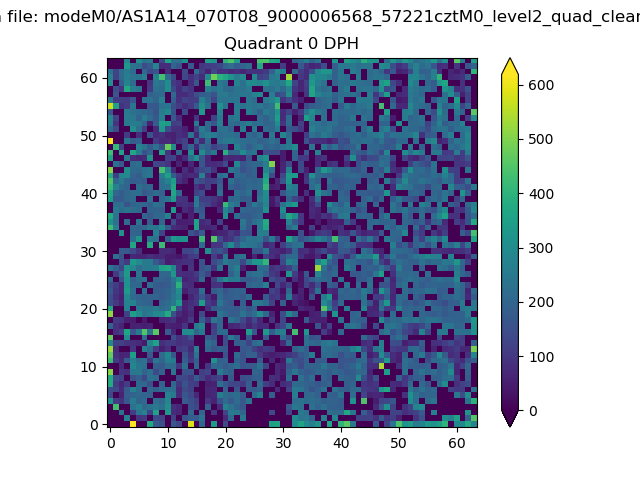 |
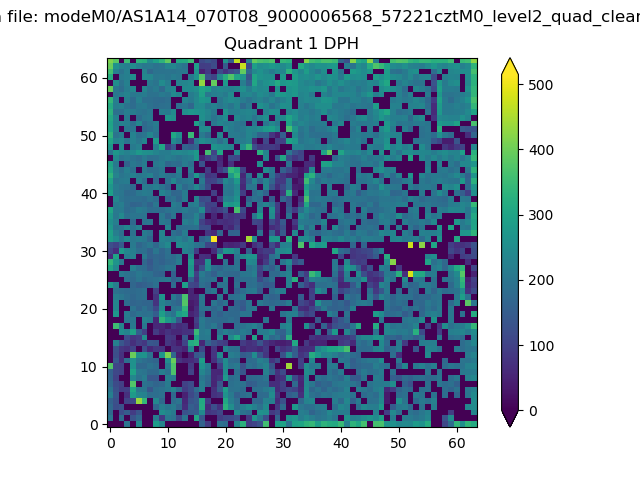 |
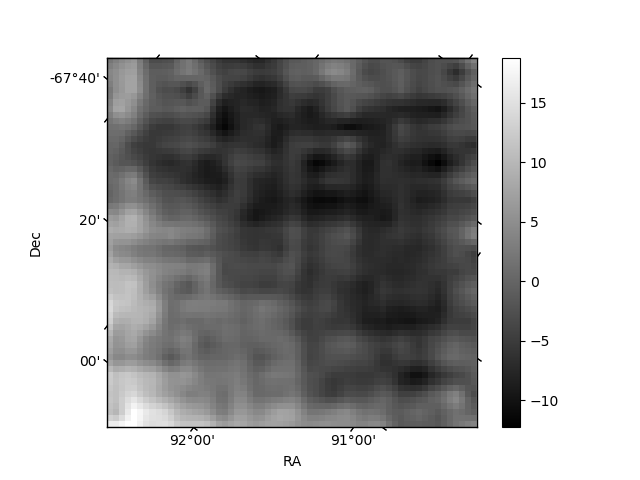
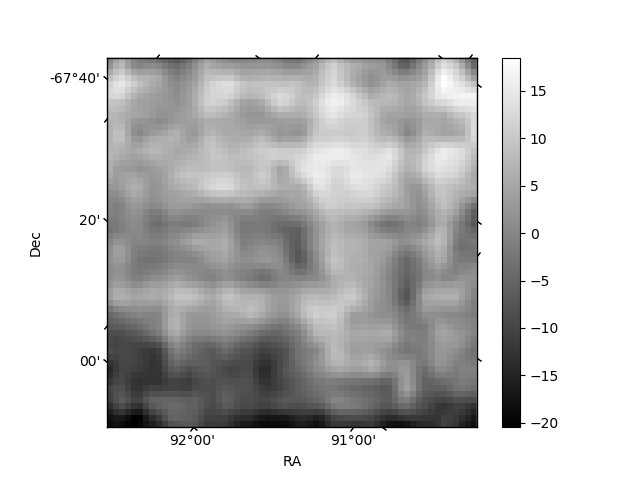
Quadrant B |
|---|---|---|---|
| Quadrant D | 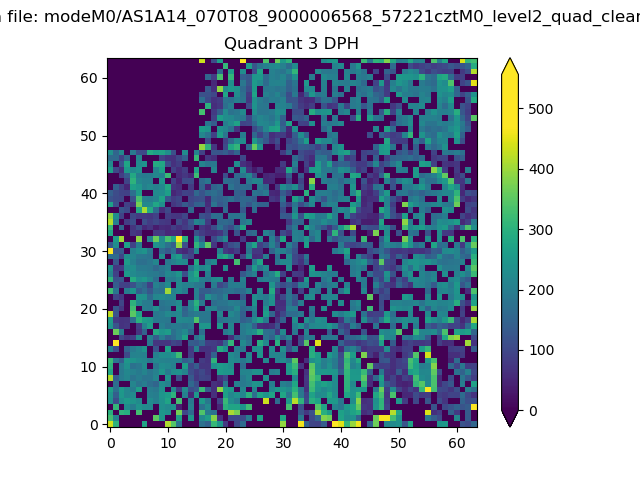 |
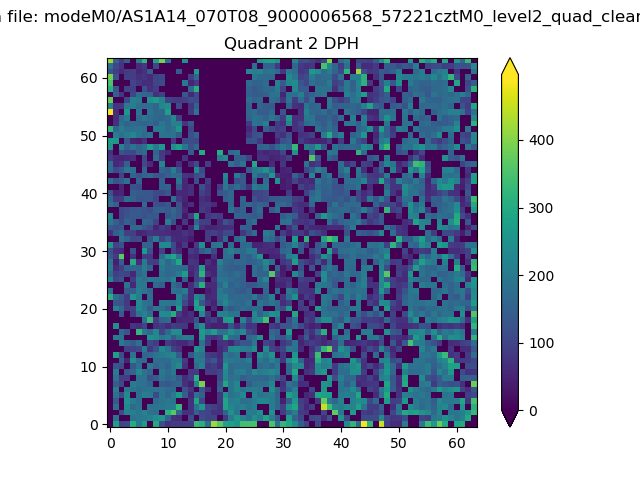 |
Quadrant C |
| Plot type | Count rate plots | Images |
|---|---|---|
| Comparison with Poisson distribution Blue bars denote a histogram of data divided into 1 sec bins. Red curve is a Poisson curve with rate = median count rate of data. |
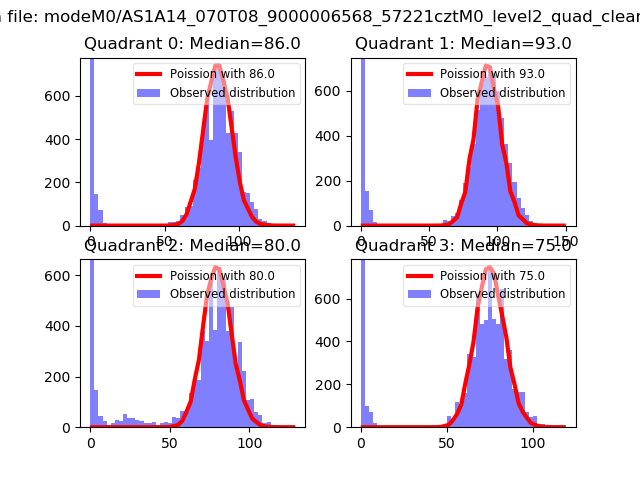 |
 |
| Quadrant-wise count rates Data is divided into 100 sec bins |
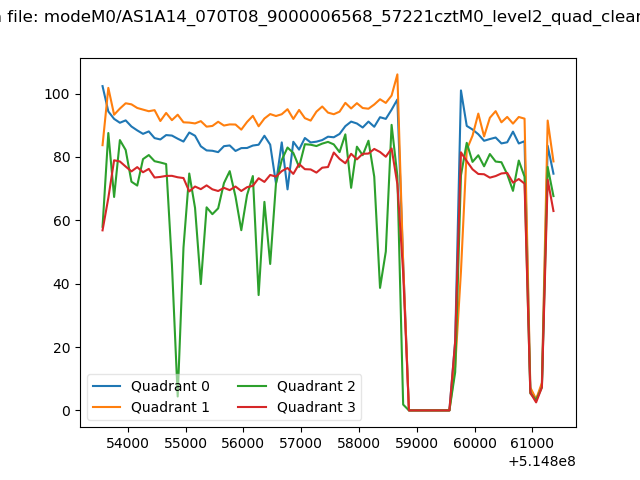 |
|
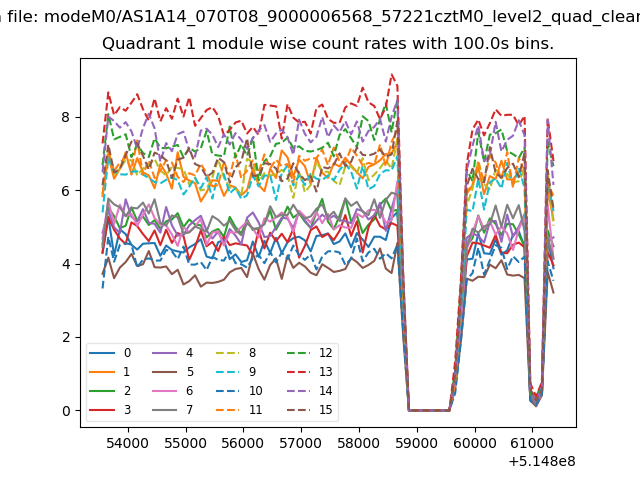
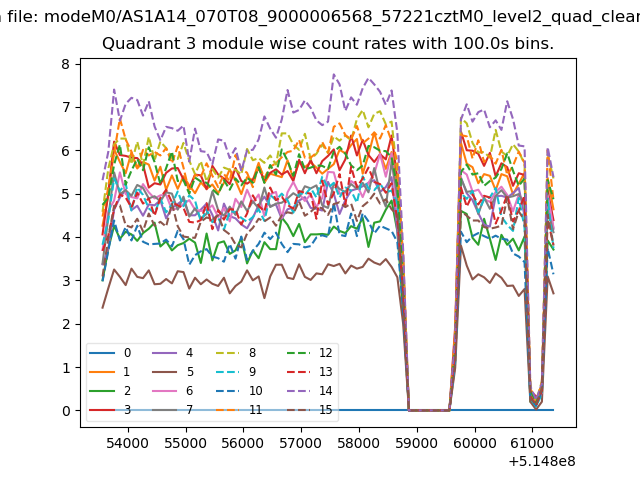
| Module-wise count rates for Quadrant A Data is divided into 100 sec bins |
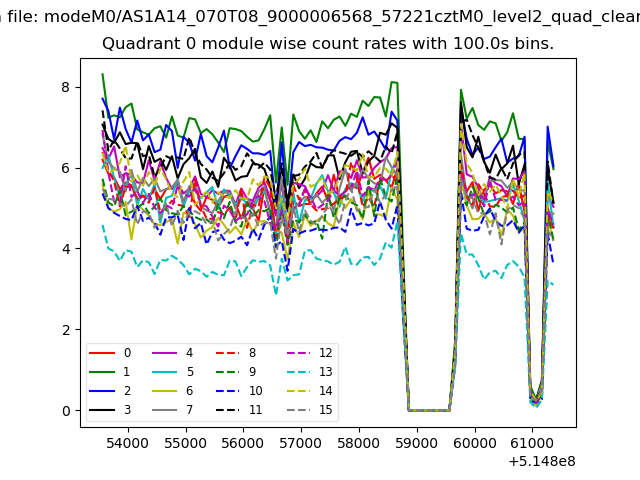 |
 |
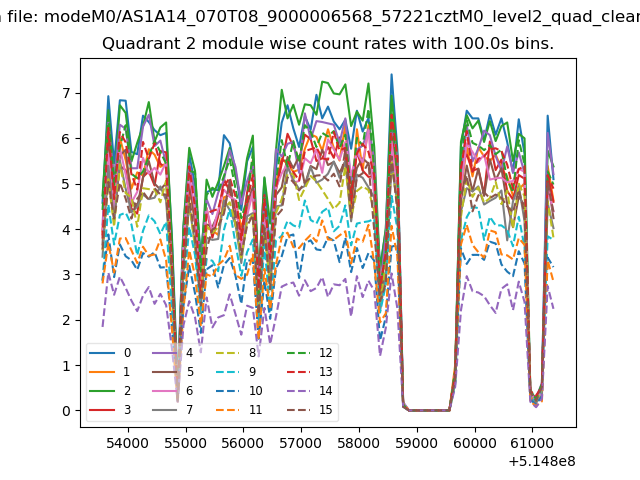
| Module-wise count rates for Quadrant B Data is divided into 100 sec bins |
 |
 |
| Module-wise count rates for Quadrant C Data is divided into 100 sec bins |
 |
 |
| Module-wise count rates for Quadrant D Data is divided into 100 sec bins |
 |
 |
| Parameter | Plot |
|---|---|
| CZT HV Monitor | 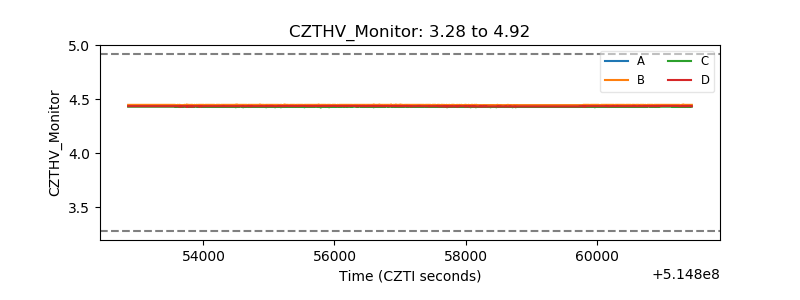 |
| D_VDD | 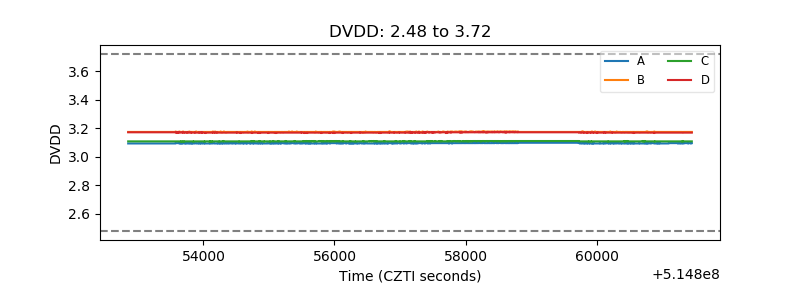 |
| Temperature 1 | 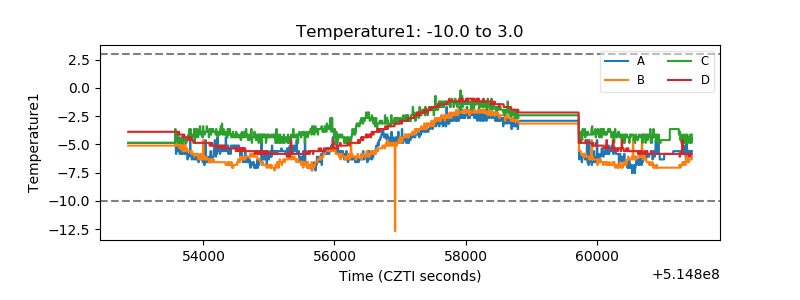 |
| Veto HV Monitor | 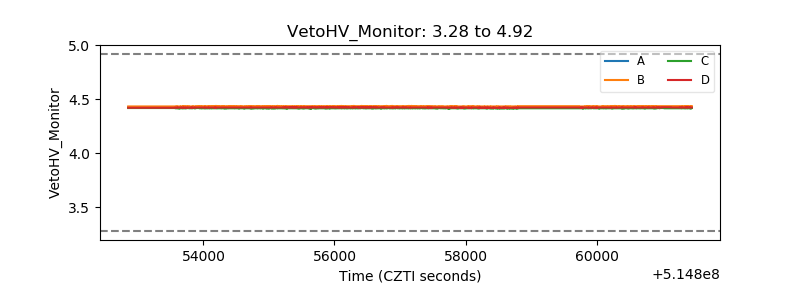 |
| Veto LLD | 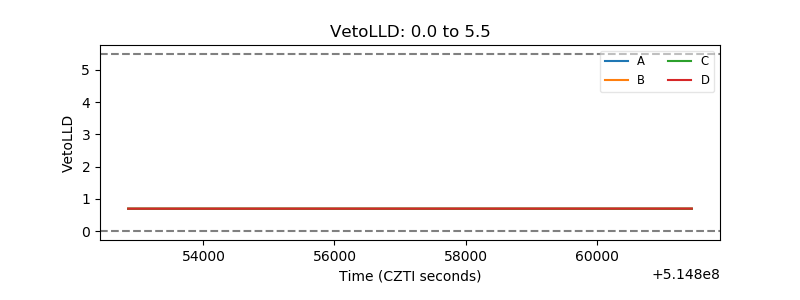 |
| Alpha Counter | 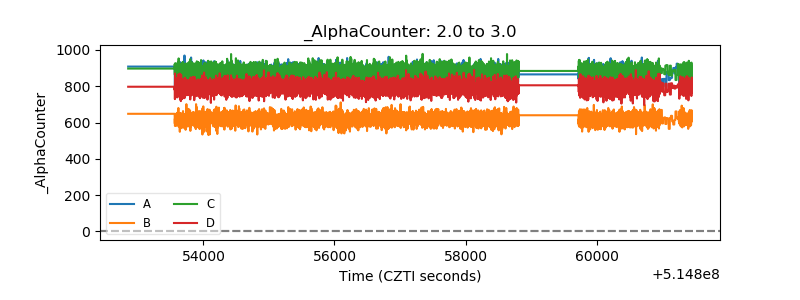 |
| _CPM_Rate | 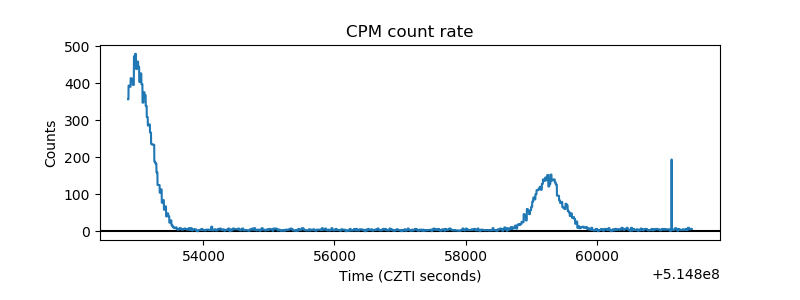 |
| CZT Counter | 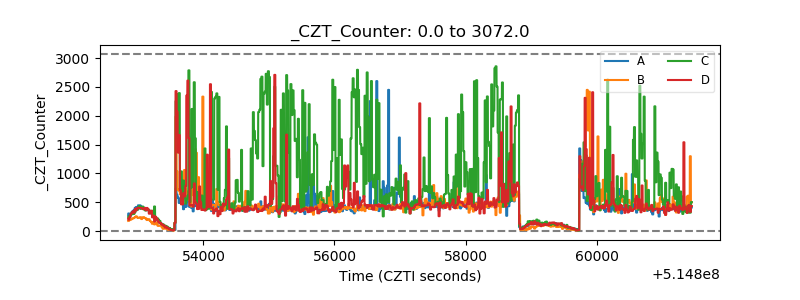 |
| +2.5 Volts monitor | 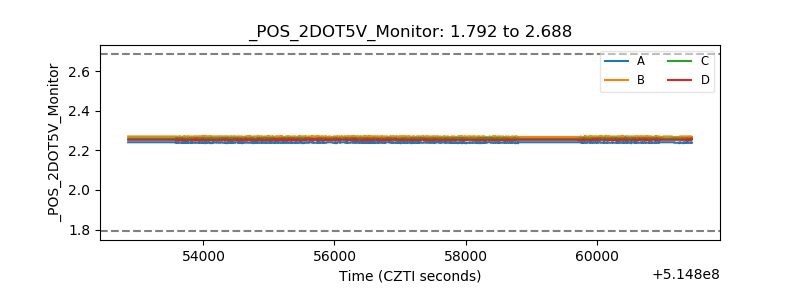 |
| +5 Volts monitor | 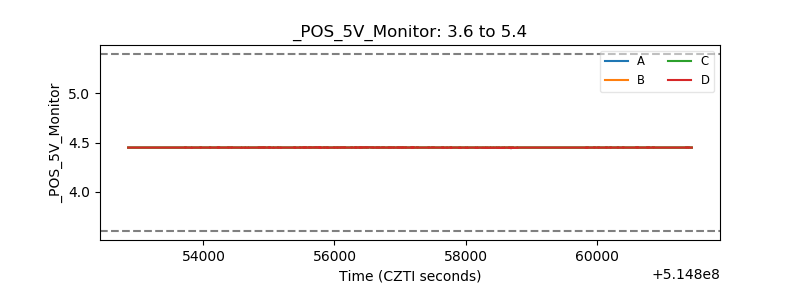 |
| _ROLL_ROT | 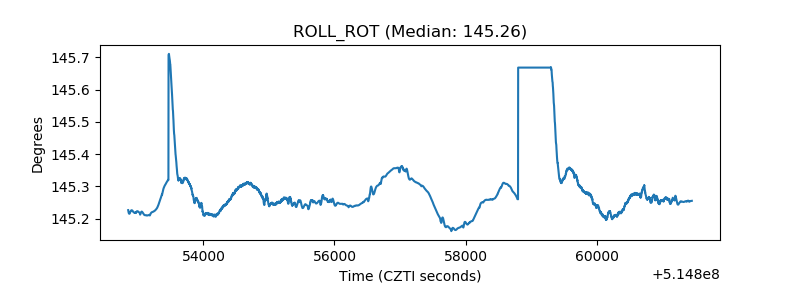 |
| _Roll_DEC | 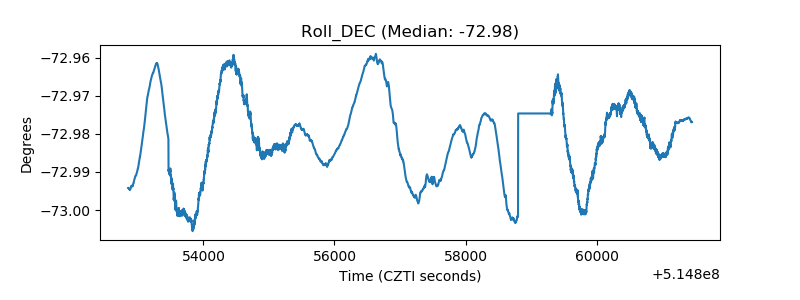 |
| _Roll_RA | 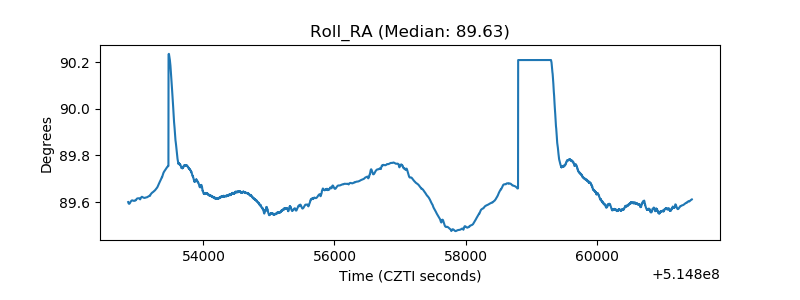 |
| Veto Counter | 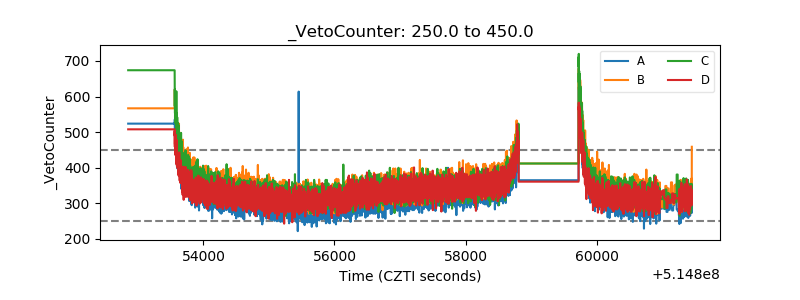 |