| Param | Original file | Final file |
|---|---|---|
| Filename | modeM0/AS1A14_070T08_9000006568_57223cztM0_level2.fits | modeM0/AS1A14_070T08_9000006568_57223cztM0_level2_quad_clean.evt |
| Size (bytes) | 482,474,880 | 113,241,600 |
| Size | 460.1 MB | 108.0 MB |
| Events in quadrant A | 3,331,572 | 747,118 |
| Events in quadrant B | 3,966,497 | 799,300 |
| Events in quadrant C | 6,247,950 | 670,230 |
| Events in quadrant D | 3,697,933 | 661,401 |
| Mode SS | |||
|---|---|---|---|
| Quadrant | BADHDUFLAG | Total packets | Discarded packets |
| A | 0 | 160 | 0 |
| B | 0 | 160 | 0 |
| C | 0 | 160 | 0 |
| D | 0 | 160 | 0 |
| Mode M0 | |||
|---|---|---|---|
| Quadrant | BADHDUFLAG | Total packets | Discarded packets |
| A | 0 | 16213 | 0 |
| B | 0 | 17651 | 0 |
| C | 0 | 24148 | 0 |
| D | 0 | 17092 | 0 |
| Quadrant | Total seconds | Saturated seconds | Saturation percentage |
|---|---|---|---|
| A | 7919 | 11 | 0.138906% |
| B | 7920 | 152 | 1.919192% |
| C | 7919 | 567 | 7.159995% |
| D | 7919 | 37 | 0.467231% |
Noise dominated data is calculated using 1-second bins in cleaned event files. If a bin has >2000 counts, and if more than 50% of those come from <1% of pixels, then it is considered to be noise-dominated and hence unusable.
| Quadrant | # 1 sec bins | Bins with >0 counts | Bins with >2000 counts | High rate bins dominated by noise | Noise dominated (total time) | Noise dominated (detector-on time) | Marked lightcurve |
|---|---|---|---|---|---|---|---|
| A | 7919 | 7919 | 5 | 5 | 0.06% | 0.06% | 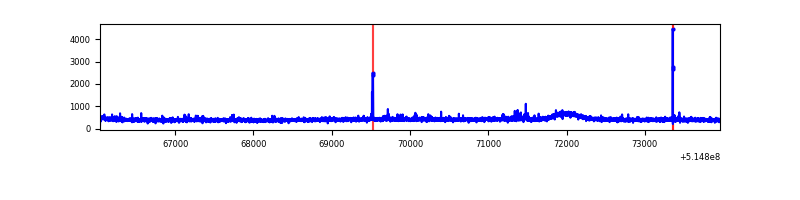 |
| B | 7920 | 7920 | 70 | 70 | 0.88% | 0.88% | 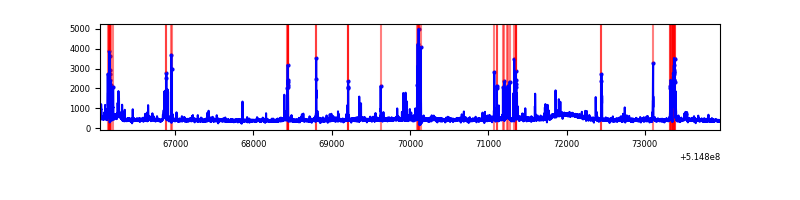 |
| C | 7919 | 7919 | 446 | 446 | 5.63% | 5.63% | 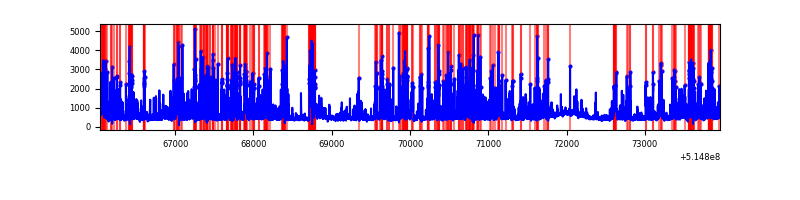 |
| D | 7919 | 7919 | 34 | 34 | 0.43% | 0.43% | 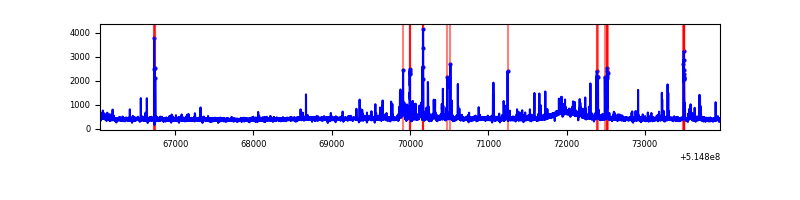 |
Top three noisy pixels from each quadrant. If the there are fewer than three noisy pixels in the level2.evt file, extra rows are filled as -1
| Pixel properties | Quadrant properties | ||||||
|---|---|---|---|---|---|---|---|
| Quadrant | DetID | PixID | Counts | Sigma | Mean | Median | Sigma |
| A | 13 | 248 | 27717 | 129.53 | 839 | 819 | 207.7 |
| A | 10 | 251 | 27430 | 128.15 | 839 | 819 | 207.7 |
| A | 4 | 13 | 14284 | 64.84 | 839 | 819 | 207.7 |
| B | 10 | 247 | 169828 | 951.51 | 834 | 800 | 177.6 |
| B | 4 | 201 | 154685 | 866.27 | 834 | 800 | 177.6 |
| B | 10 | 16 | 75606 | 421.11 | 834 | 800 | 177.6 |
| C | 15 | 224 | 2564244 | 11935.37 | 801 | 792 | 214.8 |
| C | 12 | 254 | 406444 | 1888.7 | 801 | 792 | 214.8 |
| C | 14 | 254 | 52398 | 240.27 | 801 | 792 | 214.8 |
| D | 3 | 12 | 100291 | 436.79 | 813 | 775 | 227.8 |
| D | 8 | 160 | 65817 | 285.48 | 813 | 775 | 227.8 |
| D | 8 | 240 | 62190 | 269.56 | 813 | 775 | 227.8 |
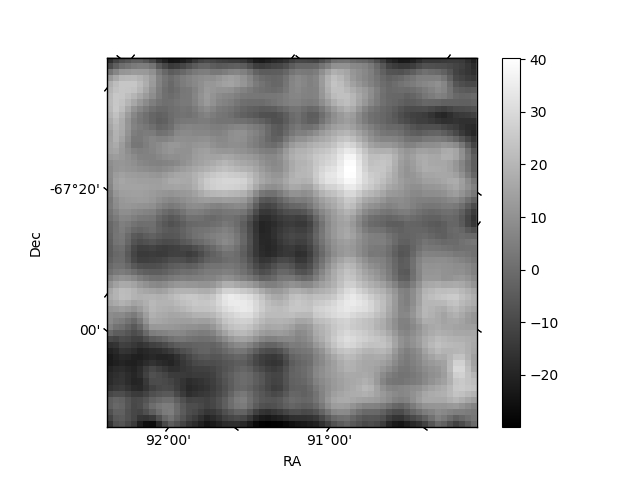
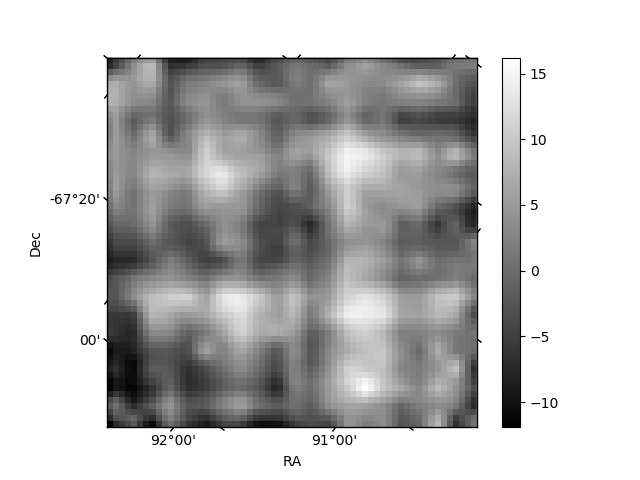
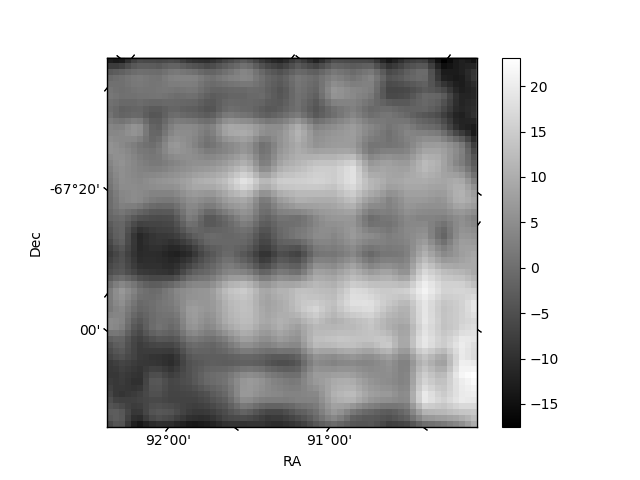
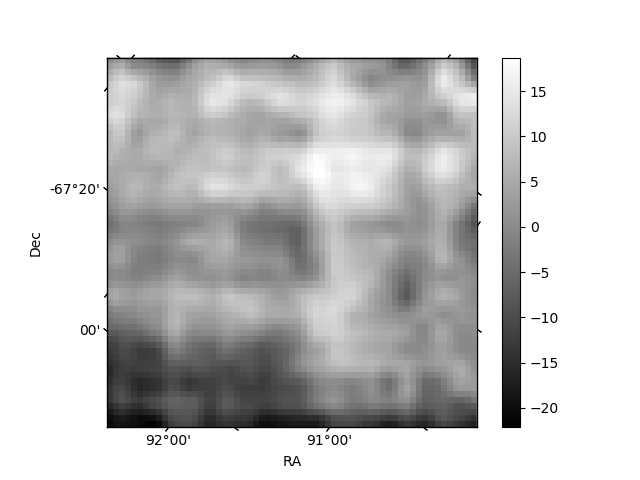
Histogram calculated using DETX and DETY for each event in the final _common_clean file
| Quadrant A | 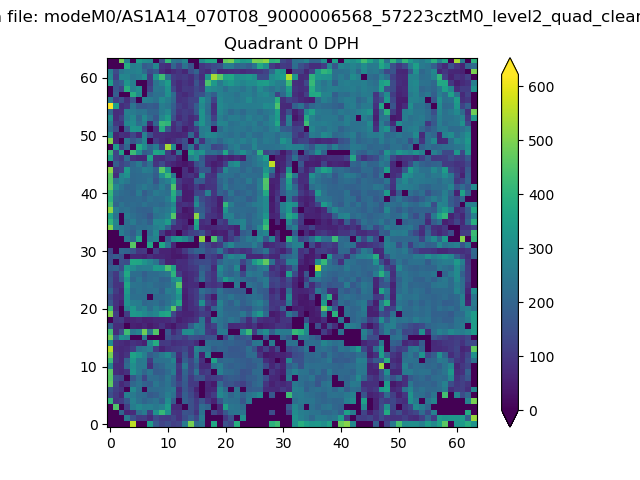 |
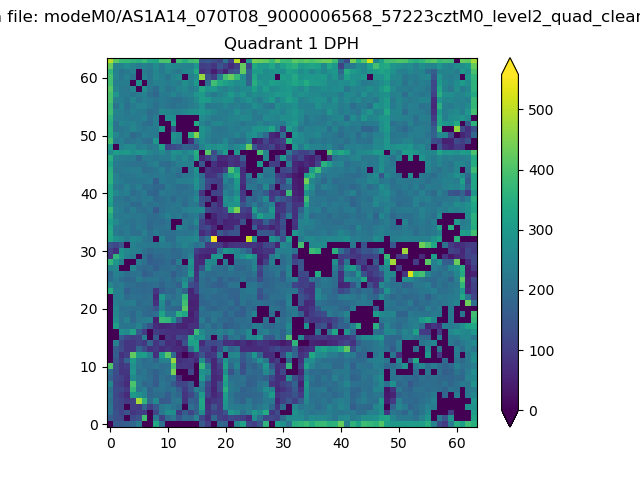 |
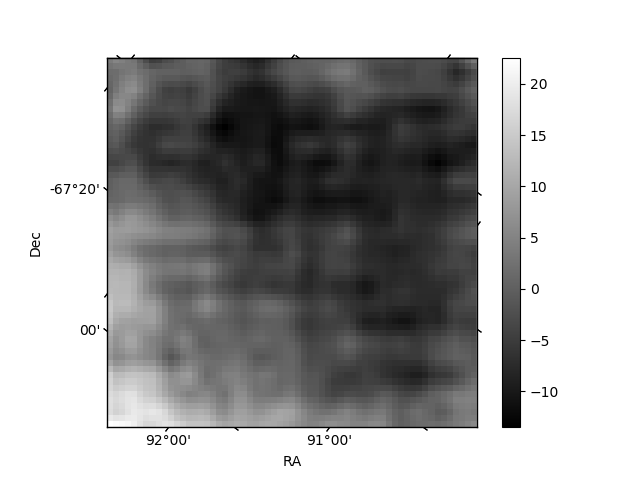
Quadrant B |
|---|---|---|---|
| Quadrant D | 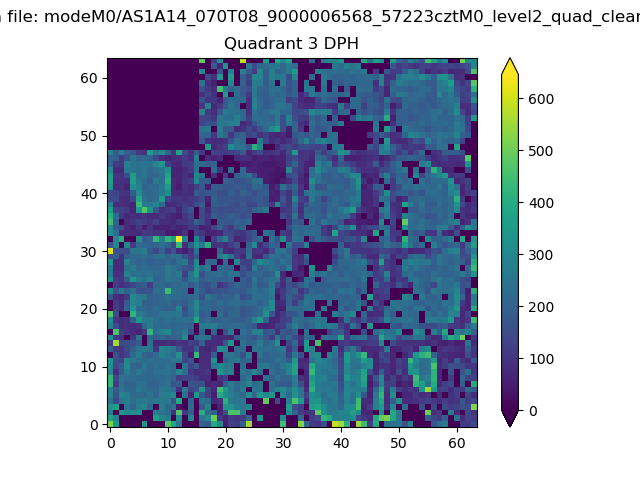 |
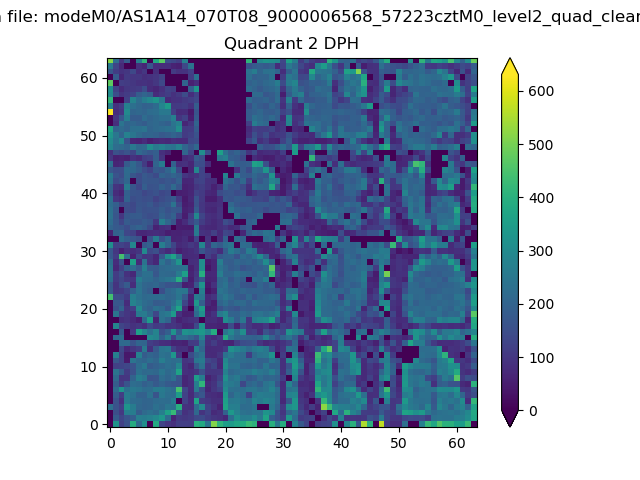 |
Quadrant C |
| Plot type | Count rate plots | Images |
|---|---|---|
| Comparison with Poisson distribution Blue bars denote a histogram of data divided into 1 sec bins. Red curve is a Poisson curve with rate = median count rate of data. |
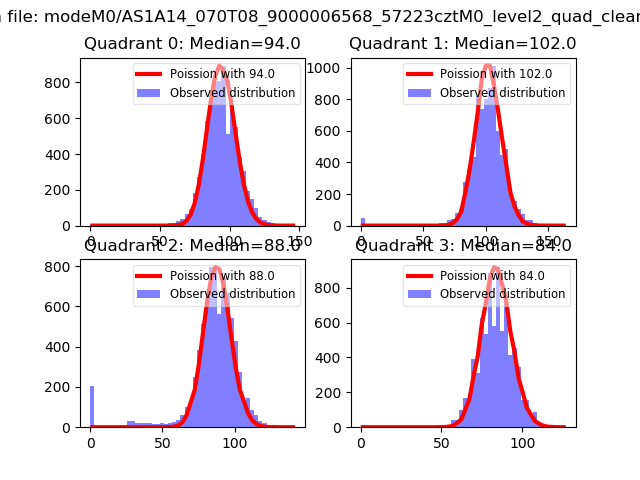 |
 |
| Quadrant-wise count rates Data is divided into 100 sec bins |
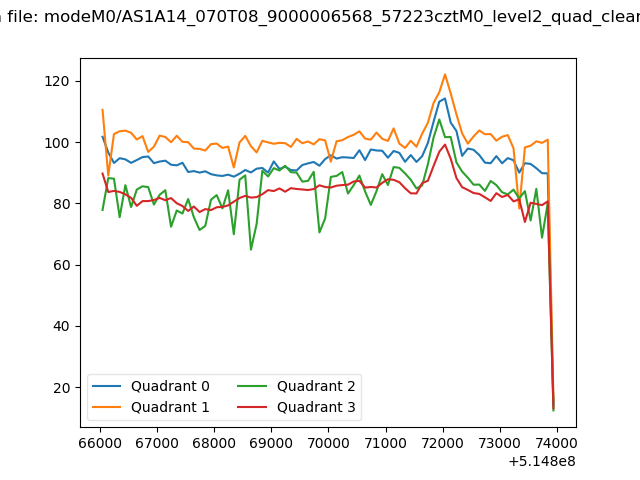 |
|
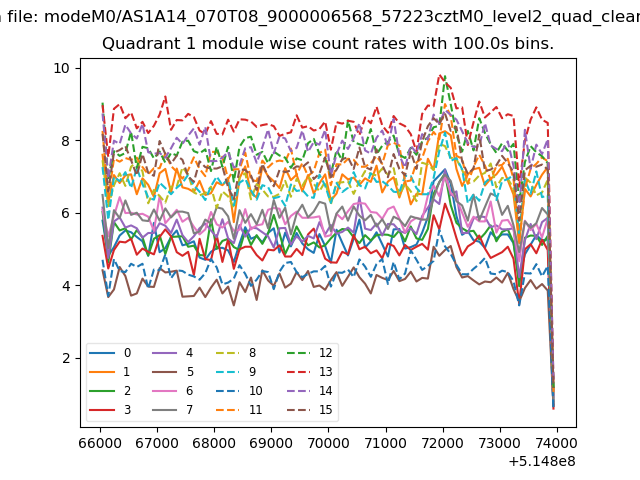
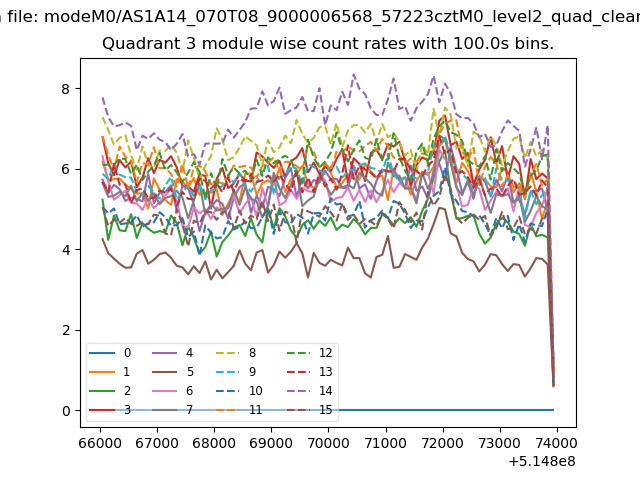
| Module-wise count rates for Quadrant A Data is divided into 100 sec bins |
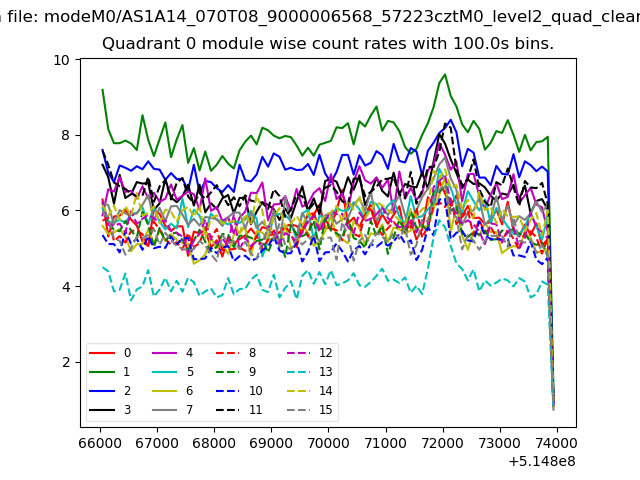 |
 |
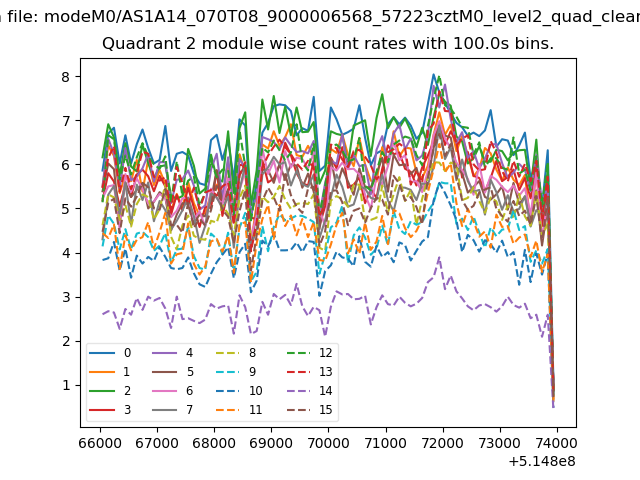
| Module-wise count rates for Quadrant B Data is divided into 100 sec bins |
 |
 |
| Module-wise count rates for Quadrant C Data is divided into 100 sec bins |
 |
 |
| Module-wise count rates for Quadrant D Data is divided into 100 sec bins |
 |
 |
| Parameter | Plot |
|---|---|
| CZT HV Monitor | 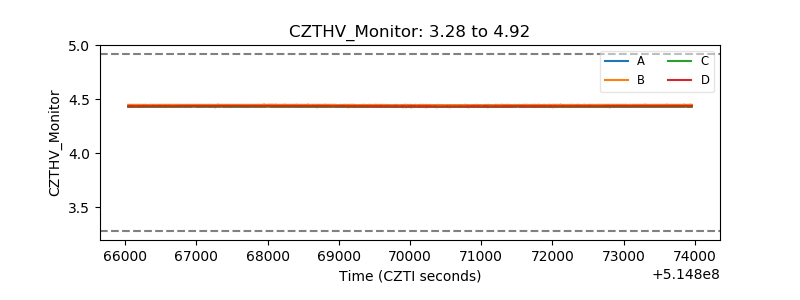 |
| D_VDD | 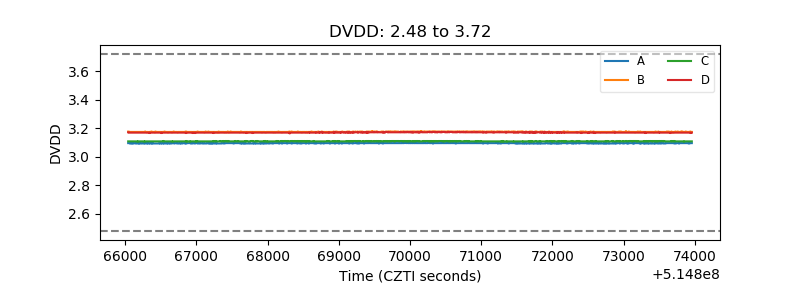 |
| Temperature 1 | 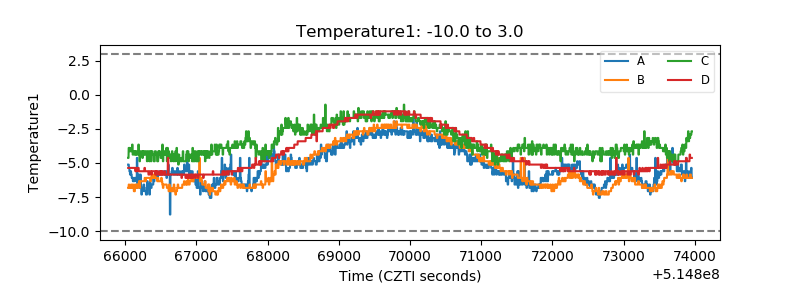 |
| Veto HV Monitor | 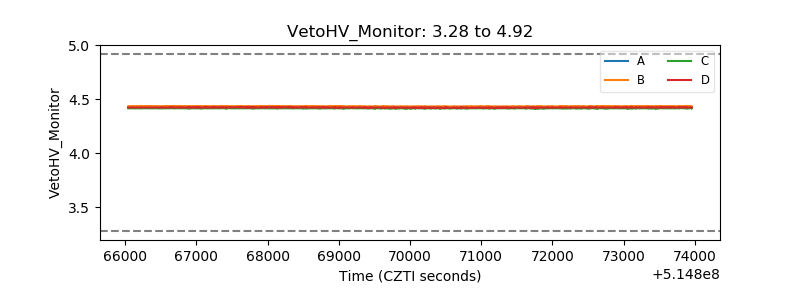 |
| Veto LLD | 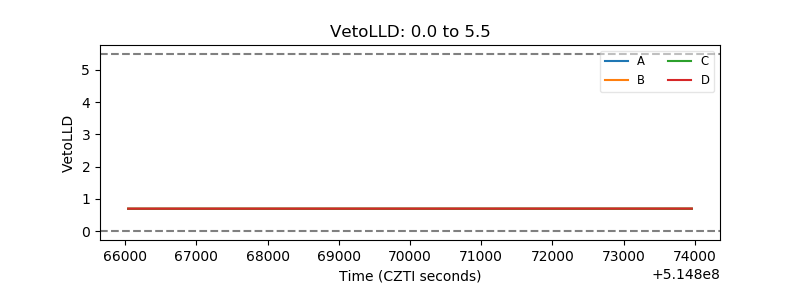 |
| Alpha Counter | 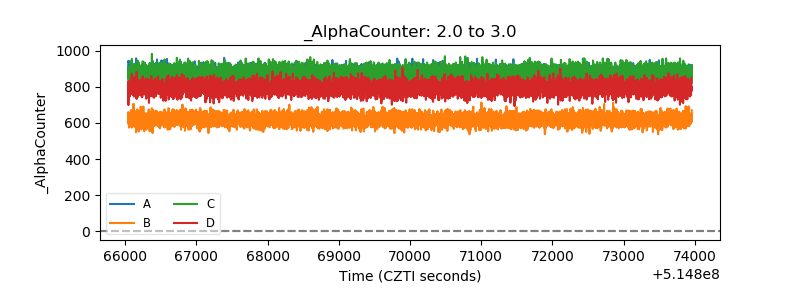 |
| _CPM_Rate | 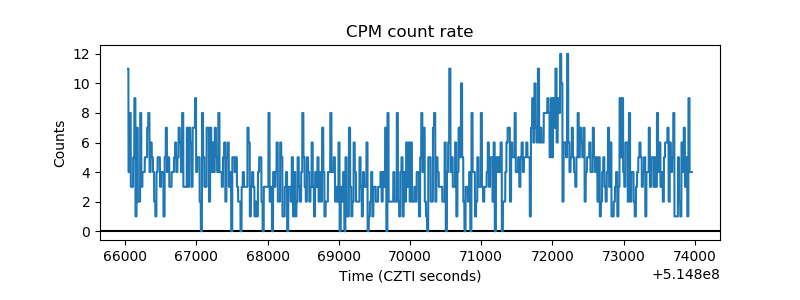 |
| CZT Counter | 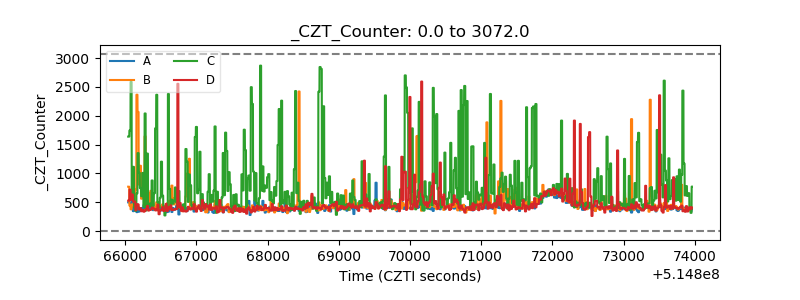 |
| +2.5 Volts monitor | 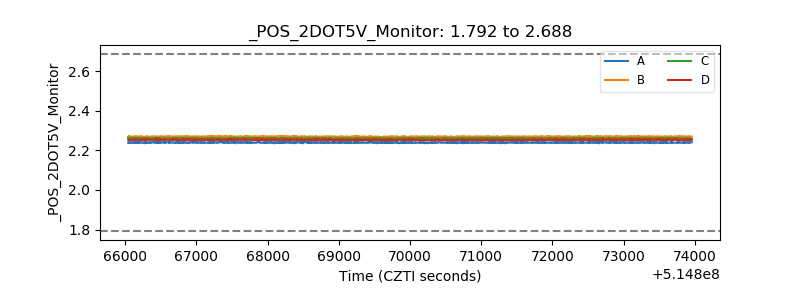 |
| +5 Volts monitor |  |
| _ROLL_ROT | 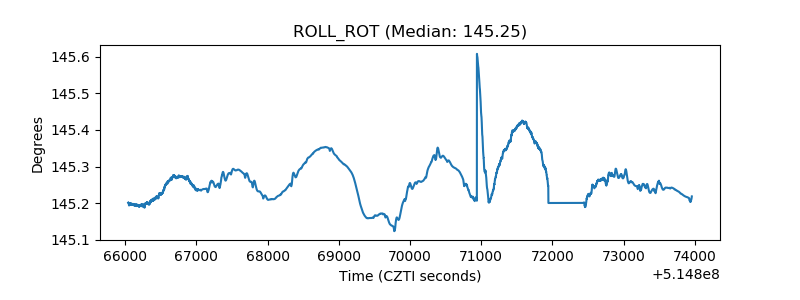 |
| _Roll_DEC | 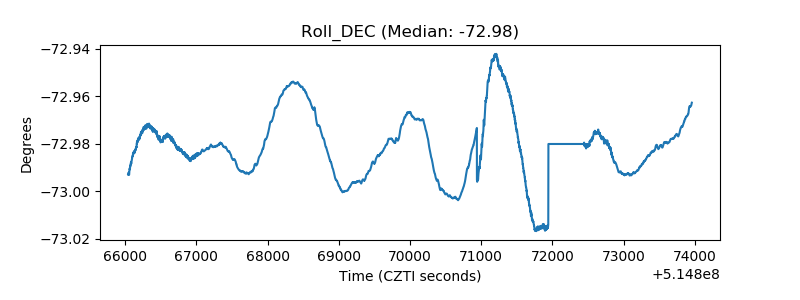 |
| _Roll_RA | 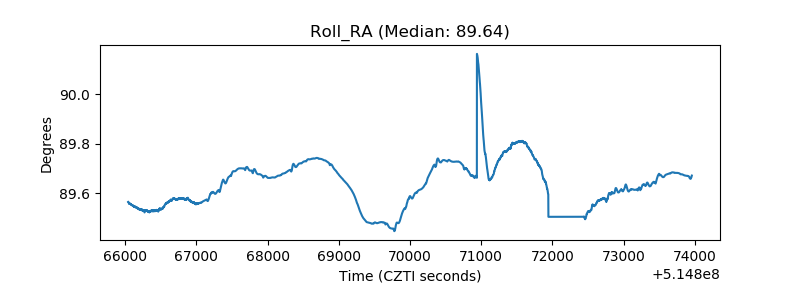 |
| Veto Counter | 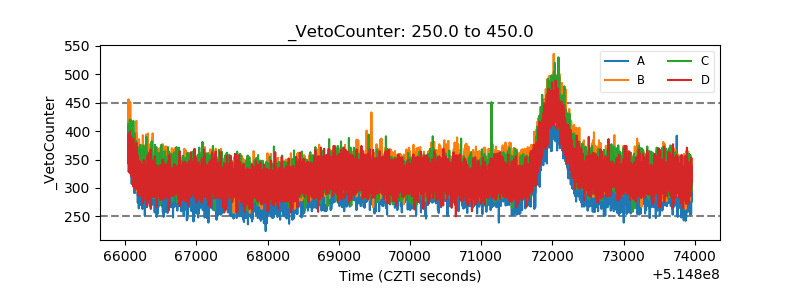 |