| Param | Original file | Final file |
|---|---|---|
| Filename | modeM0/AS1A14_070T08_9000006568_57224cztM0_level2.fits | modeM0/AS1A14_070T08_9000006568_57224cztM0_level2_quad_clean.evt |
| Size (bytes) | 483,802,560 | 109,301,760 |
| Size | 461.4 MB | 104.2 MB |
| Events in quadrant A | 3,318,316 | 722,359 |
| Events in quadrant B | 3,997,561 | 770,831 |
| Events in quadrant C | 6,085,064 | 647,923 |
| Events in quadrant D | 3,911,108 | 634,329 |
| Mode SS | |||
|---|---|---|---|
| Quadrant | BADHDUFLAG | Total packets | Discarded packets |
| A | 0 | 154 | 0 |
| B | 0 | 154 | 0 |
| C | 0 | 154 | 0 |
| D | 0 | 154 | 0 |
| Mode M0 | |||
|---|---|---|---|
| Quadrant | BADHDUFLAG | Total packets | Discarded packets |
| A | 0 | 15864 | 0 |
| B | 0 | 17515 | 0 |
| C | 0 | 23440 | 0 |
| D | 0 | 17251 | 0 |
| Quadrant | Total seconds | Saturated seconds | Saturation percentage |
|---|---|---|---|
| A | 7674 | 16 | 0.208496% |
| B | 7674 | 160 | 2.084962% |
| C | 7674 | 619 | 8.066198% |
| D | 7674 | 144 | 1.876466% |
Noise dominated data is calculated using 1-second bins in cleaned event files. If a bin has >2000 counts, and if more than 50% of those come from <1% of pixels, then it is considered to be noise-dominated and hence unusable.
| Quadrant | # 1 sec bins | Bins with >0 counts | Bins with >2000 counts | High rate bins dominated by noise | Noise dominated (total time) | Noise dominated (detector-on time) | Marked lightcurve |
|---|---|---|---|---|---|---|---|
| A | 7674 | 7674 | 15 | 15 | 0.20% | 0.20% | 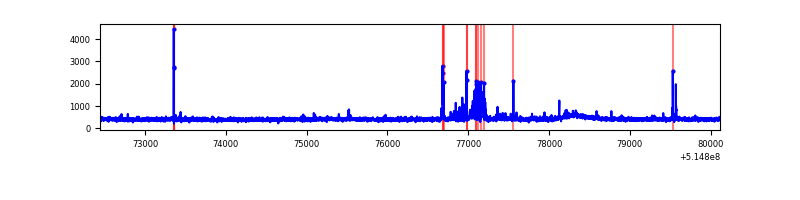 |
| B | 7674 | 7674 | 91 | 91 | 1.19% | 1.19% | 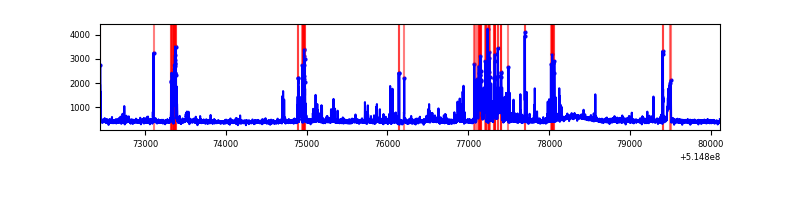 |
| C | 7673 | 7673 | 471 | 471 | 6.14% | 6.14% | 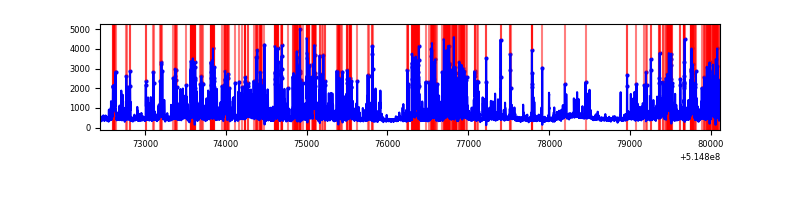 |
| D | 7674 | 7674 | 144 | 144 | 1.88% | 1.88% | 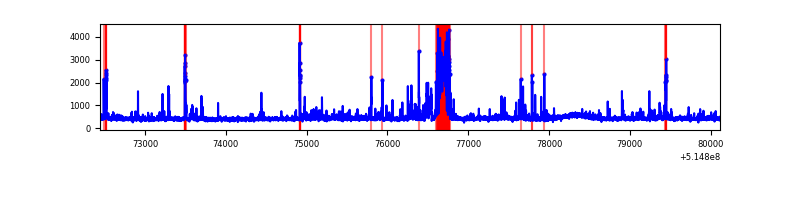 |
Top three noisy pixels from each quadrant. If the there are fewer than three noisy pixels in the level2.evt file, extra rows are filled as -1
| Pixel properties | Quadrant properties | ||||||
|---|---|---|---|---|---|---|---|
| Quadrant | DetID | PixID | Counts | Sigma | Mean | Median | Sigma |
| A | 4 | 13 | 112631 | 559.46 | 806 | 786 | 199.9 |
| A | 10 | 251 | 45057 | 221.45 | 806 | 786 | 199.9 |
| A | 4 | 236 | 31496 | 153.61 | 806 | 786 | 199.9 |
| B | 4 | 201 | 533082 | 3122.71 | 799 | 767 | 170.5 |
| B | 5 | 185 | 110098 | 641.37 | 799 | 767 | 170.5 |
| B | 7 | 252 | 59702 | 345.73 | 799 | 767 | 170.5 |
| C | 15 | 224 | 2753408 | 13298.46 | 765 | 756 | 207.0 |
| C | 12 | 254 | 94017 | 450.55 | 765 | 756 | 207.0 |
| C | 14 | 254 | 78448 | 375.34 | 765 | 756 | 207.0 |
| D | 9 | 102 | 376781 | 1724.16 | 776 | 741 | 218.1 |
| D | 3 | 12 | 103917 | 473.07 | 776 | 741 | 218.1 |
| D | 5 | 173 | 62950 | 285.23 | 776 | 741 | 218.1 |
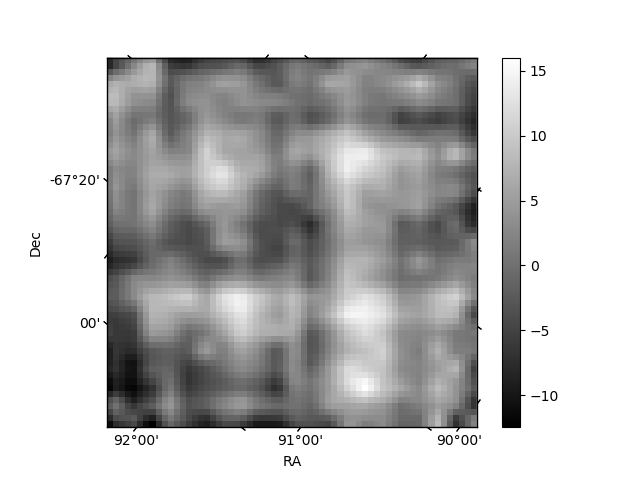
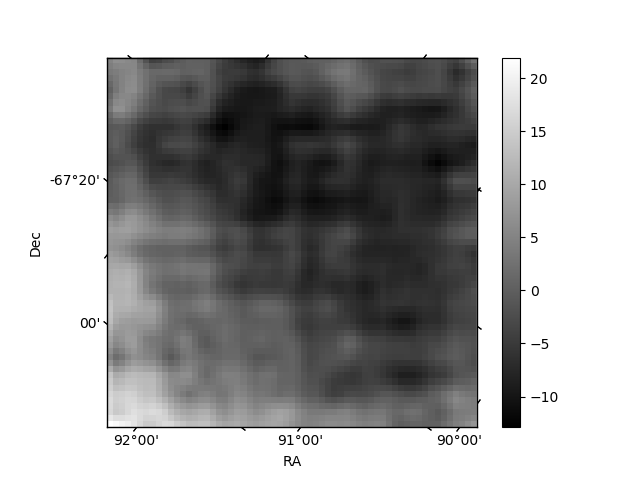
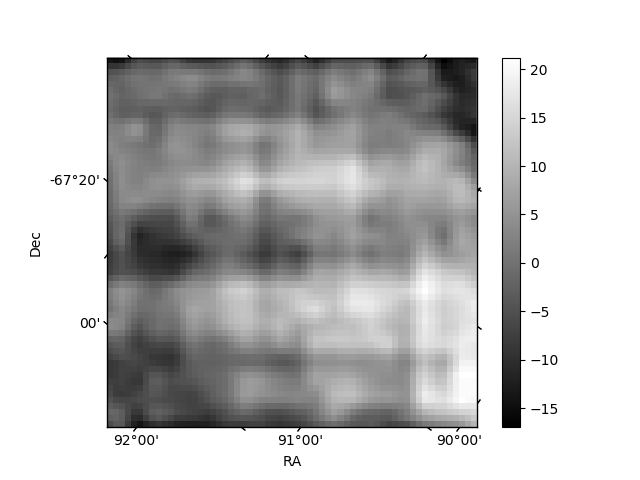
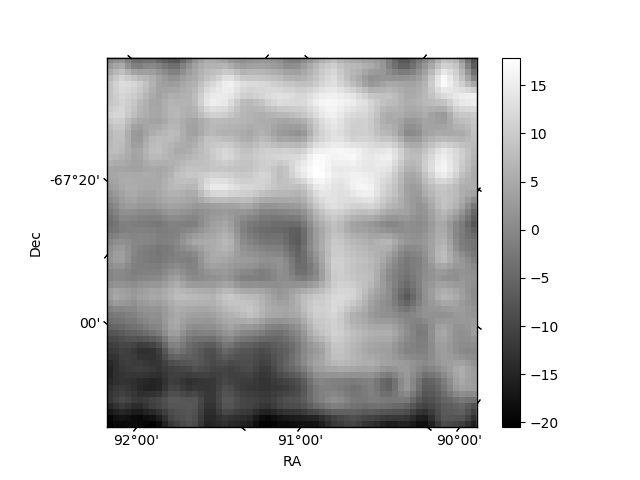
Histogram calculated using DETX and DETY for each event in the final _common_clean file
| Quadrant A | 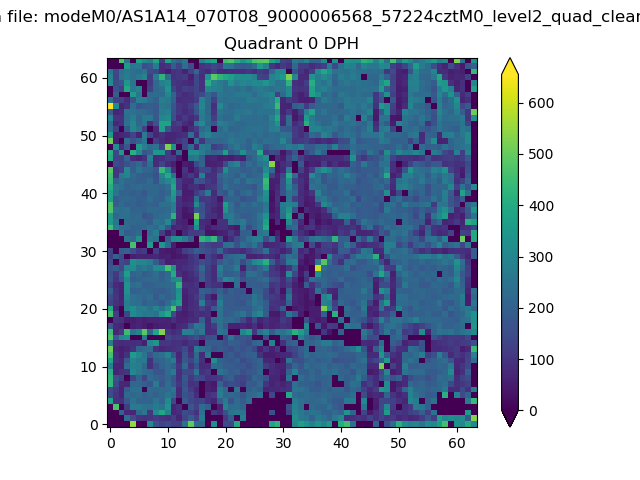 |
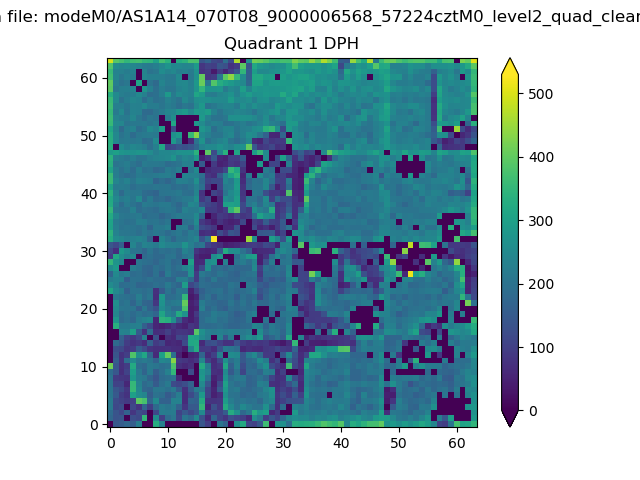 |
Quadrant B |
|---|---|---|---|
| Quadrant D | 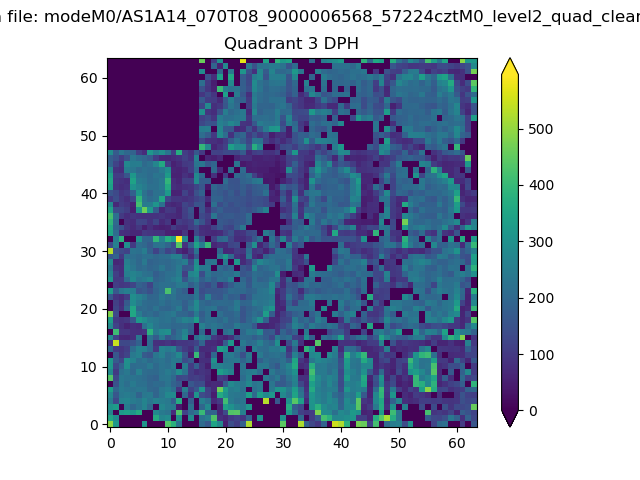 |
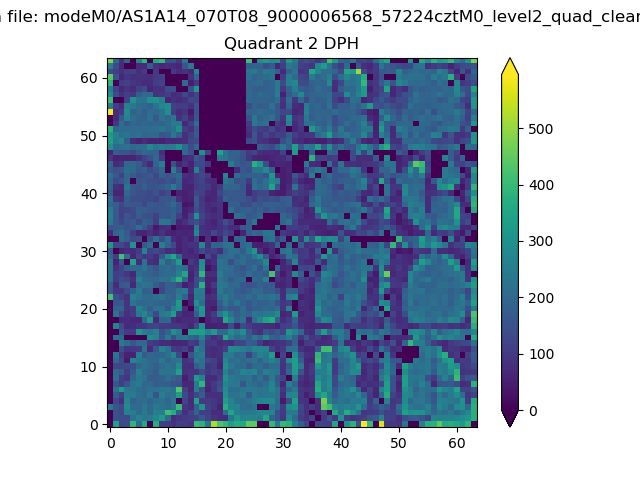 |
Quadrant C |
| Plot type | Count rate plots | Images |
|---|---|---|
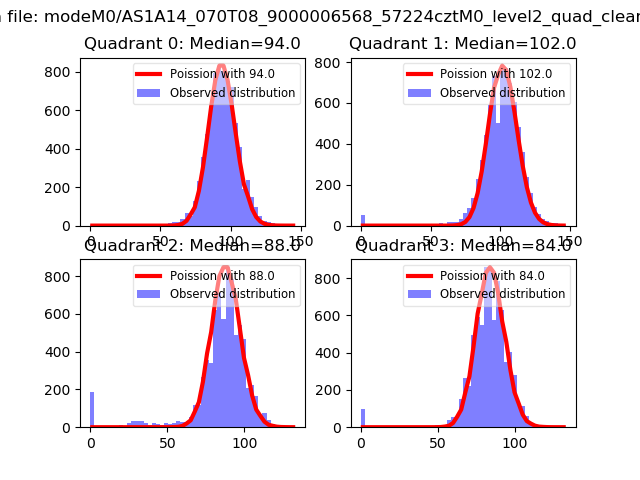
| Comparison with Poisson distribution Blue bars denote a histogram of data divided into 1 sec bins. Red curve is a Poisson curve with rate = median count rate of data. |
 |
 |
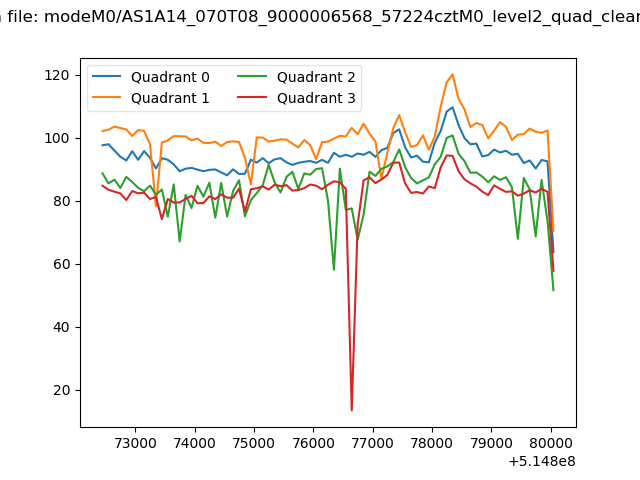
| Quadrant-wise count rates Data is divided into 100 sec bins |
 |
|
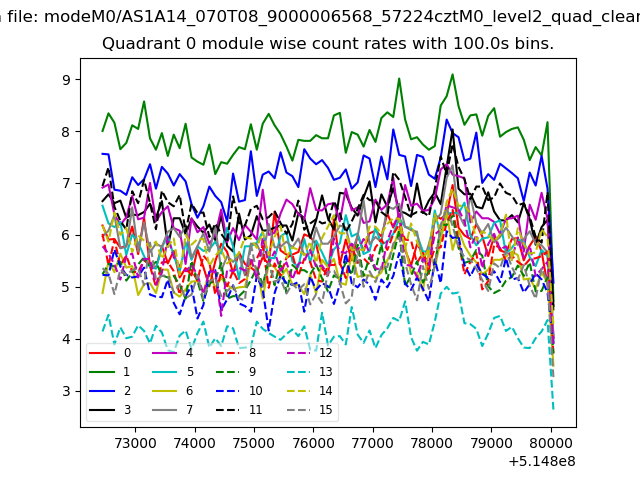
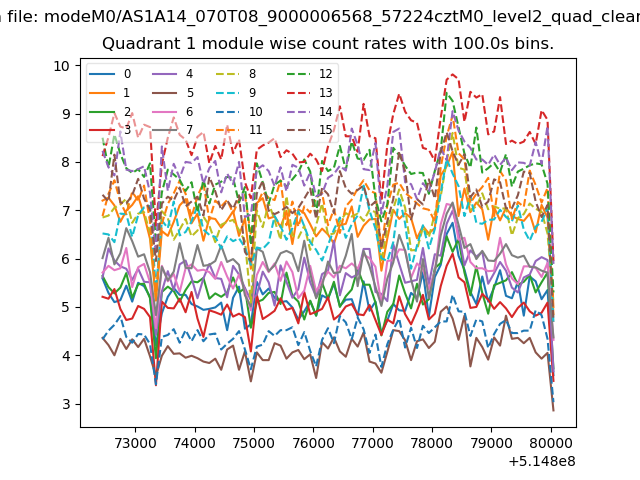
| Module-wise count rates for Quadrant A Data is divided into 100 sec bins |
 |
 |
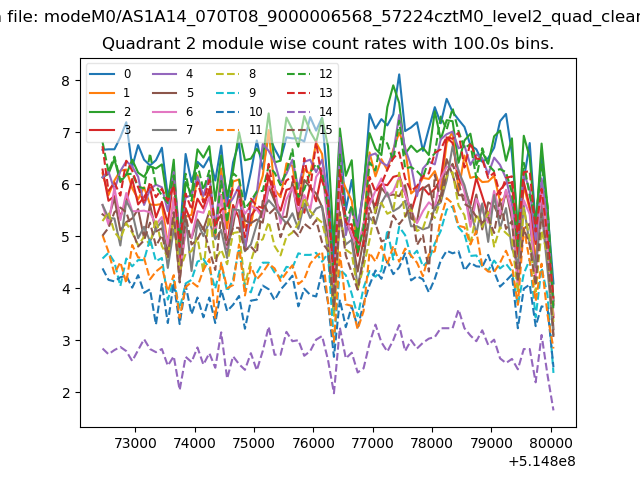
| Module-wise count rates for Quadrant B Data is divided into 100 sec bins |
 |
 |
| Module-wise count rates for Quadrant C Data is divided into 100 sec bins |
 |
 |
| Module-wise count rates for Quadrant D Data is divided into 100 sec bins |
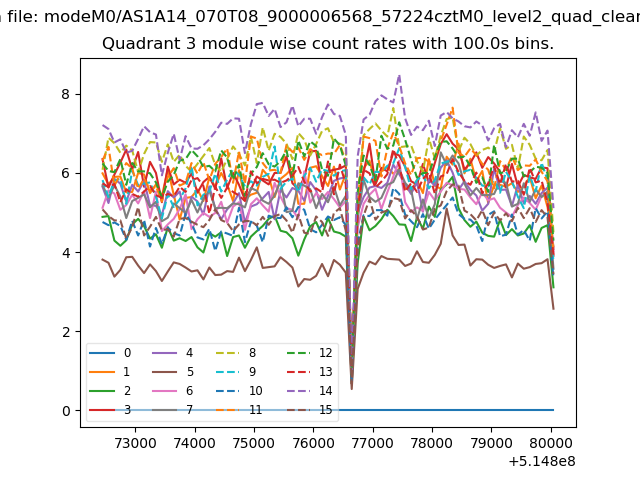 |
 |
| Parameter | Plot |
|---|---|
| CZT HV Monitor | 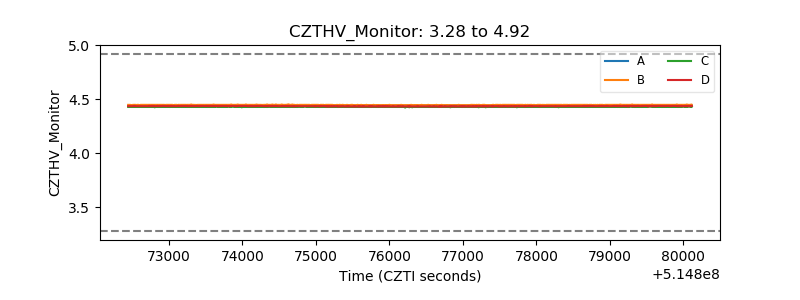 |
| D_VDD | 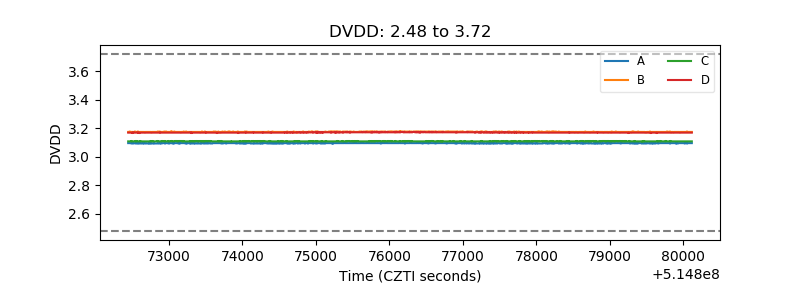 |
| Temperature 1 | 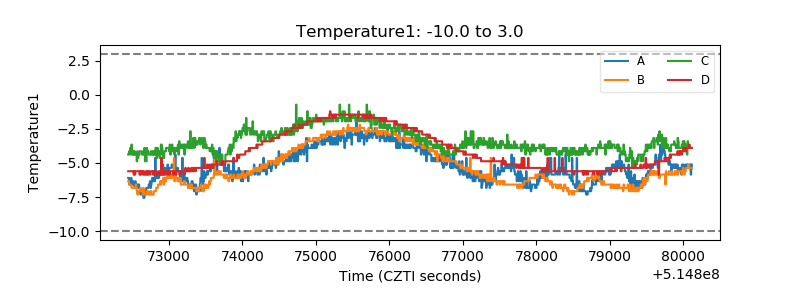 |
| Veto HV Monitor | 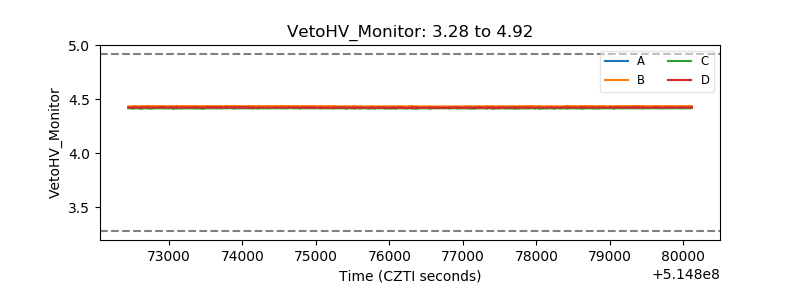 |
| Veto LLD | 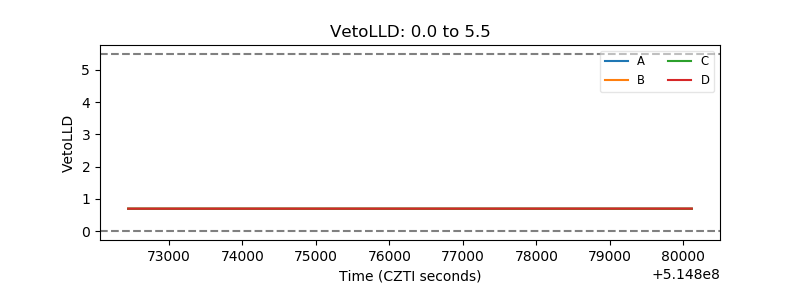 |
| Alpha Counter | 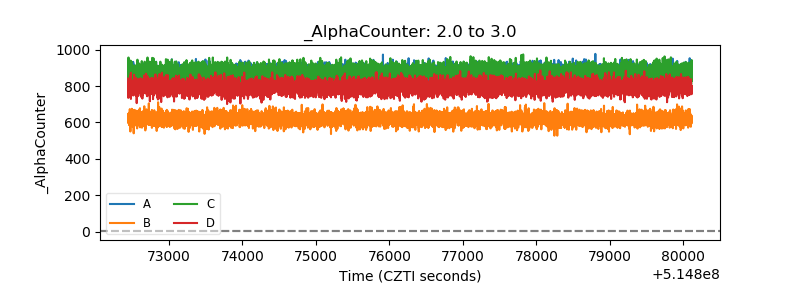 |
| _CPM_Rate | 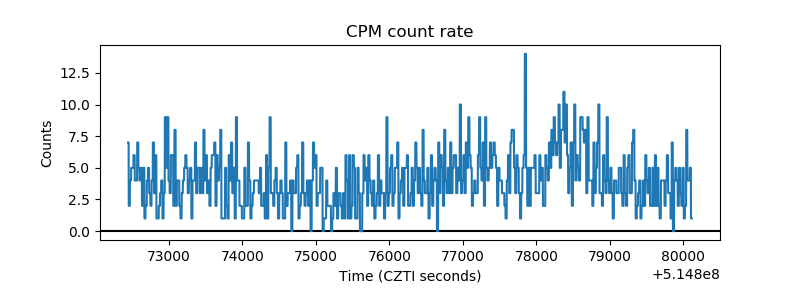 |
| CZT Counter | 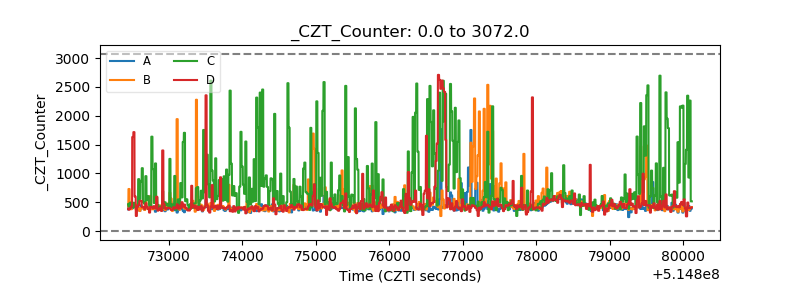 |
| +2.5 Volts monitor |  |
| +5 Volts monitor | 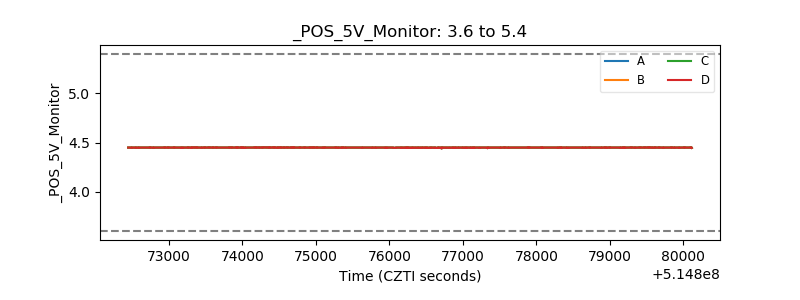 |
| _ROLL_ROT | 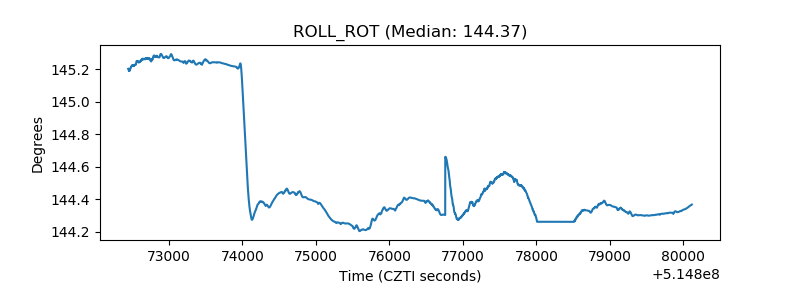 |
| _Roll_DEC | 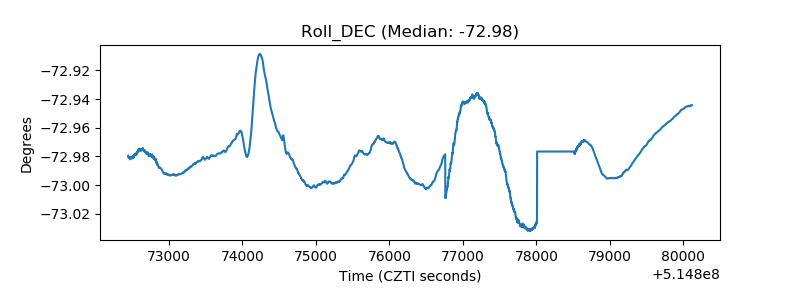 |
| _Roll_RA | 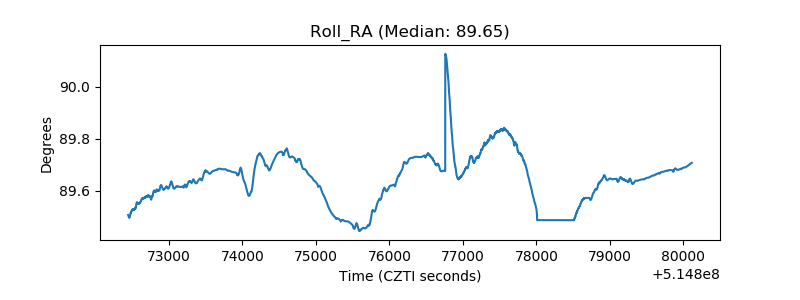 |
| Veto Counter | 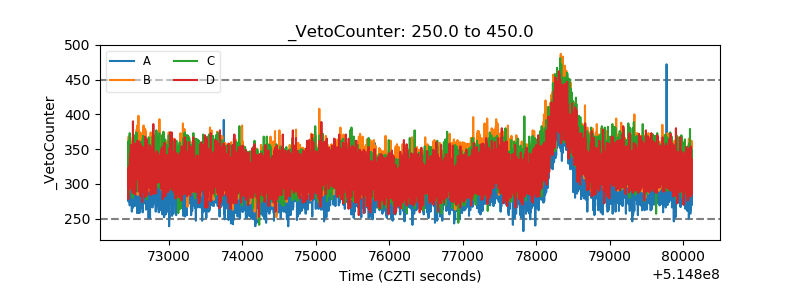 |